New Castle County Air Quality Conformity Determination
|
|
|
- Chad Goodman
- 5 years ago
- Views:
Transcription

1 New Castle County Air Quality Conformity Determination for the FY Transportation Improvement Program and 2040 Regional Transportation Plan
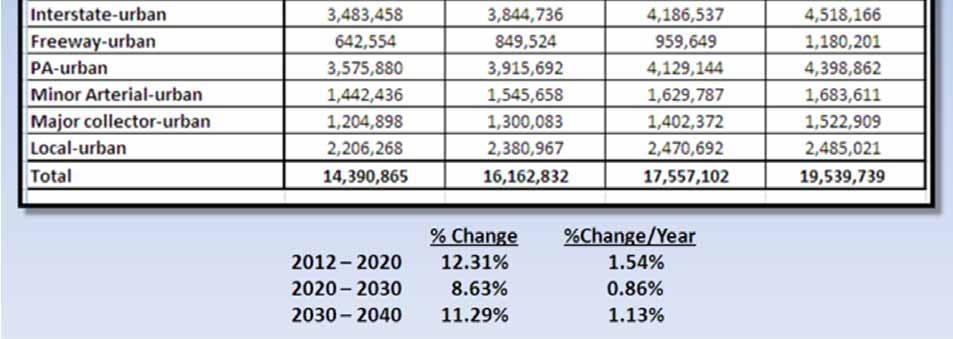
2 Partners with you in transportation planning FY TIP and 2040 RTP Conformity Analysis New Castle County, Delaware Contents Introduction...2 Status of the TIP and RTP...7 Air Quality Modeling Methodology Conformity Question Matrix Conformity Analysis.. 22 Appendices Public Comments... NCC A Recent Modeling Updates....NCC B 1
3 Air Quality Conformity for New Castle County, Delaware Introduction: This report demonstrates transportation conformity of the Wilmington Area Planning Council s (WILMAPCO) Fiscal Year (FY) Transportation Improvement Program (TIP) and the 2040 Regional Transportation Plan (RTP) for the New Castle County, Delaware portion of the PA NJ MD DE 8 hour ozone nonattainment area and the PA NJ DE fine particulate matter (PM2.5) nonattainment area. This document replaces the previous approved conformity demonstration of the TIP and RTP and ensures that the findings meet all current and imminent conformity criteria established by the United States Environmental Protection Agency (EPA). Background on 8-Hour Ozone Ozone is an odorless, colorless, gas created by a reaction between nitrogen oxides (NOx) and volatile organic compounds (VOC) in the presence of sunlight. While ozone in the stratosphere forms a protective layer that shields earth from the sun s harmful rays, ground level ozone is a key contributor to smog. Motor vehicle exhaust, industrial emissions, gasoline vapors, chemical solvents, and natural sources all contribute to NOx and VOC emissions. Since ozone is formed in the presence of heat and sunlight, it is considered a summertime pollutant. The health effects of ozone vary. Ozone can irritate airways and cause inflammation similar to sunburn. Other symptoms include wheezing, coughing, and pain when taking a deep breath and breathing difficulties during exercise or outdoor activities. People with respiratory problems, children and the elderly are most vulnerable, but even healthy people that are active outdoors can be affected when ozone levels are high. Even at very low levels, ground level ozone triggers a variety of health problems including aggravated asthma, reduced lung capacity, and increased susceptibility to respiratory illnesses such as pneumonia and bronchitis. 2
4 In addition to adverse health effects, ground level ozone also interferes with the ability of plants to produce and store food, which makes them more susceptible to disease, insects, other pollutants, and harsh weather. Furthermore, ozone damages the leaves of trees and other plants, ruining the appearance of cities, national parks, and recreation areas. The Clean Air Act (last amended in 1990) requires EPA to set National Ambient Air Quality Standards (NAAQS, 40 CFR Part 50) for ozone and five other criteria pollutants considered harmful to public health and the environment (the other pollutants are particulate matter, nitrogen oxides, carbon monoxide, sulfur dioxide and lead). The law also requires EPA to periodically review the standards to ensure that they provide adequate health and environmental protection, and to update those standards as necessary. In 1997, the EPA issued the 8 hour ozone (NAAQS) in order to protect public health. That standard was an 8 hour average concentration of ppm. The fourth highest value in a year, rounded to the nearest 0.01 and averaged over three years, may not exceed this level at any monitor in the area. On April 15, 2004, EPA promulgated final designations (classifications according to severity) for those areas that were in nonattainment status for the 8 hour ozone standard. Following some modifications those designations became final on June 15, Through this process EPA designated the PA NJ MD DE area as moderate nonattainment for the hour ozone standard. This classification resulted in an attainment date of six years following the original designations or, June 2010, for the PA NJ MD DE nonattainment area. On March 27, 2008 the EPA lowered the ozone NAAQS from ppm to ppm. In April and May 2012, EPA completed area designations for the 2008 ozone standards. New Castle County and Sussex County were designated as marginal nonattainment. New Castle County continues to be in the Philadelphia Wilmington nonattainment area while Sussex County became the Seaford, Delaware nonattainment area. New Castle County is still in nonattainment for the PM2.5 NAAQS States or areas with a designated marginal ozone nonattainment status are not required to submit State Implementation Plans (SIPs) to the EPA outlining how they will meet the ozone standard. Nevertheless, states must keep in place those measures to reduce emissions they had in the SIP under the 1997 ozone standard. The 1997 standard SIP include mobile source emissions budgets used in conformity analyses, such as those presented in this report. 3
5 States or areas that have been designated as nonattainment areas are subject to the transportation conformity process. Transportation conformity requires nonattainment and maintenance areas to demonstrate that all future transportation projects will not hinder the area from reaching and maintaining its attainment goals outlined in SIPs. In particular, transportation conformity requires analysis that planned transportation related projects will not: Cause or contribute to new air quality violations of the NAAQS. Worsen existing violations of the NAAQS. Delay timely attainment of the relevant NAAQS. In October 2011, the Secretary of the Department of Natural Resources and Environmental Control (DNREC) issued orders finalizing new motor vehicle emissions budgets as part of Delaware s Revised 2008 SIP for the attainment of the PM2.5 NAAQS. This SIP updates mobile source budgets based on newer Environmental Protection Agency (EPA) methodologies, MOtor Vehicle Emission Simulator (MOVES model). Accordingly, the Transportation Improvement Program (TIP) and Regional Transportation Plan (RTP) must demonstrate conformity to the SIP for attaining the ozone standard. Background on PM2.5 Fine particulate matter, noted as PM2.5 hereafter, is a mixture of microscopic solids and liquid droplets suspended in the air, where the size of the particles is less than 2.5 µm (or about one thirtieth the diameter of a human hair). Fine particles can be emitted directly (such as smoke from a fire, or as a component of automobile exhaust) or be formed indirectly in the air from power plant, industrial and mobile source emissions of gases such as sulfur dioxide and nitrogen oxides. The EPA reports that the health effects associated with exposure to fine particles are significant. Scientific studies have shown significant associations between elevated fine particle levels and premature death. Effects associated with fine particle exposure include aggravation of respiratory and cardiovascular disease (as indicated by increased hospital admissions, emergency room visits, absences from school or work, and restricted activity days), lung disease, decreased lung function, asthma attacks, and certain cardiovascular problems such as heart attacks and cardiac arrhythmia. While fine particles are unhealthy for anyone to breathe, people with heart or lung disease, asthmatics, older adults, and children are especially at risk. 4
6 In July 1997, the EPA issued NAAQS for PM2.5, designed to protect the public from exposure to PM2.5 at levels that may cause health problems. That standard included two elements: 1) An annual standard set at 15 µg/m 3, based on a three year average of the annual mean PM2.5 concentrations, and 2) A 24 hour standard of 65 µg/m 3, based on a three year average of the 98 th percentile of 24 hour concentrations. Areas need to meet both standards to be considered in attainment of PM2.5 NAAQS. Meeting the PM2.5 standards nationwide is estimated to prevent at least 15,000 premature deaths; 75,000 cases of chronic bronchitis; 10,000 hospital admissions for respiratory and cardiovascular disease; hundreds of thousands of occurrences of aggravated asthma; and 3.1 million days when people miss work because they are suffering from symptoms related to particle pollution exposure. On April 5, 2005, EPA designations under the PM2.5 NAAQS became effective, under which the region consisting of New Castle County in Delaware, Bucks, Chester, Delaware, Montgomery, and Philadelphia counties in Pennsylvania, and Burlington, Camden and Gloucester counties in New Jersey were collectively designated as a nonattainment area. This region is known as the Philadelphia Wilmington, PA NJ DE PM2.5 Nonattainment Area. In December 2006, the EPA revised the 24 hour standard from 65 µg/m 3 to 35 µg/m 3. Three years later, in December 2009, the EPA designated the Philadelphia Wilmington, PA NJ DE PM2.5 Nonattainment Area in nonattainment for the 24 hour standard. Currently, there are no EPA approved PM2.5 emission budgets. The PM2.5 SIP in the October 2011 PM2.5 and emission budget calculated using the MOVES model are pending EPA approval. However, on January 4, 2013, the US Court of Appeals decided the EPA will be required to consider other precursors of PM2.5. Precursors are pollutants that react in the atmosphere to form PM2.5 such as nitrogen oxides (NOx) or ammonia. The Delaware PM2.5 SIP considered regulating only NOx. Therefore, the PM2.5 SIP and the emissions budgets that were under EPA review and public comment cannot be approved. Further revisions in the SIP and emissions budget may have to be made. Nevertheless, the PM2.5 emission analysis is presented to inform the public that the RTP and TIP conform to the submitted 5
7 2008 PM2.5 SIP as amended with the revised on road mobile emissions budgets adopted in Future revisions may have to be made to the analysis pending guidance from EPA. 6
8 Status of the 2040 Regional Transportation Plan (RTP) and FY Transportation Improvement Program (TIP): As the Metropolitan Planning Organization (MPO) for Cecil County, Maryland and New Castle County, Delaware, WILMAPCO is charged with authoring a long range transportation plan with at least a 20 year planning horizon. The RTP presents recommendations for enhanced transportation efficiency and functionality, including the construction of new facilities, improved connectivity to multiple travel modes, and the enhancement of existing highway, transit, and bicycle/pedestrian facilities. Transportation projects that address challenges faced by the region are identified in this plan and placed on the fouryear TIP that corresponds to that project s development timetable. The FY TIP and the 2040 RTP were created by the WILMAPCO staff and member agencies. The amended FY TIP and 2040 RTP were adopted by the WILMAPCO Council on March 14, Interagency Consultation Process As required by the federal transportation conformity rule (40 CFR ) the conformity process includes a significant level of cooperative interaction among the federal state and local agencies. Interagency consultation requirements include coordination with the local county representatives, the MPO and representatives from both state and federal agencies including: WILMAPCO Delaware Transit Corporation Delaware Department of Transportation Delaware Department of Natural Resources and Environmental Control Maryland Department of the Environment Maryland Department of Transportation 7
9 Maryland SHA, MTA and MDTA Cecil County New Castle County Federal Highway Administration Environmental Protection Agency Federal Transit Administration As part of the interagency consultation, Delaware s Interagency Conformity Consultation Working Group, WILMAPCO s Air Quality Subcommittee and Technical Advisory Committee met in order to achieve the following goals related to the transportation conformity process: Determine planning assumptions Develop a definitive list of future year projects to be analyzed Develop a format for presenting determination Develop and standardize the public participation process Determine Planning Assumptions 8-Hour Ozone The emissions resulting from the implementation of regionally significant transportation projects (those which do not qualify as exempt under 40 CFR and 127) will be compared to the Delaware Department of Natural Resources and the Environment s (DNREC) Motor Vehicle Emissions Budget (MVEB). EPA regulations, as outlined in the Final Transportation Conformity Rule, Section , Criteria and procedures: MVEB, require that emissions analyses be conducted for specific analysis years as follows: Attainment year 8
10 A near term year, one to five years in the future The last year of the RTP s forecast period An intermediate year or years such that analyses years are no more than ten years apart. All analysis years were determined through the interagency consultation process has been selected as the near term year. The last year of the plan is and 2030 have been chosen as the intermediate years so that the analysis years are no more than ten years apart, making the analysis years 2015, 2020, 2030 and As discussed above, ozone formation is a direct result of VOC and NOx emissions reacting with each other in the presence of sunlight. The EPA has ruled that both precursor emissions, VOC and NOx, must be included in a regional analysis of 8 hour ozone for transportation conformity. PM2.5 Because the PA NJ DE PM2.5 nonattainment area does not meet the annual PM2.5 standard, the emissions analysis for PM2.5 must consider annual emissions. Guidance from EPA presents four possible options for developing an annual projection inventory: 1.) using a single MOBILE output to represent daily emissions for the entire year; 2.) running MOBILE to represent two seasons; 3.) running MOBILE to represent four seasons; or 4.) running MOBILE to represent twelve individual months. However, various sensitivity analyses show that there are not enough differences among the two season, four season and the twelve month approaches. The interagency consultation group decided to use the four season annual inventory method. Once SIP budgets have been approved for conformity purposes by EPA, each MPO will have a budget for PM2.5 emissions with which to compare projected future emissions resulting from implementation of TIPs and RTPs. However, until that time, EPA requires that one of two interim emission tests be used to demonstrate PM2.5 conformity: either the baseline year test, or the build/no build test. The baseline year test requires that emissions projected for each future analysis year is no greater than emissions in 2008 (the baseline year). The build/no build test requires that, for each future analysis year, emissions from the build scenario be no greater than emissions from the no build scenario. The selected interim emission test must be used for the entire nonattainment area. Within the Philadelphia Wilmington, PA NJ DE PM2.5 nonattainment area, the no 9
11 greater than baseline test has been selected as the interim emissions test. This was selected through the interagency consultation process. The following five analysis years were chosen for the PM2.5 analysis: 2015 (near term year and the attainment year) 2020 (interim year to keep analysis years less than ten years apart) 2030 (interim year to keep analysis years less than ten years apart) 2040 (WILMAPCO Plan horizon year) EPA regulations require that emissions analysis be conducted for specific analysis years. Section (g) of the Final Rule states that these analysis years must include a near term year (one to five years in the future), the last year of the long range plan, and an intermediate year or years such that analysis years are no more than 10 years apart. Additionally, the 2015 analysis year meets a conformity requirement to test conformity for the attainment year, even though a SIP budget is not yet in place. The following PM2.5 pollutants and precursors were tested: Direct PM2.5 source: tailpipe exhaust, brake and tire wear PM2.5 Precursor: NOx. PM2.5 can result from both direct and indirect sources. Gasoline and diesel on road vehicles emit both direct PM2.5 and other gases that react in the air to form PM2.5. Transportation related direct PM2.5 emissions can result from particles in exhaust fumes, from brake and tire wear, from road dust kicked up by vehicles, and from highway and transit construction. Transportation related indirect PM2.5 emissions can result from one or more of several exhaust components, including nitrogen oxides (NOx), volatile organic compounds (VOCs), sulfur oxides (SOx), and ammonia (NH 3 ). For the regional analysis of direct PM2.5 emissions, the EPA has ruled that both exhaust and brake/tire wear must be included. However, EPA has ruled that regional emissions analyses for direct PM2.5 should include road dust only if road dust is found to be a significant contributor to PM2.5 by either the EPA Regional Administrator or a state air agency. For this nonattainment area, neither of the EPA Regional Administrators nor any of the three state air agencies have found that road 10
12 dust is a significant PM2.5 contributor. EPA has also ruled that regional direct PM2.5 analyses only need to include fugitive dust from construction of transportation projects if the SIP identifies these emissions as significant contributors to the regional PM2.5 problem. The current submitted PM2.5 SIP has not deemed construction related dust a contributor to the regional PM2.5 problem. Thus, the only components of direct PM2.5 emissions to be considered in the nonattainment area are tailpipe exhaust and brake/tire wear. For the regional analysis of indirect PM2.5 emissions (also called PM2.5 precursors), the EPA has identified four potential transportation related PM2.5 precursors: NOx, VOCs, SOx, and NH 3. Because of the Court of Appeals January 4, 2013 rolling brother precursors will have to be considered pending EPA guidance. The current PM2.5 SIP does not identify any precursors identified other than NOx as a significant contributor of PM2.5 emissions in New Castle County. The PM2.5 emissions analysis presented here calculates NOx emissions. 11
13 Air Quality Modeling Methodology: The air quality analysis conducted for the FY TIP and 2040 RTP used a series of computer based modeling techniques. These techniques are consistent with methods WILMAPCO and DelDOT have used in conducting air quality analyses required by the CAA amendments, and are similar to those used by other state and regional transportation agencies in preparing air quality analyses. They are also consistent with the modeling procedures WILMAPCO and DelDOT have used assisting in the preparation of various SIP documents with the Delaware Department of Natural Resources and Environmental Control (DNREC). Travel Demand Modeling A travel demand model for Delaware, including New Castle County, is maintained by the DelDOT. The model applies a variety of data regarding roadway network conditions, vehicular travel patterns, automobile ownership, and the location of population and employment sites. The model follows the traditional four step process of trip generation, distribution, mode split, and assignment that is commonly used throughout the transportation planning industry. The model components were processed through the CUBE Voyager software package. The primary products of the model used in the air quality analysis were estimated volumes and average speeds for each segment or link of the roadway system. The modeling process developed for the FY TIP and the 2040 RTP used a 2010 base year network validated against DelDOT traffic counts for Model networks were developed for the years 2012, 2015, 2020, 2030, and 2040 for New Castle County. The networks include the major capacity improvement projects that are expected to be in place and open to service during these years. The types of projects that are tested include enhanced transit service, highway widening (one lane or more) and/or new construction. Demographic projections, including employment, households, and population, were developed for each of the analysis years through the WILMAPCO Data & Demographic Subcommittee. These forecasts were recommended by the Technical Advisory Committee (TAC) and were adopted by the WILMAPCO Council in May
14 Travel estimates were developed for this conformity analysis using a so called five step travel demand modeling process. The model follows the traditional four step modeling approach that includes trip generation, trip distribution, mode split, assignment, and feedback. This type of process is required by Federal air quality conformity regulations, and is a set of planning tools commonly used among MPOs and State DOTs. The travel demand modeling process uses two sets of primary input data. The first is socio economic data for traffic analysis zones (TAZ) for the New Castle County MPO region. Since the modeling process maintained for WILMAPCO by the Delaware DOT (Division of Planning) uses a single, integrated model of the Delaware/Maryland portion of the Delmarva Peninsula, WILMAPCO staff have developed a subcommittee process to estimate and manage demographic data for the TAZ in New Castle County. This demographic data generally consists of: 1) Population 2) Dwelling Units 3) Total Employment by Place of Work 4) Employment by Job Sector, by Place of Work 5) Total Employed Persons (Employment by Place of Residence) 6) Average Income 7) Income Quartiles 8) Average Vehicle Ownership 9) Vehicle Ownership Quartiles For each TAZ, data for each of these items is obtained from the most recent census, updated as needed to the base year of the long range plan. For this conformity analysis, that means data from the 2010 Census was used with other locally obtained information to develop a set of TAZ estimates for Employment by place of work is not a product of the US Census, but the MPO subcommittee used a series of local and state data sources to develop and achieve consensus on TAZ based employment locations. The MPO subcommittee also developed demographic forecasts for each TAZ, for the horizon years of 2020, 2030, and Other years needed for the plan were obtained through interpolation. The second primary travel model input is the so called travel network which is a map like representation of New Castle County roadways and streets. The network file stores the following data for each street segment: 13
15 1) Functional Class (or road type) 2) Number of Lanes 3) Lane Capacity 4) Posted Speed 5) Operating Speed 6) Average Peak Period Capacity (Lanes X Lane Capacity) The current set of DelDOT/MPO travel demand models is typical of advanced TAZ based travel models in use in the United States. DelDOT staff (with assistance from an engineering consulting firm) estimated these models using data from the Delaware Travel Monitoring Survey (DTMS). The current TAZ based models are referred to as aggregate demand models because they are applied at an aggregate, zonal level with extensive market segmentation. As part of this plan update a review and process update of the modeling programs was performed by DelDOT staff, which added the DTMS travel survey data to the modeling process. The trip generation models include a precursor step, which disaggregates TAZ based household data using workers per household, persons per household, and vehicles per household data from US Census PUMS, then applies cross classificationbased trip generation rates to estimate productions and attractions for each TAZ, for several trip purposes including: 1) Home Based Work (HBW) 2) Home Based Local Shopping (HBLS) 3) Home Based Regional Shopping (HBRS) 4) Home Based Other (HBO) 5) Non Home Based (NHB) 6) Journey to Work (JTW) 7) Journey at Work (JAW) 8) Trucks 14
16 The trip distribution models are standard gravity model formulations using trip length frequencies for each trip purpose, from the DTMS. The mode choice model used by DelDOT and the MPOs is a nested logic choice format. Non motorized trips (separate modes for bicycle and walk) are included as an option in certain sets of model runs that are based on tax parcel TAZ geography. Nonmotorized trips are not currently modeled in the TAZ based regional modeling process used for county based conformity analyses. The trip assignment procedures use network capacity constrained equilibrium methods, which emphasize average weekday peak period congestion levels to allocate roadway volumes and speeds by time period of day. Four peak period times are used: AM, Midday, PM, and Offpeak. The process uses customized speed flow delay curves representing freeway, arterial, collector, and local speeds separately. The model process methods, as required by conformity regulations, incorporate full feedback from trip assignment back through trip distribution. The travel model was run in the CUBE Voyager software package (Version 6.0.2) under license from the vendor, Citilabs. In summary, the modeling process developed used a 2012 base year network validated against DelDOT traffic counts for Model networks were developed for the base year of 2012, an interim year of 2015, and 10 year intervals of 2020, 2030, and 2040 for New Castle County and for the Delaware/Maryland peninsula counties. The types of projects tested were corridor improvements, highway widening, and new roadway construction. Each project was added to the network in the year when the improvement was completed. Socioeconomic projects such as population, employment, and household size were developed for the same planning horizon years. 15
17 Emission Factor Estimate EPA's Office of Transportation and Air Quality (OTAQ) developed the MOtor Vehicle Emission Simulator (MOVES). Initial draft versions of the software were released in This is the required modeling software used in regional or countywide air quality analyses including transportation conformity analyses. The software replaces the previous EPA tool which was called MOBILE6.2. The MOVES software is required for use in conformity analyses after March At the time this report was developed, MPOs and State DOTs had the option of using either the older MOBILE6.2 or the newer MOVES to prepare conformity analyses; it was decided to use MOVES for this plan s conformity analysis. MOVES software is a new, revised emission modeling system estimating emissions for mobile sources covering a broad range of mobile source pollutants and allows multiple scale analysis. The MOVES software produces estimates of emissions from cars, trucks and motorcycles. Figure 1 presents an overview of the process used to generate travel model and emissions model data for this conformity analysis. The travel model software, CUBE Voyager, was arranged by DelDOT staff with consultant assistance to include the DNREC spreadsheet MOVES inventory method process for estimating mobile source emissions in New Castle County. Essentially, DNREC staff developed an Excel based application of the MOVES inventory method for estimating mobile source emissions. That process was incorporated, step by step, into the CUBE Voyager software so that conformity analysis process is based directly on the DNREC application of the MOVES inventory method. A series of quality control checks was performed by DelDOT and the consulting firm staff ensuring the CUBE model generated emissions data accurately replicated the DNREC spreadsheet method. Travel model link volumes are summed to countywide totals. Adjustment factors are then used to account for seasonal traffic variations and alignment of Delaware based vehicle miles traveled (VMT) estimates with the federally required Highway Performance Management System (HPMS). HPMS data are used to standardize the Delaware specific VMT data as required by the USEPA so that direct comparisons can be made among different years and modeling scenarios. 16

18 Figure 1: Overview of Travel Model Emission Model Process for Conformity 17
19 Mobile Source Emissions Estimates The estimates of emissions for New Castle County are generated jointly by the DelDOT and DNREC. The model post processor takes data produced by CUBE Voyager model output for New Castle County and adjusts it for input into the MOVES mobile emissions process noted above. This process links the estimated roadway speeds and volumes generated by the travel demand model with emission trends derived from MOVES. The product of this process is countywide emission estimates presented in this document. The vehicle miles traveled (VMT) and emissions data for New Castle County were adjusted to be compatible with the data contained in the current SIPs. The adjustments represent factors to account for seasonal traffic variations and to align the travel demand estimates with DelDOT s and HPMS traffic level reporting system. These data were used to standardize the Delaware specific VMT data as required by the EPA so that direct comparisons can be made among different years and modeling scenarios. 18
20 Conformity Question Matrix: SECTION OF 40 CFR PART 93 CRITERIA YES / NO COMMENTS GENERAL CRITERIA APPLICABLE TO BOTH PLAN AND TIP Are the conformity determinations based upon the latest planning assumptions? Yes The conformity determination uses the most recent available information including recent demographics and vehicle registration. (a) Is the conformity determination, with respect to all other applicable criteria in , based upon the most recent planning assumptions in force at the time of the conformity determination? Yes Population, housing and land use data inputs for the Travel Demand Model were updated in May Vehicle fleet data for 2011 was utilized in the conformity determination. (b) Are the assumptions derived from the estimates of current and future population, employment, travel, and congestion most recently developed by the MPO or other designated agency? Is the conformity determination based upon the latest assumptions about current and future back ground concentrations? Yes Transportation demand end emissions modeling assumptions are developed by the DE Dept of Transportation in conjunction with WILMAPCO and other local, state and federal representatives as part of the consultation process. Standard procedures for projecting future demographics are outlined in the Plan. (c) Are any changes in the transit operating policies (including fares and service levels) and assumed transit ridership discussed in the determination? (d) The conformity determination must include reasonable assumptions about transit service and increases in transit fares and road and bridge tolls over time. Yes Reasonable assumptions have been made with regard to transit fares and operating policies (fare and service levels). No changes to transit fare policy are anticipated for the duration of the Plan. Changes to service levels for fixed route service in New Castle County are not anticipated for the duration of the plan. It is reasonable to assume they will remain constant. Road and bridge tolls are not expected to increase over the life of the Plan. 19
21 SECTION OF 40 CFR PART 93 CRITERIA YES / NO COMMENTS GENERAL CRITERIA APPLICABLE TO BOTH PLAN AND TIP Are the conformity determinations based upon the latest planning assumptions? Yes The conformity determination uses the most recent available information including recent demographics and vehicle registration. (a) Is the conformity determination, with respect to all other applicable criteria in , based upon the most recent planning assumptions in force at the time of the conformity determination? Yes Population, housing and land use data inputs for the Travel Demand Model were updated in May Vehicle fleet data for 2011 was utilized in the conformity determination. (b) Are the assumptions derived from the estimates of current and future population, employment, travel, and congestion most recently developed by the MPO or other designated agency? Is the conformity determination based upon the latest assumptions about current and future background concentrations? Yes Transportation demand end emissions modeling assumptions are developed by the DE Dept of Transportation in conjunction with WILMAPCO and other local, state and federal representatives as part of the consultation process. Standard procedures for projecting future demographics are outlined in the Plan. (c) Are any changes in the transit operating policies (including fares and service levels) and assumed transit ridership discussed in the determination? (d) The conformity determination must include reasonable assumptions about transit service and increases in transit fares and road and bridge tolls over time. Yes Reasonable assumptions have been made with regard to transit fares and operating policies (fare and service levels). No changes to transit fare policy are anticipated for the duration of the Plan. Changes to service levels for fixed route service in New Castle County are not anticipated for the duration of the plan. It is reasonable to assume they will remain constant. Road and bridge tolls are not expected to increase over the life of the Plan. 20
22 SECTION OF 40 CFR PART 93 CRITERIA YES / NO COMMENTS (a) (2)(ii) (b) Is the highway and transit system adequately described in terms of the regionally significant additions or modifications to the existing transportation network which the transportation plan envisions to be operational in the horizon years? Is the Transportation Plan Fiscally Constrained? Are TCMs being implemented in a timely manner? For Areas with SIP Budgets:Is the Transportation Plan, TIP or Project consistent with the motor vehicle emissions budget(s) in the applicable SIP? Yes Yes N/A Yes The regional modifications to the highway and transit systems are documented within the conformity determination report and included in the emissions analysis. The transportation plan is in complete agreement with the State s FY 2013 to 2018 Capital Improvement Plan. There are no TCMs included in the Plan. Emission totals calculated for each analysis years were tested against the 2009 SIP budgets for ozone and the 2002/8 baseline tests for PM2.5, and the pending PM2.5 budget. 21
23 FY TIP and 2040 RTP Conformity Analysis: Summary Ozone emissions were tested in New Castle County for 2015, 2020, 2030 and 2040 against DNREC s approved and pending MVEBs. For all years tested, NOx and VOC emissions met the applicable budget. In the absence of an approved budget, PM2.5 emissions were tested against annual 2002 baseline figure and the daily 2008 baseline figure developed through interagency coordination. The years tested included: 2015, 2020, 2030, and Figures 1 and 2 summarize New Castle County s ozone conformity status by illustrating NOx and VOC emissions: Figure 1: New Castle County Daily NOx (Tons/Day) Figure 2: New Castle County Daily VOC (Tons/Day) Other budget tests for Daily PM2.5, Annual PM2.5 and Annual NOx are presented in Figures 3, 4, and 5: Figure 3: New Castle County Daily PM2.5 (Tons/Day) Figure 4: New Castle County Annual NOx (Tons/Year) Figure 5: New Castle County Annual PM2.5 (Tons/Year) Conformity Analysis Determination: The figures below illustrate emissions for the base year and all horizon years such: 1) Ozone: The 2009 Mobile6 generated budgets (approved by EPA) for New Castle County VOC and NOx; 2) Annual PM2.5: Both the 2002 MOBILE6.2 and 2008 MOBILE6.2 generated baselines for New Castle County; 3) Daily PM2.5 and NOx: The 2008 MOVES generated baselines for New Castle County; 4) Annual NOx: The 2009 MOVES generated budgets (pending EPA approval) for New Castle County. Each test passes required emission budgets, therefore, conformity with applicable SIPs is determined. 22


24 Figure 1 New Castle County Daily NOx (Tons/Day) 23


25 Figure 2 New Castle County Daily VOC (Tons/Day) 24


26 Figure 3 New Castle County Daily PM2.5 (Tons/Day) 25


27 Figure 4 New Castle County Annual NOx (Tons/Year) 26

")
28 Figure 5 New Castle County Annual PM2.5 (Tons/Year) 27


29 FY TIP and 2040 RTP Conformity Determination: Supporting Materials 28

30 29


31 30

32 31


33 32
34 APPENDICES 33
35 NCC-A: Public Comments This conformity document has met its public participation requirements. The draft document was made available for public review and comment beginning on January 14, 2013, and ending March 7, The public review and comment period was announced using the following outlets: Notices in the Delaware News Journal and Cecil Whig WILMAPCO website ( WILMAPCO E NEWS (monthly electronic newsletter) WILMAPCO Transporter (quarterly newsletter) TIP Public Workshop on February 25, 2013 from 4 PM to 7 PM at WILMAPCO The documentation of the observed 30 day public comment period, can be found here: and All public comments we received can be found in Appendix G of the TIP, available at: 34
36 NCC-B: Summary of Travel Demand Modeling Activities: Recent Modeling Updates The Delaware DOT Division of Planning maintains the Peninsula Travel Demand Model used to support WILMAPCO s air quality conformity analyses. Several projects and analysis efforts were undertaken during calendar year 2012 to update various components and key datasets used by the Peninsula wide travel modeling process. A brief summary of those activities includes the following items: Demographic Data: During January through May 2012 WILMAPCO staff and the Demographics and Data Subcommittee provided updated population, housing, and employment estimates for all modeling horizon years at the traffic analysis zone (TAZ) level. The update provided data for all TAZ in the 13 county area included in the Peninsula model (this includes the 3 counties of Delaware and the 9 counties of Maryland s Eastern Shore). The TAZ data updates were based on latest available control totals from the Delaware Population Consortium (DPC) and the Maryland Department of State Planning (DSP). Project List: During June 2012 the WILMAPCO staff and the Air Quality Subcommittee reviewed and completed an update of in service years for transportation system projects identified as regionally significant. The project list included a review of major highway and transit improvements planned for New Castle and Cecil Counties. Trip Generation Rates: During May through September 2012 DelDOT planning staff (with assistance from WRA) updated trip generation rates used in the Peninsula model. The previous travel demand model (called Clean Model 15B) was based on a continuous travel survey for the period 1997 to 2005; this update (called Clean Model 17B) 35
37 included analysis of 2009 to 2011 data. Trip production rates were updated for all trip purposes (such as work, shopping, etc.) included in the modeling process. Trip Length Frequencies: Trip length frequencies are used to distribute trip ends generated for each TAZ among potential destinations. They are essentially graphical representations of how far (distance in minutes or miles) the population of each TAZ travels within the modeled area in making trips for various trip purposes. As with the trip generation update noted above, this update effort examined data for the 2009 to 2011 period and resulted in a final dataset covering the years 1997 to Software: In March, 2012 Delaware DOT upgraded the travel demand modeling process to use the latest version of Citilabs CUBE Voyager software, called version This update effort involved changing or modifying several model input or so called script files (for trip table matrix processing and for trip assignment processes) to be consistent with requirements of the software update. It is anticipated that work on the update of the travel demand modeling process will continue during the spring of Some of the items on the update agenda include: Mode Choice (Transit Shares): The modeling process currently uses information of transit usage for the period 1997 to 2011; for 2013 and beyond the Delaware Travel Monitoring System (DTMS) will focus with emphasis placed on identifying bike and pedestrian travel; the bike/ped survey is a major priority. Travel Assignment (Vehicle Routing): Additional data for the years 2009 to 2011 relating to travel times and average vehicle speeds is available and will be used to update vehicle routing patterns within the modeling process. GIS Integration: The CUBE Voyager 6 software is able to directly integrate with GIS shape files and with ArcGIS 10. Through this model update step all of the TAZ based data files will be joined with TAZ boundary shape files. All roadway and transit system network files will be converted to GIS shape files as well. This step will provide better 36
38 overlays between travel model input and output data as well as external data such as other GIS files and/or Google Earth type data. 37