Outline. Background Key results Failure model Success criteria
|
|
|
- Polly Evans
- 5 years ago
- Views:
Transcription
1


2 Outline Background Key results Failure model Success criteria


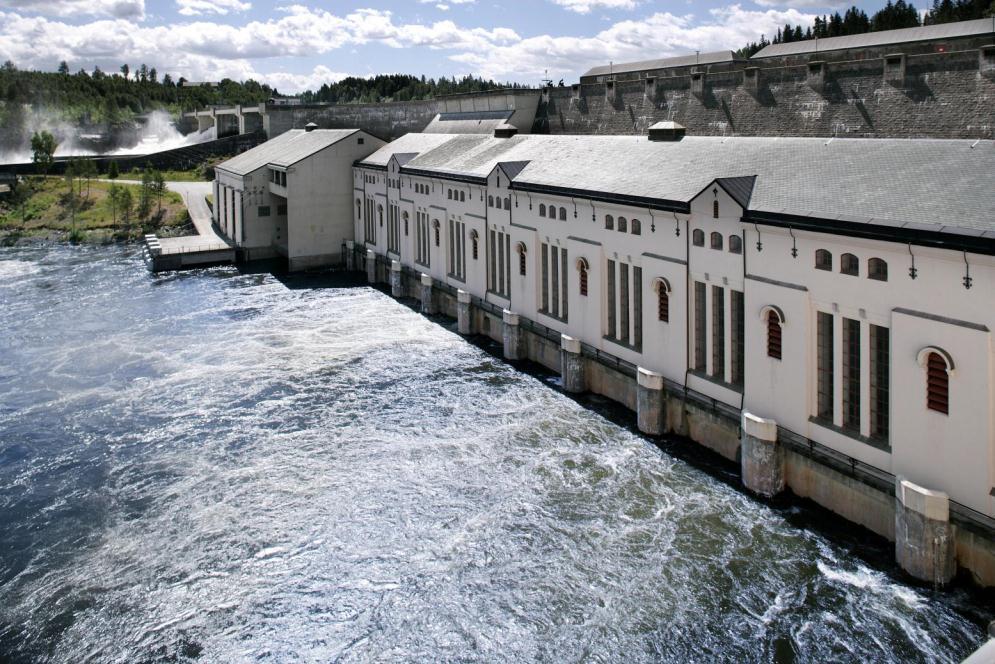
3 Hammern hydropower plant Operational since 1900 Upprating 1927

4 Hydropower in Norway Around 1400 power plants, around 2000 units Installed capacity MW Annual production TWh

5 Average age ~ 43 years
6 20 years of collaborative R&D in hydro O&M Maintenance systems ( ) Technical operation and maintenance ( ) Decision tools for maintenance planning ( ) Value added mainenance in power production ( )


7 Timeline
8 Hydropower maintenance towards To develop scenarios for hydropower in Scandinavia in general, and maintenance and rehabilitation in particular. To identify new technical, organizational, commercial and regulatory solutions and products. To identify need for new knowledge to meet future challenges. 8

9 Common features Some of the scenarios have common features Inflection point (negative positive) Climate changes Green energy Peak power has high value Recruitment problems Competence building Large energy companies Maintenance Continuous monitoring Pit stop maintenance Hydropower will still play an important role in the energy system in 2030
10 Conclusions Scenario process resulted in 93 mini scenarios, 5 main scenarios List of challenges and recommendations for the hydropower industry in Norway and Sweden Scenarios can be used to create a basis for identification of challenges, possibilities and restrictions robust decision under uncertainty Easy to involve different persons / groups Challenge to distance oneself from daily routine to become creative Process requires good management and guiding


11 Key results Maintenance philosophy Decision tools Technical-economic model Multi-criteria decision aid Optimal Maintenance Toolbox v 3.0 Testing of maintenance paradigm RCM Online monitoring 5s Pit stop WCM Maintenance Operation Total

12 World class maintenance Maintenance management processes according to a draft European standard prepared by CEN / TC 319 / WG 8

13 Failure model
14 Technical condition states The condition development is often observable Condition monitoring handbooks by Energy Norway used to classify the condition State Description 1 No indication of degradation ( as good as new ) 2 3 Some indication of degradation. The condition is noticeably worse than as good as new. Serious degradation. The condition is considerably worse than as good as new 4 The condition is critical. 5 Fault state. 14
15 f(t) f(t) f(t) f(t) Technical condition / deterioration Lifetime model Linking the 5 states with the life curve: State T 1 T 2 T 3 T 4 5 Time [years] f(t) f(t) f(t) f(t) tid tid tid tid 15

16 Sviktsannsynlighet, f(t) Kumulativ sannsynlighet, F(t) Expert judgement tool 0,0 7 1,2 0 0,0 6 1,0 0 0,0 5 0,8 0 0,0 4 0,0 3 0,0 2 0,6 0 0,4 0 0,0 1 0,2 0 0, år 0,0 0

17 condition P_svikt Results from the model Calculation of failure probability 0.18 Sviktsannsynlighet år Calculation of expected remaining life Simulation of condition development Simulation with Markov process Condition time t [years] Time 17


18 Case - Eidsiva: Planning of maintenance work at Osa power plants using elements of pit stop methodology Maren Istad, SINTEF Energiforskning Knut Ringsrud, Eidsiva Vannkraft
19 Case SN Power Global maintenance strategy RCM analysis Systematic use of indicators Contious improvement Methods and tools from the maintenance projects Norwegian origin, global application

20 System collecting and sharing life time data (SysLife) 20

21 Framework for risk and profitability analysis based on tehcnical condition (FRAM) 21
22 Success criteria 1. Collaborative research project 2. Active involvement from the power companies 3. Support from the national research council 4. Training courses, seminars and workshops
23 The bottom line Cost (2012 US$): Power companies: National research council: SUM: 8.0 mil. US$ 4.8 mil US$ 12.8 mil US$ "Correct implementation in our own organization will over time give an 20% added value to our maintenance." Statement from user group Potential added annual value of maintenance: 128 mil US$