Ship transport of CO 2 An Overview
|
|
|
- Jean Shaw
- 5 years ago
- Views:
Transcription

1 Ship transport of CO 2 An Overview Pete Brownsort UKCCSRC Biannual Meeting, Cranfield University, 22nd April 2015 Scottish Carbon Capture & Storage
2 Talk outline Introduction literature survey Existing CO 2 shipping experience Process technology Regulation and HSE aspects Financial factors, cost comparisons 2


3 CO 2 shipping literature survey SCCS Joint Industry Project on CO 2 -EOR commissioned literature survey, 2014 Extent and scope of literature on transport of CO 2 by ship Key findings for EOR expertise/reports/co2-eor-jip/sccs- CO2-EOR-JIP-WP15-Shipping.pdf 3


4 Introduction literature survey Around 60 references found (more since) Europe > Asia Conference > Journal > Report 4
5 Literature survey some key references MITSUBISHI HEAVY INDUSTRIES LTD. (2004). Ship Transport of CO 2. Cheltenham, IEA-GHG. Report number: PH4/30. ASPELUND, A., MØLNVIK, M. J. & DE KOEIJER G. (2006). Ship Transport of CO 2. Chemical Engineering Research and Design. 84(9): ASPELUND, A. (2010). Gas purification, compression and liquefaction processes and technology for carbon dioxide (CO 2 ) transport. In: Maroto-Valer, M. M. (Ed) Developments and innovation in CCS technology, Cambridge, Woodhead Publishing Ltd. pp VERMEULEN, T. N. (2011). Overall Supply Chain Optimization. CO 2 Liquid Logistics Shipping Concept. Tebodin Netherlands BV, Vopak, Anthony Veder and GCCSI. Report number: ZEP (2011). The Costs of CO 2 Transport. Brussels, European Technology Platform for Zero Emission Fossil Fuel Power Plants. 5
6 Literature survey key findings Ship transport of CO 2 feasible using known technologies, related to LPG Established on small scale Can be cost competitive Some advantages over pipeline transport Focus of studies for CCS, not EOR Some knowledge gaps 6


7 Existing experience of CO 2 shipping EU market for bulk CO 2 c.3 Mt/yr, transported by truck, train, ship. Yara International trades CO 2 from Nor and NL through 7 import and distribution terminals around western European coasts Larvik shipping Yara I, II, III t Yara Embla, Yara Froya 1800 t Anthony Vader 1250 m 3 dual purpose LPG/CO 2 IM Skaugen six 10,000 m 3 dual purpose LPG/CO 2 Images: Larvik; Yara; Anthony Vader; IM Skaugen 7
8 Experience of CO 2 shipping vs. LPG, LNG CO 2 LPG LNG Number of ships (?) 350 Capacity Most 1800t, up to 10,000 m 3 Type Typical conditions Semi-pressurised/ refrigerated -30 C, 20 bara (existing fleet) Up to 80,000 m 3 Up to 266,000 m 3 Pressurised, Semi-pressurised/ refrigerated, or Refrigerated Varied: to -55 C, 20 bara Refrigerated, atmospheric pressure -161 C, 1 bara Loading/unloading In port In port, offshore In port, offshore 8

9 Process technology Shipping of CO 2 as liquid near triple point generally proposed 6.5 bara, -52 C Other liquid conditions sometimes proposed Transport as compressed gas also considered Technology can be adapted from LPG Process blocks: 9
10 Liquefaction Compression, cooling, dehydration and distillation Most energy intensive and costly step Several process options depending on cooling available Cooling water or seawater at <15 C External refrigeration Over-compression and expansion Combination 10


11 Liquefaction T P Compression, inter-stage cooling and condensation Volatile Distillation Dehydration Seawater cooling Option using seawater cooling favored in NW Europe Source: Aspelund, 2010 Expansion for final conditioning 11


12 Shore storage Liquefaction is continuous, shipping is batch! buffer storage needed before loading Cylinders or spheres Onshore or on barge in port Shore storage volume, 1.0 to 1.5 x ship volume Images: Yara; Liaoning Refine Technology Group 12


13 Ship loading Quayside loading Flexible cryogenic hoses Cryogenic marine loading arms 13 Images: mann-tek; KLAW, Center for LNG
14 Ship designs Covered by International Code for the Construction and Equipment of Ships Carrying Liquefied Gases in Bulk ( IGC Code ) Proposed designs based on LPG carrier experience Typically several horizontal cylindrical cargo tanks giving 20,000 40,000 m3 Alternatives bi-lobe tanks, spherical tanks, vertical cylindrical tanks 14


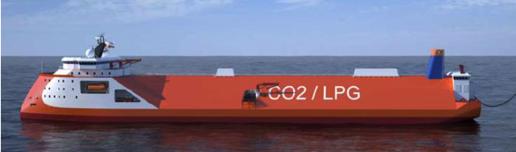
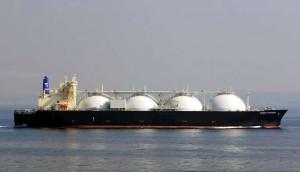
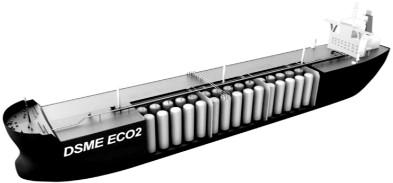
15 Ship designs Images: Vermeulen (2010), Yoo et al (2013), allaboutshipping.co.uk 15
16 Ship equipment Dynamic positioning system (DPS) To maintain position during offshore offloading Process equipment To recondition CO 2 to T and P required for offloading, and/or for well injection Pumping to 50 to 400 bar Warming to -15 to +20 ; seawater, waste heat or fuelled system Conditions needed specific to each case and depend on several factors Offloading system design Platform capabilities and well design Reservoir conditions 16
17 Ship-board process equipment Example (Vermuelen, 2011) Cargo lift pumps LP pumps (45 barg) avoids vaporisation on warming Seawater-warmed shell and tube heat exchanger HP pumps to injection pressure ( barg) Alternatives and additional equipment Mid-pressure pump to make transfer to platform, HP pump on platform Waste heat or fuelled ancillary heater CO 2 vaporiser for tank pressure equalisation Dry air plant 17
18 Offshore offloading Perhaps least well defined aspect Lots of options based on hydrocarbon transfers but will need adapting for CO 2 Choice of single point offloading system depends on CO 2 conditions liquid or SC fluid, T and P Flexible hose suitability for environment and CO 2 conditions/properties Location sea conditions, water depth Ship design processing equipment, DPS 18


19 Offshore offloading Examples of general arrangements Submerged offloading system (Omata, 2011) Single point mooring and platform (Vermeulen, 2011) Many alternative options for single point moorings 19
20 Injection Beyond scope a few comments only Injection conditions and constraints will have impacts on upstream process design, should optimise over whole system Literature on CO 2 shipping has little coverage of injection constraints, and very little specific to EOR Aim to avoid low temperature at reservoir entry to avoid hydrate formation and freezing, hence need to warm CO 2 before injection Likely to have two-phase flow in well at times, design for it PCV at well head to avoid two-phases upstream Likely to have very low temperatures in well/wellhead at times and on emergency shutdown, design process and equipment to avoid/cope 20
21 Regulation and HSE No specific regulations for CO 2 shipping Covered by UNCLOS and London Protocol Transport of Dangerous Goods CO 2 non-toxic, non-flammable Ship design under IGC Codes Carbon Footprint Estimates vary widely with system boundaries and assumptions Range 1.4% to 18% relative to CO 2 transported 21
22 Regulation and HSE Health CO 2 asphixiant and toxic, UK- WEL 5,000 ppm (8h); 15,000 ppm (15min) Risk assessment DNV report for Vopak/ Veder study concluded risk levels below national (NL) risk criteria (Koers and de Looji, 2011) Operational issues several potential hazard areas, all within existing scope of engineering knowledge 22
23 Costs of CO 2 transport by ship Lifetime total cost estimates for North Sea distances range /t-co 2, including compression and liquefaction Estimates vary quite widely depending on assumptions and boundaries Intuitive sensitivities to scale, distance, ship capacity, utility costs But relatively insensitive to distance Also sensitive to cooling water temperature, CO 2 supply pressure, CO 2 purity 23

24 Cost breakdown In all estimates costs for liquefaction are highest portion From both high capital costs and high operational costs due to energy consumption Data from Aspelund, Mølnvik, de Koeijer (2006) 24


25 Costs of Shipping vs. Pipeline Pipeline costs more dependent on CAPEX Shipping costs dominated by OPEX Shipping less sensitive to distance Specific costs of shipping CO 2 higher than pipelines over short distances, lower for long distances OPEX CAPEX 25 Chart sources: Rousanaly, Bureau-Cauchois, Husebye (2013); Doctor et al (2005)
26 Costs of Shipping vs. Pipeline Breakeven distance beyond which shipping more costeffective Breakeven distance varies with scale, and other assumptions Smaller volumes and longer distances favour shipping Shipping more cost-effective Pipeline more cost-effective Chart sources: Doctor et al (2005), author (2015) 26
27 Asset flexibility, financial risk Shipping allows flexibility In collection points, from scattered emitters In delivery points, serving different EOR fields In time, EOR injection profiles and project phasing, changes to industry sources In capacity, sequential addition of ship capacity In asset use, dual purpose, reuse for LPG Low entry CAPEX for shipping and flexibility combine to give lower financial risk than pipelines More attractive to investors 27
28 Ship transport of CO 2 - Conclusions Ship transport of CO 2 feasible using known technologies Existing experience at small scale, but understanding of scale-up requirements generally good Published knowledge sparse for offshore offloading, EOR injection profiles and consequences, whole-chain optimisation No unusual regulatory or HSE issues Shipping cost-competitive for lower scales and greater distances Flexibility and low entry capital reduce financial risks 28


29 Thank you! Contact details: 29