Ecosystem Health Report Card a tool for monitoring nutrient and health of coastal ecosystem ; Chilika lake - a case study.
|
|
|
- Egbert Derrick Blake
- 5 years ago
- Views:
Transcription


1 Ecosystem Health Report Card a tool for monitoring nutrient and health of coastal ecosystem ; Chilika lake - a case study. A.K.PATTNAIK, Ph.D. Chief Executive, CDA Project Director ICZM Odisha Project


2 Chilika A Ramsar site Coastal wetland system Average waterspread: 1065 sq km Direct basin: 4406 sq kms Highly productive ecosystem Average depth- 1 mts I N D I A Chilika B a y o f B e n g a l Wetland of Internati onal Im


3 Chilika Hotspot of biodiversity 211 bird species; largest Irrawady Dolphin population; 217 fish species Exceeds 1% biogeographical population in case of 30 migratory species.


4 Chilika Livelihood base of 0.2 million fishers

 Chilika Lagoon 2001 (790 sq km) 7000 3000 FISH LANDING (MT) Decrease in fish landing 1 8 9 00 8 0 5 0 1999 1986-87 1987-88 6000 1988-89 1989-90 5000 1990-91 2000 1991-92 4000")
5 Cause & effect of degradation Shrinkage in Lagoon Area ( ) of lake ecosystem Complex ecosystem, multitude stake holders Open use of the common property resources Alteration of flow upstream. loss of biodiversity & productivity & decrease in the fish yield/ diversity adversely affecting the ecosystem services &livelihood of local communities. Included in Montreux Record in 1993 due to change in the ecological characters by Ramsar convention. Chilika Lagoon (824 sq.km) Chilika Lagoon 2001 (790 sq km) FISH LANDING (MT) Decrease in fish landing

6 Restoration of Chilika Lake A journey from Montreux Record to Ramsar Wetland Conservation Award


7 G O V E R N I N G B O D Y Enabling Institution Chairman Chief Minister Odisha Chief Secretary, Govt. of Orissa Agriculture Production Commissioner, Orissa Principal Secretary, Fisheries & Animal Resources Department, Govt. of Orissa Principal Secretary Finance, Govt. of Orissa Principal Secretary Forest and Environment, Govt. of Orissa Principal Secretary, Home Department Government of Orissa Secretary, Revenue Department, Govt. of Orissa Secretary,Water Resource Department, Govt. of Orissa Secretary Housing and Urban Development Department Government of Orissa Chairman, Orissa State Pollution Control Board Secretary, Tourism Department, Govt. of Orissa Chief Wildlife Warden, Wildlife Department, Govt. of Orissa Experts, peoples representatives, representatives of fishermen co-operatives Representative from MoEF Chief Executive, Chilika Development Authority (member secretary)
8 Institutional Linkages (Strategic Partnership) COMMUNITY LEVEL INSTITUTIONS Fishermen Cooperative Societies Central Fishermen co-op Society Watershed Associations Self Help Groups Community based organization INTERNATIONAL ORGANISATIONS Ramsar Secretariat Wetlands international World bank JICA ILEC Danish Embassy Swiss Embassy DHI Ramsar Center Japan Tokyo University Kiel University Maryland University UNEP UNDP NATIONAL ORGANISATIONS Ministry of Environment,Agriculture, Science and technology, Water Resources National Bank for Agriculture Devt. region Central Water Technology Inland Fishery Development development for Center Eastern IITTM NCSCM RESEARCH INSTITUTIONS Central Water & Power Research Station National Institute of Oceanography IIT Chennai Zoological Survey of india Botanical survey of India Wildlife Institute of India Space Applications Center National Remote Sensing Agency Bombay natural history Society Central Inland Fishery Research Institute Central Institute for Brackish Water Fishery KIIT School of Biotechnology Anamalai University CIFA IISER Kolkatta NISER RPRC CHILIKA DEVELOPME NT AUTHORITY NONGOVERNMENTAL ORGANISATIONS Campaign for Conservation of Chilika Lagoon (CCCL) 20 local NGOs and CBOs Barefoot Ramsar Center Japan LOCAL ORGANISATIONS Fishery and ARD Department Water Resources Department Forest & Env. Department Revenue Department Science and Technology Department Agriculture Department Remote Sensing Application Center Watershed Mission Tourism Department Revenue & Disaster Management Dept. Renewable Energy Development Center

9 Restoration strategy (Ecosystem approach) Key targeted studies to understand the complex ecosystem and to trace the root cause of degradation Adaptive restoration planning through wide consultative process. Integration of the lagoon basin in the management of the wetland with micro watershed as a functional ecological unit. Empowerment of local communities through capacity building. Priority on CEPA activities. Strategic partnership with a wide array of organization. A robust monitoring protocol.

10 Hydrological set-up of Chilika Lake Mahanadi River Nara j We ir Mundali Barrage Alteration of Flow Western Catchment Mahanadi Barrage Birupa Barrage CHILIKA LAGOON Mahanadi D elta B A Y O F B E N G A L
11 IRS 1D LISS III IMAGE OF CHILIKA LAGOON DATE : 23 rd OCTOBER 2000 Old Mouth New Mouth BAY OF BENGAL Technical intervention can have dramatic positive impact on lagoon


12 Improvement after hydrological intervention ( 2000) Eight fold increase in annual fish and prawn landing Avg. increase in monthly family income of fishermen by 1000 US$ per annum after opening of the new mouth Chilika Lagoon Old Mouth Increase in salinity flux by 40% & tidal flux by 45%( very high simulation accuracy) Improvement of sediment flushing Quick discharge of flood water (reducing waterlogging in paddy field) Decrease of invasive species by 162 sq Km Site was removed from Montreux Record and conferred with Ramsar Wetland Conservation Award New Mouth BAY OF BENGAL Opening of the New Mouth
13 Fish landing ( to ) Fish Landing Fish Landing

14


15 Expansion of sea grass meadows April May June Jan
.")
16 Biodiversity conservation and sustainable livelihood With the amelioration of biodiversity new vistas opened for the community based ecotourism. As an alternative source of livelihood more than 850 boats are being used for on fishery). dolphin watching and 500 boats to To facilitate conduct this the orientation tourists for training bird and infrastructure watching by development is done by CDA the local fishermen. (reducing The pressure dolphin population in the lake is steadily increasing and the migratory birds are protected by local communities.


17 Positive impact on the coastal zone Chilika lake with estuarine character serves as an important spawning and nursery area and contribute for the marine stock. Restoration of the wetland and its drainage basin is playing a significant role in the protection of the marine environment from land-based activities. This is evident from the increase in the fish production from the adjoining coastal areas and increase in the number nesting of highly endangered Olive Reedley (turtle) on the sand bar located along the estuarine zone. Ridge to Coast
18 Nalabana Sanctuary

19 Conservation and Livelihood Fish trap zone Nalabana Sanctuary
.")

20 Resource users to resource mangers empowerment of the local fishers towards responsible fishery. Building capacity of 104 Fisher Cooperatives. Investment through microfinance (liberating from money landers). Incentives > better cold chain,post harvest care, hygienic processing, marketing network. Conservation strategies, participatory research, mapping of fish migratory routes. Institutional strengthening for responsible fisheries Certification process.
21 Ramsar Advisory Mission s observations It is an exemplary good-practice local action of the application of the various Ramsar guidelines, and the use of the Convention's tools and approaches, to address complex issues with an ecosystem approach for successful restoration of the wetland. The ecosystem based management demonstrates how restoration of Chilika with active community participation not only can have positive impact on the biodiversity but can significantly improve the livelihood of the local communities. The major management steps had been widely debated, researched and implemented, and that this extensive consultative approach has contributed significantly to the success of the management actions undertaken.
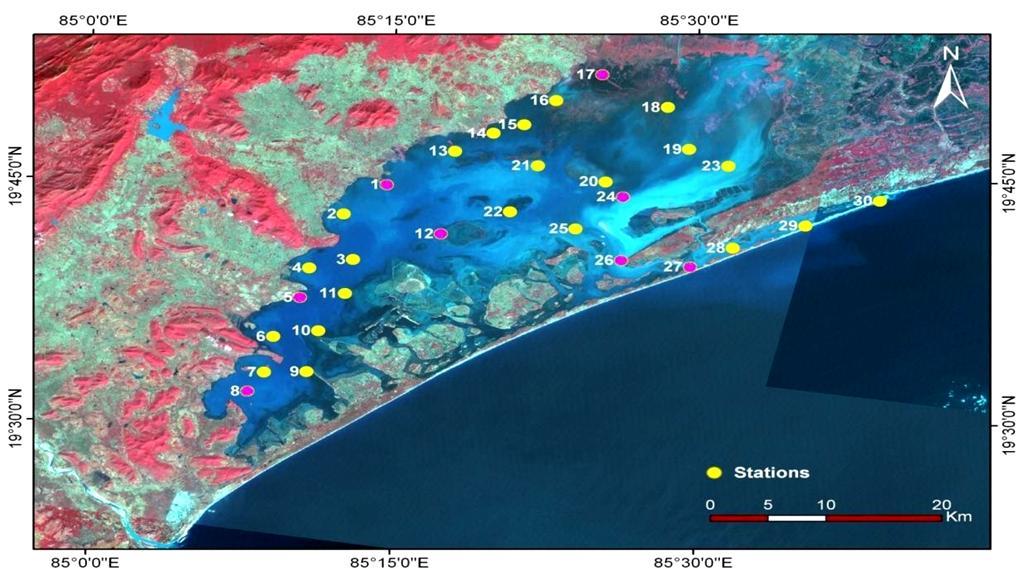
22 Monitoring Stations

23 Deployment of buoy mounted Sensors

24 Wetland Research & Training Center
25 Objectives The report card is developed in order to enhance understanding and management of Chilika lake ecosystem through a collaborative, UNEP/GEF project on global foundations for reducing nutrient enrichment and oxygen depletion from land based pollution,in support of Global Nutrient Cycle addressing nutrient overenrichment effectively through the development of nutrient health reporting card approach to the lake to demonstrate the effects of nutrient overenrichment due to land based activities in the lake basin on water quality and the livelihoods of local population.
26 Ecosystem Health Report Card Environmental report cards are transformative assessment and communications products that compare environmental data to scientific or management thresholds and are delivered to a wide audience on a regular basis. Ecosystem health report card is effective means of tracking and reporting the health of a wetland ecosystem at both local and regional scales. Often, health of rivers, estuaries and the bays can be affected by elevated nutrient and sediment loads; resulting in the overall degradation of water quality and biotic (biological) resources. Chesapeake Bay Maryland Coastal Bays Kura River basin Gulf of Mexico Deep Creek Lake Baltimore harbour Samoa Mississippi River
27 Core Objectives Define the basic indicators and their values to ascertain the health of the lake, and the bay for the report card. Understand the role of lake basin and freshwater nutrient input and associated nutrient fluxes to Chilika Lake Determine the transport of nutrient from the major/ minor rivers into the lake Assess the biogeochemical coupling of nutrient inputs with other physical components of the Chilika Lake system Analyse and carry out modelling of existing data in support of bridging data gaps in the report card.
28 Easy accessibility, wider audience The report card would provide a transparent, timely, and geographically detailed annual assessment of the health of the ecosystem using important indicators that are combined into a single overarching index of health. It could stimulate the local community to protect their River, Lake and inspire policy makers to provide policy support and fund for restoration activities. Civic leaders and community members can compare their grades with their neighbours, and these comparisons lead to a desire for better environmental outcomes in their own neighbourhood.
; and represent the threats (e.g., overfishing and illegal aquaculture, pollution, and sedimentation) to these values.")
29 Measures of Ecosystem Health Measuring the ecosystem health of Chilika Lake is conducted using 10 indicators organized into three main indices: Water Quality, Fisheries, and Biodiversity. Together, these indicators represent the ecosystem features of Chilika Lake that are valued (e.g., fishing, tourism, biodiversity); and represent the threats (e.g., overfishing and illegal aquaculture, pollution, and sedimentation) to these values.
30 WATER CLARITY Water clarity a measure of how much light penetrates though the water column which plays an important role in determining Lake grasses and phytoplankton distribution and abundance. Dissolved oxygen critical to the survival of Chilika Lake s aquatic life. The amount of dissolved oxygen needed before aquatic organisms are stressed, or even die, varies from species to species. Total chlorophyll a measure of phytoplankton (microalgae) biomass. Elevated phytoplankton levels can reduce water clarity and decomposing phytoplankton can reduce dissolved oxygen levels.
31 FISHERIES Total catch total catch of fish, prawns, and crabs recorded monthly at 27 landing stations around the Lake. Allows Lake managers to monitor annual yield in comparison to a calculated maximum sustainable yield(msy). Commercial species diversity number of species landed each year that are commercially important for the livelihood of fishermen. Size body length of landed tiger prawns (Penaeus monodon), mullet (Mugil cephalus), and Chilika crabs (Scylla serrate) should be above (or between) a prescribed length to ensure sustainability of the species.
32 BIODIVERSITY Bird count and richness count of the number of birds and bird species utilizing the Lake. Chilika Lake is the largest wintering ground for migratory waterfowl found anywhere on the Indian sub-continent. Dolphin abundance count of the endangered Irrawaddy dolphins surveyed annually in the Lake. Benthic fauna diversity Simpson s Index of Diversity (D) is used to assess the condition of this community. Benthic infauna are organisms living in or on the soft bottom areas of the Lake (e.g., clams and worms) and are a key food source for many species. Phytoplankton diversity (microalgae) Simpson s Index of Diversity (D) is also used to assess the condition of this microscopic algal community through analysis of the number of species present, and the abundance of each species. Phytoplankton are an important component of the Lake s food web.
33 GRADES %. All water quality and biological health indicators meet desired levels. Quality of water in these locations tends to be very good, most often leading to very good habitat conditions for fish and shellfish %. Most water quality and biological health Indicators meet desired levels. Quality of water in these locations tends to be good, often leading to good habitat conditions for fish and shellfish %. There is a mix of good and poor levels of water quality and biological health indicators. Quality of water in these locations tends to be fair, leading to fair habitat conditions for fish and shellfish %. Some or few water quality and biological health indicators meet desired levels. Quality of water in these locations tends to be poor, often leading to poor habitat conditions for fish and shellfish. 0 20%. Very few or no water quality and biological health indicators meet desired levels. Quality of water in these locations tends to be very poor, most often leading to very poor habitat conditions for fish and shellfish. Grades denoted with a + or - indicate a score that is within 2% of a score s high or low boundary. For example, a B+ is indicative of 78-80%.


34 Northern Zone Central Zone Southern Zone Outer Channel
35 Activities Hold an expert group meeting to figure out the modalities. Analyse existing data and carry out modelling of existing data in support of filling data gaps in the report card. Hold a multi-stakeholders workshop in Lake Chilika to develop a plan to implement the report card approach for sustainable nutrient management in the command area of the Chilika Lake and monitor nutrient loading in to the Lake Supporting and/or establishing relevant institutional arrangement for the implementation of the management plan Document all activities and results achieved for sharing with other partners of the GEF project with a view to applying the report card approach in their context. Present the report card in the meeting of stakeholders of Chilika Lake Holding of a workshop with participation of key policy makers and managers of Indian coastal zone management programme to disseminate the project results and up-scale application of the report card approach.

36 Lesson learnt Management of wetlands needs adaptive institutions with ability to work at multiple scales and engage with diverse stakeholders with the local communities ( major resource users)at the center stage. Investing into multiple knowledge base systems to benefit from cutting edge science as well as traditional knowledge is highly essential. Participatory research (informed stake holders translating scientific findings into practice), helps in connecting ecosystem to the communities and facilitate resource efficient and inclusive management. Diversity and resilience are essential for maintaining ecological integrity and sustainable livelihood. Investment in restoration of ecosystem can lead to enhancement of ecosystem services, ameliorate biodiversity making the system resilient, ensuring sustainability. Application of the various Ramsar guidelines, and the use of the Convention's tools and approaches, to address complex issues.


37 Thank you for your kind attention