CMTC SPE Life beyond 80 A Look at Conventional WAG Recovery beyond 80% HCPV Injection in CO2 Tertiary Floods. David H.
|
|
|
- Jerome Melvin Davis
- 5 years ago
- Views:
Transcription


1 CMTC SPE Life beyond 80 A Look at Conventional WAG Recovery beyond 80% HCPV Injection in CO2 Tertiary Floods CMTC The Energy Gap How CO 2 Tertiary Oil Recovery will mark its place in the 21st Century David H. Merchant Presented to Midland CO 2 Conference December 9, 2015 Midland, Texas

")
2 Permian Basin Welcome to the Permian Basin? 300 miles (480 km) North South 250 miles (400 km) East West
3 Carbon Management Technical Conference November 2015 Sugarland, Texas CMTC SPE Life beyond 80 A Look at Conventional WAG Recovery beyond 80% HCPV Injection in CO2 Tertiary Floods CMTC The Energy Gap How CO 2 Tertiary Oil Recovery will mark its place in the 21st Century Thanks: CMTC Management Team George Koperna (ARI) Greatly Appreciated, Thank you
4 CMTC MS SPE Life beyond 80 A Look at Conventional WAG Recovery beyond 80% HCPV Injection in CO2 Tertiary Floods David Merchant, Merchant Consulting Note: This paper, along with my other SPE and CMTC Publications can be down-loaded from my WEB sites listed above.
5 What is CO 2 Tertiary Oil Recovery?
6 Tertiary CO 2 Flooding CO 2 Flood History since 1972 Since 1972 over 130+ CO 2 Tertiary Projects have been implemented in the United States. Today, CO 2 projects in the United States produce over 350,000 BOPD with CO 2 transported over 4,500 miles of CO 2 pipeline. Sacroc Field

7 Permian Basin Statistics
8 Permian Basin First Commercial CO 2 Flood Latest Success Story Sacroc Unit in Kelly Snyder Field
9 EXISTING MARKETS Year Wyoming CURRENT CO2 SOURCES and PIPELINES Canadian Washington Oregon Nevada California Idaho Arizona Montana LaBarge Wyoming Nebraska Utah Colorado North Dakota Minnesota South Dakota McElmo Dome Sheep Mountain Great Plains Coal Plant Kansas Oklahoma Bravo Dome Wisconsin Iow a Illinois Missouri Arkansas Maine New Hampshire Vermont New York Massachusetts Michigan Rhode Island Connecticut Pennsylvania New Jersey Ohio Indiana Delaw are Maryland W. Virginia Virginia Kentucky North Carolina Tennessee South Carolina Sacroc Unit Kelly Snyder Field New Mexico Permian Basin Texas Terrell, Puckett, Mitchell, Grey Ranch Plants Louisiana Mississippi Alabama Jackson Dome Georgia Florida Louisiana/Mississippi PETRA 12/1/99 10:10:02 AM Ft/In

 recovers Tertiary Oil from")
10 Canyon Reef Map Sacroc Unit SACROC UNIT KELLY SNYDER FIELD BASE MAP By: David H. Merchant Date: September Ft/In PETRA 9/12/00 12:17:43 AM The Kelly Snyder Field (Sacroc Unit) recovers Tertiary Oil from the Canyon Reef Limestone Formation about 6,700 ft. deep
11 Sacroc Unit Production History Sacroc Unit Historical Production and Injection Field Discovery November , ,000 Water Injection Septembe r 1954 CO2 Injection January 1972 SACROC UNIT KELLY SNYDER FIELD Peak Oil Rate 209,000 BOPD Peak Water Inj. 126,000 BWIPD BOPD MCFIPD BWIPD 1,200,000 1,000, , ,000 BOPD, MCFIPD 150, , ,000 50,000 - Jan-48 Jan-50 Jan-52 Jan-54 Jan-56 Jan-58 Jan-60 Jan-62 Jan-64 Jan-66 Jan-68 Jan-70 Jan-72 Jan-74 Jan-76 Jan-78 Jan-80 Jan-82 Jan-84 Jan-86 Jan-88 Jan-90 Jan-92 BWIPD Jan-94 Jan-96 Jan-98 Jan , ,000 Year Time, years Curre nt Oil Rate 9,071 BOPD
12 Sacroc Unit Pennzoil Operatorship
13 Sacroc Unit Pennzoil Operatorship ,000 SACROC UNIT KELLY SNYDER FIELD BOPD MCFIPD BWIPD 1,200, ,000 1,000, , ,000 BOPD, MCFIPD 150, , ,000 50,000 - Jan-48 Jan-50 Jan-52 Jan-54 Jan-56 Jan-58 Jan-60 Jan-62 Jan-64 Jan-66 Jan-68 Jan-70 Jan-72 Jan-74 Jan-76 Jan-78 Jan-80 Jan-82 Jan-84 Jan-86 Jan-88 Jan-90 Jan-92 Jan-94 Jan-96 Jan-98 BWIPD Jan , ,000 - Time, years

14 Sacroc Unit Pennzoil Ownership Center-line Project 1996 CO 2 Pattern Development Plan 300 Acre Pilot Pennzoil Team 1. Ghasem Bayat 2. Tony Benvegnu 3. Claud Pickard 4. Jack Horkowitz 5. Tom Wingate 6. Don Hartman
15 Sacroc Unit Pennzoil Ownership Historical Production Oil Production and CO 2 Injection SACROC UNIT KELLY SNYDER FIELD BOPD MCFIPD 40, ,000 32,000 Pennzoil 200, ,000 BOPD, MCFD, MCFIPD 24,000 16,000 3 years 120,000 80,000 8,000 40,000 - Jan-90 Jan-91 Jan-92 Jan-93 Jan-94 Jan-95 Jan-96 Jan-97 Jan-98 Jan-99 Jan-00 Time, years -
16 Sacroc Unit Pennzoil Ownership Historical Production by Project Area SACROC UNIT KELLY SNYDER FIELD Oil Rate - Historical ( ) CENTERLINE NORFLOOD SOUTHWEST BANK NON PROJECT AREA Jan-90 Jan-91 Jan-92 Jan-93 Jan-94 Jan-95 Jan-96 Jan-97 Jan-98 Jan-99 Jan-00 BOPD Center-line Project Up 3000 BOPD Time - years
17 Sacroc Unit Devon Operatorship Kinder Morgan Ownership Today
18 Sacroc Unit Current CO 2 and Water Injection SACROC UNIT KELLY SNYDER FIELD MSCFIPD (CO2)-HIST BWIPD-HIST 900, , , , ,000 Historical Water and CO2 Injection Kinder Morgan Company purchased Shell CO2 Company in April MMSCFD 800, , ,000 MSCFIPD 500, , , , , Jan-97 Jul-97 Jan-98 Jul-98 Jan-99 Jul-99 Jan-00 Jul-00 Jan-01 Jul-01 Jan-02 Jul-02 Jan-03 Jul-03 Jan-04 Time, years CO 2 Injection Increase 120 MMSCFD Jul-04 Jan-05 Jul-05 Jan-06 Jul-06 Jan-07 Jul-07 Jan-08 Jul-08 Jan-09 Jul-09 Jan-10 Jul , , , , ,000 - BWIPD
19 Sacroc Unit Current Oil Production 40,000 35,000 30,000 Historical Oil Rate Kinder Morgan Company purchased Shell CO2 Company in April 2000 SACROC UNIT KELLY SNYDER FIELD Predictions Oil Rate BOPD-HIST BOPD-(Base Case) BOPD-(2000 Prediction) 33,000 BOPD 25,000 BOPD 20,000 15,000 10,000 5, ,500 BOPD Jan-97 Jul-97 Jan-98 Jul-98 Jan-99 Jul-99 Jan-00 Jul-00 Jan-01 Jul-01 Jan-02 Jul-02 Jan-03 Jul-03 Jan-04 Time, years Tertiary Oil Response In 2015, the field continues to produce over 30,000 BOPD Jul-04 Jan-05 Jul-05 Jan-06 Jul-06 Jan-07 Jul-07 Jan-08 Jul-08 Jan-09 Jul-09 Jan-10 Jul
20
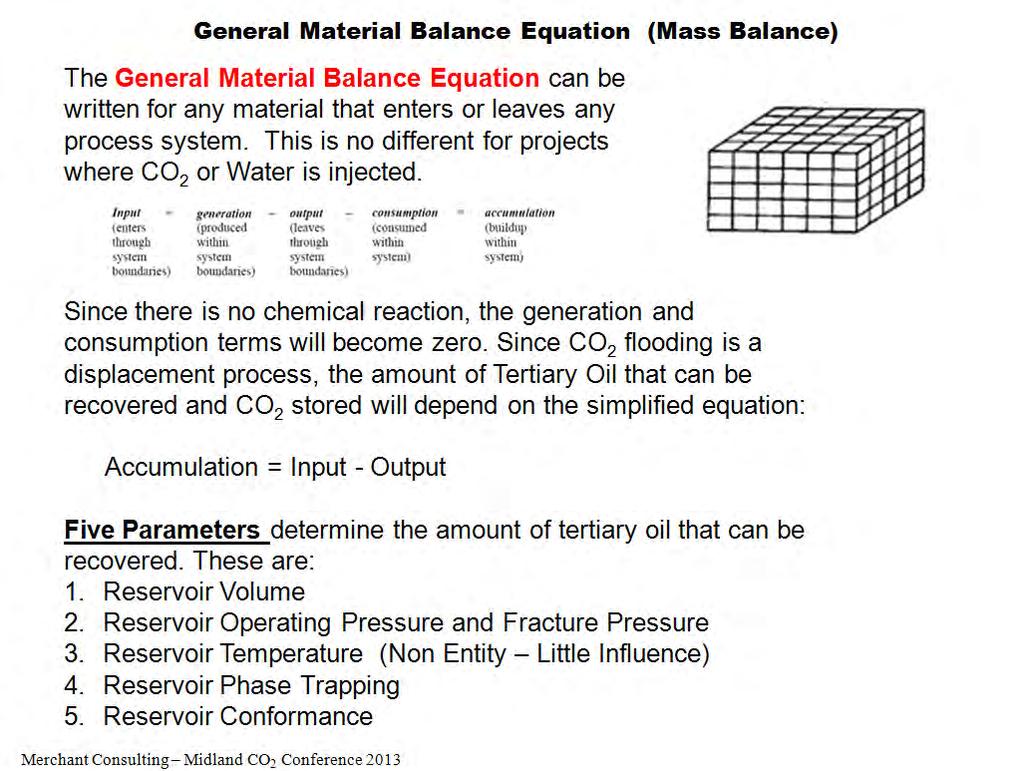
21

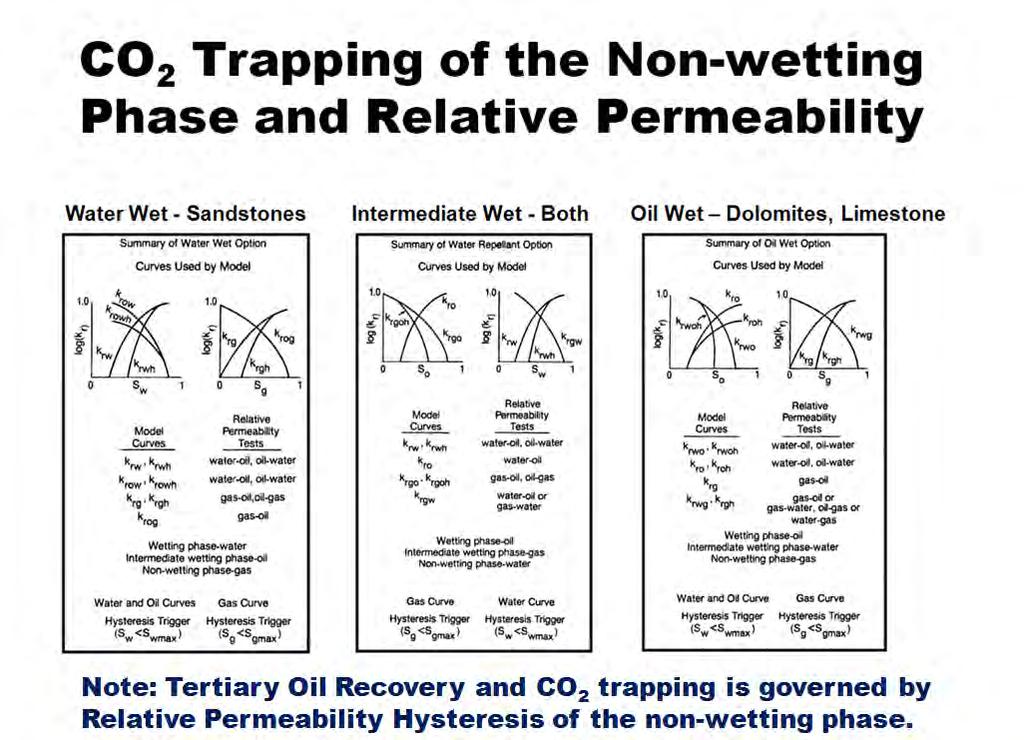
22 You can t fool Mother Nature. The amount of CO 2 TRAPPED, STORED, OR SEQUESTERED is dependent on the Composition of the Residual Oil Saturation and Phase Trapping of the Non-Wetting Phase, which in this case is CO 2.
23 CO 2 Miscible Process Compositionally Driven Oil Bank Transition Zone CO2 Rich (Slug) Oil Bank Residual Oil Multiple Contact Miscible Process (time and compositionally dependent) Miscible Zone formed by CO 2 becoming enriched with C 2 C 30
24

25
26
27 Ten CO 2 Recovery Methods
 4. Double Displacement (Yates Field) 5. Gas Cycling (Denbury, Mississippi). 6. Huff-and-Puff (100+ Projects) 7. Heavy Oil - Calif. (14+ API Gravity) 8.")
28 Tertiary CO 2 Flooding Ten CO 2 Recovery Methods used for Tertiary Oil Recovery in the United States 1. Conventional WAG Recovery (90%+) 2. Residual Oil Zone (ROZ) (Seminole) 3. Gravity Drainage (Yates Field) 4. Double Displacement (Yates Field) 5. Gas Cycling (Denbury, Mississippi). 6. Huff-and-Puff (100+ Projects) 7. Heavy Oil - Calif. (14+ API Gravity) 8. Shale Oil (Bakken) (Under Investigation) 9. Horizontal Well Pattern Development 10. CO 2 Gas Drive w/ Nitro Boost
 (Seminole) 3. Gravity Drainage (Yates Field) 4. Double Displacement (Yates Field) 5. Gas Cycling (Denbury, Mississippi). 6.")

29 Conventional WAG w/ ROZ Ten CO 2 Recovery Methods used for Tertiary Oil Recovery in the United States 1. Conventional WAG Recovery (90%+) 2. Residual Oil Zone (ROZ) (Seminole) 3. Gravity Drainage (Yates Field) 4. Double Displacement (Yates Field) 5. Gas Cycling (Denbury, Mississippi). 6. Huff-and-Puff (100+ Projects) 7. Heavy Oil - Calif. (14+ API Gravity) 8. Shale Oil (Bakken) (Under Investigation) 9. Horizontal Well Pattern Development 10. CO 2 Gas Drive w/ Nitro Boost SPE Paper Life Beyond 80 A look at Conventional WAG Recovery beyond 80% HCPV Injection in CO 2 Tertiary Floods
30
31
32
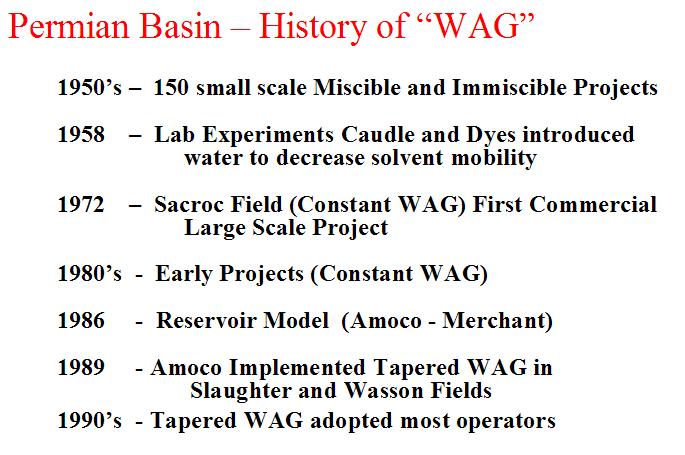
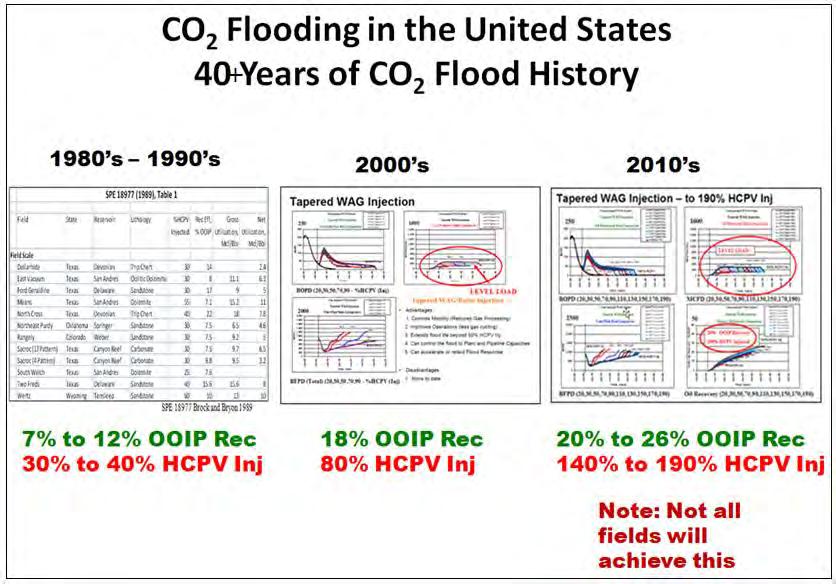
33 Tertiary CO 2 Flooding The Previous Millennium 20 th Century Life below 80% HCPV Injected
34 Example -WAG BENEFITS (Control CO 2 Process) Dean C Unit - Mobil Duggan Slaughter Unit - Pennzoil Dean C unit Altura Anadark o Smith Igoe M R Berry Alt ur a GB Luc as Unit Apac he Hudgens Unit Pennzoil Glimp Unit WG Frazier Unit - Altura Mallet Land and Cattle - Pennzoil Sundown Unit - Altura Coons Unit Ex x on Alex Slaughter Unit M edallion M G Gordon Pennzoil Oxy-Permian - Slaughter Estate Unit in Slaughter Field SLAUGHTER FIELD - Slaughter Field Project - All Leases in Slaughter Field Slaughter Field Map - Current Operators Tyner Unit - Oxy XIT Unit - Apache NW Mallet Unit - Altura Mallet Unit - OXY West RKM Unit - Altura Conoco Dean Unit - Merit East RKM Unit - Altura CS Dean A Unit - Apache FL Woodley Unit - Mobil League 91 Unit Igoe Smith Unit Altura HT Boyd Unit Mallet Unit - Mobil East Mallet Unit - Mobil Bass Properties Dean B Unit - Union Royalty Boyd Mallet Unit - Belco Central Mallet Unit - Altura Bob Slaughter Unit - Texaco Slaughter Estate Unit - Altura Mallet LC (C,D,F) - Texaco Cochran County Hockley County Yoakum County Terry County Ft/In PETRA 8/1/99 9:35:02 AM SPE Paper No
 1984 1994 1984 1994 1984 1994 1984 1994 SPE Paper No.")
35 Example - WAG BENEFITS (Control CO 2 Process) Oxy-Permian - Slaughter Estate Unit in Slaughter Field Production and Injection ( ) SPE Paper No

36 Example - WAG BENEFITS (Control CO 2 Process) Level Load Gas Production WAG Change Effect of Constant WAG Injection Operations Oil Prod Gas Prod Effect of Over-WAG Ops.
37 Tertiary CO 2 Flooding The New Millennium 21 st Century Life beyond 80% HCPV Injected

38 2010 s SPE Paper Life Beyond 80 A look at Conventional WAG Recovery beyond 80% HCPV Injection in CO 2 Tertiary Floods
39
40 Field Example Seminole Field
41 Oil Field Basics Oil Field History (All Fields Worldwide) Well Log Recovery Mechanisms Primary Oil Recovery Secondary Recovery Tertiary Oil Recovery
.")
42 Tertiary CO 2 Flooding Permian Basin (Seminole Field) Seminole Field Location Seminole Field Seminole Field The Seminole field recovers Tertiary Oil from the San Andres Formation about 5,500 ft. deep which also includes a large Residual Oil Zone (ROZ). The Field is developed on 9-spot pattern spacing.

43 Permian Basin (Residual Oil Zone - ROZ) Gas Cap Main Pay ROZ Total Gross= 406 ft Total Net= 333 ft Melzer CO 2 Conf 2011
44 Permian Basin (Residual Oil Zone - ROZ) ROZ - Oil Saturation Profile Oil Saturation Original 0% 100% Oil Saturation Today 0% 100% Note: Reservoir originally contained full column of oil Oil migrated elsewhere in basin A Residual Oil Saturation remained afterwards Note: ROZ Pay Zones do not exist in all Basins
45 Seminole San Andres Unit Primary Recovery 100,000 Seminole San Andres Unit BOPD Primary Recovery BOPD (WF) BOPD (PRIMARY) Total Unit Performance MCFD BWPD BOPD (PREDICTION) Historical Production and Injection - Rate Predictions MCFD (PRIMARY PRED) (Primary, Secondary, Tertiary Recovery Mechanisms) BWPD (PRIMARY PRED) 100,000 BOPD 500,000 BWPD, MCFD Field Discovery ,000 BOPD 80,000 60,000 40,000 20,000 Primary Peak Oil Production - 25,000 BOPD Today 400, , , ,000 BWPD, MSCFD (Total Gas) 0 0 Jan-35 Jan-40 Jan-45 Jan-50 Jan-55 Jan-60 Jan-65 Jan-70 Jan-75 Jan-80 Jan Time, years Jan-90 Jan-95 Jan-00 Jan-05 Jan-10 Jan-15 Jan-20 Jan-25 Jan-30 Jan-35 Jan-40 Note: Little Water Production occurred during Primary Recovery Note: Reservoir Pressure depleted during this time frame
46 Seminole San Andres Unit Secondary Recovery - Waterflood 250,000 BWIPD 250,000 Seminole San Andres Unit Total Unit Performance Historical and Prediction - Water Injection BWIPD BWIPD (Pred) 200,000 BWIPD 150, ,000 Water Injection Today 50,000 0 Jan-35 Jan-40 Jan-45 Jan-50 Jan-55 Jan-60 Jan-65 Jan-70 Jan-75 Jan-80 Jan-85 Jan-90 Jan-95 Jan-00 Jan (WF) 2012 Time, years Jan-10 Jan-15 Jan-20 Jan-25 Jan-30 Jan-35 Jan-40 Note: Water Injection is introduced into the Reservoir in 1971 Note: Mass Balance Water had to be found to initiate Waterflood operations
47 Seminole San Andres Unit Secondary Recovery - Waterflood Seminole San Andres Unit BOPD Secondary Recovery BOPD (WF) BOPD (PRIMARY) Total Unit Performance MCFD BWPD Historical Production and Injection - Rate Predictions BOPD (PREDICTION) MCFD (SECONDARY PRED) (Primary, Secondary, Tertiary Recovery Mechanisms) BWPD (SECONDARY PRED) 100,000 BOPD 500,000 BWPD, MCFD 100, ,000 Field Discovery BOPD 80,000 60,000 40,000 20,000 Secondary Peak Oil Production - 75,000 BOPD Water Injection Today 400, , , ,000 BWPD, MSCFD (Total Gas) 0 Jan-35 Jan-40 Jan-45 Jan-50 Jan-55 Jan-60 Jan-65 Jan-70 Jan-75 Jan-80 Jan (WF) Time, years Jan-90 Note: Good Secondary Oil Response after Water Injection Note: Gas Production collapsed after Water Injection (Pressure-up) Note: Water Prodution occurred shortly after Water Injection Jan-95 Jan-00 Jan-05 Jan-10 Jan-15 Jan-20 Jan-25 Jan-30 Jan-35 Jan-40 0
48 Seminole San Andres Unit BOPD (WF) Seminole San Andres Unit BOPD (PRIMARY) Tertiary Recovery BOPD (PREDICTION) Total Unit Performance BOPD (Main Pay Only) MCFD Historical Production and Injection - Rate Predictions BWPD BWPD (Pred) (Primary, Secondary, Tertiary Recovery Mechanisms) MCFPD (Pred) 100,000 BOPD 250,000 BWPD, MCFD 100, ,000 Field Discovery Tertiary Peak (MP) Peak Oil Production - 43,000 BOPD BOPD 80,000 60,000 40,000 20,000 Secondary Peak Oil Production - 75,000 BOPD Today (Level Load) 200, , ,000 50,000 BWPD, MSCFD (Total Gas) 0 0 Jan-35 Jan-40 Jan-45 Jan-50 Jan-55 Jan-60 Jan-65 Jan-70 Jan-75 Jan-80 Jan CO 2 Injection 1983 (MP) Time, years Jan-90 Jan-95 Jan-00 Jan-05 Jan-10 Jan-15 Jan-20 Jan-25 Jan-30 Jan-35 Jan-40 Note: The Reservoir produced a strong Tertiary Oil Response Note: Total Gas Production increased with rapid breakthrough Note: Water Injection and Production were decreasing prior to 1996 prior to ROZ start-up in 1996 Note: Total Gas Rate is Level Loaded to Plant Inlet Rate
49 Seminole San Andres Unit 250,000 Seminole San Andres Unit Total Unit Performance Historical and Prediction - Water and CO 2 Injection BWIPD BWIPD (Pred) MCFIPD MCFIPD (Pred) 250,000 BWIPD 500,000 MSCFIPD 500, , ,000 BWIPD 150, ,000 Water Injection Today 300, ,000 MSCFIPD 50, , Jan-35 Jan-40 Jan-45 Jan-50 Jan-55 Jan-60 Jan-65 Jan (WF) 1983 (MP) 1996 (ROZ) 2012 CO 2 Injection Jan-75 Jan-80 Jan-85 Jan-90 Jan-95 Jan-00 Jan-05 Jan-10 Jan-15 Jan-20 Jan-25 Jan-30 Time, years Jan-35 Jan-40 Note: Total Gas Injection has been constant since CO 2 Injection in 1983 Note: Water Injection was decreasing from 1983 to 1996 (Prior to ROZ)
50 Seminole San Andres Unit Tertiary Recovery (Main Pay Only) Seminole San Andres Unit Total Unit Performance Historical Oil (Primary + Secondary + Tertiary) Recovery - % OOIP 100 PRIMARY SECONDARY TERTIARY OIL REC PRIMARY - % OOIP OIL REC WF - % OOIP OIL RECOVERY - % OOIP OIL REC PRIMARY - % OOIP OIL REC WF - % OOIP OIL RECOVERY - % OOIP PREDICTION Jan-35 Jan-40 Jan-45 Jan-50 Jan-55 Jan-60 Jan-65 Jan-70 Jan-75 Jan-80 Jan-85 Jan-90 Jan-95 Jan-00 Jan-05 Jan-10 Jan-15 Jan-20 Jan-25 Jan-30 OIL RECOVERY - % OOIP Jan-35 Jan-40 Expected Ultimate Oil Recovery % Tertiary Oil Recovery % Waterflood Oil Recovery % Primary Recovery- 12.8% Total Incremental Tertiary Oil Recovery to Date % Time, years Note: The Reservoir is expected to Recover 26% of its OOIP with CO 2 Injection
51 Seminole San Andres Unit BOPD Seminole San Andres Unit BOPD (WF) Tertiary Recovery BOPD (Tertiary MP) Total Unit Performance BOPD (ROZ) (ROZ Addition) MCFD Historical Production and Injection - Rate Predictions BWPD BWPD (Pred) (Primary, Secondary, Tertiary Recovery Mechanisms) MCFPD (Pred) 100,000 BOPD 250,000 BWPD, MCFD 100, ,000 Field Discovery Tertiary Peak (MP) Peak Oil Production - 43,000 BOPD BOPD 80,000 60,000 40,000 20,000 Secondary Peak Oil Production - 75,000 BOPD Today (Level Load) 200, , ,000 50,000 BWPD, MSCFD (Total Gas) 0 0 Jan-35 Jan-40 Jan-45 Jan-50 Jan-55 Jan-60 Jan-65 Jan-70 Jan-75 Jan-80 Jan CO 2 Injection 1983 (MP) 1996 (ROZ) Time, years Jan-90 Jan-95 Jan-00 Jan-05 Jan-10 Jan-15 Jan-20 Jan-25 Jan-30 Jan-35 Jan-40 Note: The ROZ produced a strong Tertiary Oil Response Note: Total Gas Production has been Level Loaded to Plant Inlet Rate Note: ROZ Water Production will be strong initially, but should decrease with time, level out, and then increase as WAG Ratio is increased
52 Seminole San Andres Unit 250,000 Seminole San Andres Unit Total Unit Performance Historical and Prediction - Water and CO 2 Injection BWIPD BWIPD (Pred) MCFIPD MCFIPD (Pred) 250,000 BWIPD 500,000 MSCFIPD 500, , ,000 BWIPD 150, ,000 Water Injection Today 300, ,000 MSCFIPD 50, , Jan-35 Jan-40 Jan-45 Jan-50 Jan-55 Jan-60 Jan-65 Jan (WF) 1983 (MP) 1996 (ROZ) 2012 CO 2 Injection Jan-75 Jan-80 Jan-85 Jan-90 Jan-95 Jan-00 Jan-05 Jan-10 Jan-15 Jan-20 Jan-25 Jan-30 Time, years Jan-35 Jan-40 Note: Total Gas Injection has been constant since CO 2 Injection in 1988 Note: Water Injection was decreasing from 1983 to 1996 (Prior to ROZ) Note: ROZ Increase in Water Injection in 1996 and decrease in 2000
 4. Double Displacement (Yates Field) 5. Gas Cycling (Denbury, Mississippi). 6. Huff-and-Puff (100+ Projects) 7. Heavy Oil - Calif. (14+ API Gravity) 8.")
53 Gravity Drainage / Double Displacement Ten CO 2 Recovery Methods used for Tertiary Oil Recovery in the United States 1. Conventional WAG Recovery (90%+) 2. Residual Oil Zone (ROZ) (Seminole) 3. Gravity Drainage (Yates Field) 4. Double Displacement (Yates Field) 5. Gas Cycling (Denbury, Mississippi). 6. Huff-and-Puff (100+ Projects) 7. Heavy Oil - Calif. (14+ API Gravity) 8. Shale Oil (Bakken) (Under Investigation) 9. Horizontal Well Pattern Development 10. CO 2 Gas Drive w/ Nitro Boost
54 CO 2 Sequestration, Gas Storage and Gravity Drainage Projects Low Dip Reservoir (Conformance can be detrimental) Gas Cycling is a big problem Moderately Low or High Dip Res. (Can run Miscible or Immiscible) Conduct a gravity Stabilized CO 2 flood with chase gas CO 2 Conformance Problems Chase Gas Inj. CO 2, Flue gas, Nitrogen, Air CO 2 Bank Displacement Process Replacement Process

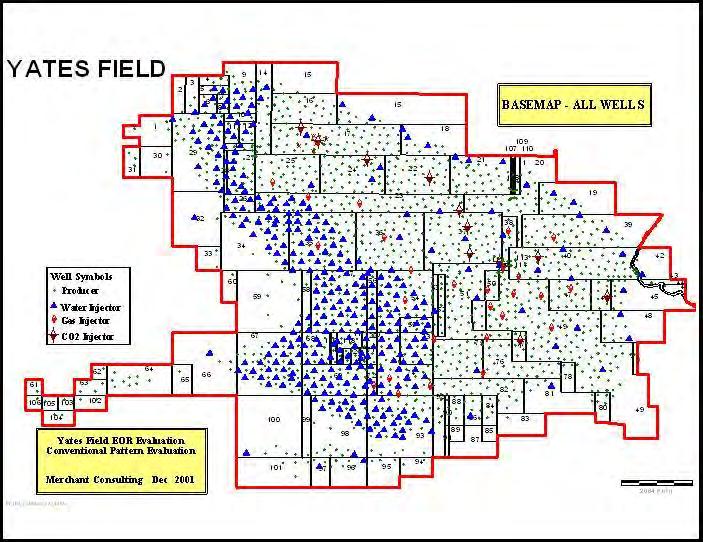
55 San Andres Map Yates Field San Andres Map Yates Field
56 Yates Reservoir History Discovery: 1926 Discovered in of Oil Column at Structure Top Produced By Individual Operators Unitized in 1976 to Prevent Aquifer Influx Gas Re-injected,Water Re-injected Oil Column Thinned Double Displacement Reservoir Dewatering Contact Lowering Contact Stabilization (30 ft oil column) Gas Cap Injection Aquifer Maintenance By Offsite Disposal
57 Yates Unit Historical Performance Yates Total Unit Performance Production and Injection BOPD MCFPD MSCFIPD(Total Gas) 250,000 Primary Production History Secondary and Tertiary Production History BWPD 500,000 BWIPD 200, ,000 Oil Production (Peak) 130 MBOPD (approx.) 150, ,000 50,000 0 Jan-25 Jan-30 Jan-35 Jan-40 Jan-45 Jan-50 Jan-55 Jan-60 Jan-65 Jan-70 Jan-75 Jan-80 Jan-85 Jan-90 Jan-95 Jan-00 Jan-05 BOPD, MSCFD 300, ,000 BWPD 100,000 0 Time, years Field Production and Injection
58 Yates Unit Historical Performance Yates Total Unit Performance Gas Injection Only BOPD MSCFPD(GAS) 200, ,000 Gas Inj Startup - July 1976 Tertiary Production History MSCFPD(CO2) 250,000 MSCFPD(N2) 160,000 CO2 Gas Injection 200, ,000 N2 Gas Injection BOPD, MSCFD 120, ,000 80,000 60,000 Comb Gas Injection 150, ,000 MSCFIPD (GAS,CO2, N2) 40,000 50,000 20,000 0 Jan-70 Jan-72 Jan-74 Jan-76 Jan-78 Jan-80 Flue Gas CO2 Nitrogen/CO2 CO2 Jan-82 Jan-84 Jan-86 Jan-88 Jan-90 Jan-92 Jan-94 Jan-96 Jan-98 Jan-00 Jan-02 Jan-04 0 CO2 Injection Startup - Nov Time, years Field Gas Injection Breakout
59 Yates Unit Historical Performance 250,000 Historical N 2 and CO 2 Injection Yates Total Unit Performance Nitrogen and CO2 Injection (Current) MSCFIPD (N2)-HIST MSCFIPD (CO2)-HIST 200, ,000 N 2 100,000 50,000 - Jan-97 Jul-97 Jan-98 Jul-98 Jan-99 Jul-99 Jan-00 Jul-00 Jan-01 Jul-01 Jan-02 Jul-02 Jan-03 Jul-03 Jan-04 Jul-04 Jan-05 Jul-05 Jan-06 Jul-06 Jan-07 Jul-07 Jan-08 Jul-08 Jan-09 Jul-09 Jan-10 Jul-10 MSCFIPD Kinder Morgan returned CO2 injection to Yates field in 2003 in addition to a horizontal drilling program CO 2 Time, years Field Injection (Current)
60 Yates Unit Historical Performance Yates Total Unit Performance Oil Production (Current) BOPD-HIST 70,000 60,000 50,000 Historical Oil Rate Kinder Morgan returned CO2 injection to Yates field in 2003 in addition to horizontal drilling program BOPD 40,000 30,000 20,000 10,000 - Jan-97 Jul-97 Jan-98 Jul-98 Jan-99 Jul-99 Jan-00 Jul-00 Jan-01 Jul-01 Jan-02 Jul-02 Jan-03 Jul-03 Jan-04 Jul-04 Jan-05 Jul-05 Jan-06 Jul-06 Jan-07 Jul-07 Jan-08 Jul-08 Jan-09 Jul-09 Jan-10 Jul-10 10,000 BOPD Increase Time, years Field Production (Current) In 2015, the field continues to produce between 20,000 BOPD and 30,000 BOPD
61 Gas Cycling Denbury Resources Ten CO 2 Recovery Methods used for Tertiary Oil Recovery in the United States 1. Conventional WAG Recovery (90%+) 2. Residual Oil Zone (ROZ) (Seminole) 3. Gravity Drainage (Yates Field) 4. Double Displacement (Yates Field) 5. Gas Cycling (Denbury, Mississippi). 6. Huff-and-Puff (100+ Projects) 7. Heavy Oil - Calif. (14+ API Gravity) 8. Shale Oil (Bakken) (Under Investigation) 9. Horizontal Well Pattern Development 10. CO 2 Gas Drive w/ Nitro Boost

62 Gas Cycling Example Denbury Little Creek Field and West Mallalieu Field


63 Gas Cycling Example Denbury Little Creek Field and West Mallalieu Field Denbury: 2006 CO 2 Conf
64 Huff-n-Puff (Single Well Injection) Ten CO 2 Recovery Methods used for Tertiary Oil Recovery in the United States 1. Conventional WAG Recovery (90%+) 2. Residual Oil Zone (ROZ) (Seminole) 3. Gravity Drainage (Yates Field) 4. Double Displacement (Yates Field) 5. Gas Cycling (Denbury, Mississippi). 6. Huff-and-Puff (100+ Projects) 7. Heavy Oil - Calif. (14+ API Gravity) 8. Shale Oil (Bakken) (Under Investigation) 9. Horizontal Well Pattern Development 10. CO 2 Gas Drive w/ Nitro Boost
65 Tertiary CO 2 Flooding

66 Small Field and Huff-n-Puff Example Dr. Robert Zubrin
 4. Double Displacement (Yates Field) 5. Gas Cycling (Denbury, Mississippi). 6. Huff-and-Puff (100+ Projects) 7. Heavy Oil - Calif. (14+ API Gravity) 8.")
67 Heavy Oil (14+ API Gravity) Ten CO 2 Recovery Methods used for Tertiary Oil Recovery in the United States 1. Conventional WAG Recovery (90%+) 2. Residual Oil Zone (ROZ) (Seminole) 3. Gravity Drainage (Yates Field) 4. Double Displacement (Yates Field) 5. Gas Cycling (Denbury, Mississippi). 6. Huff-and-Puff (100+ Projects) 7. Heavy Oil - Calif. (14+ API Gravity) 8. Shale Oil (Bakken) (Under Investigation) 9. Horizontal Well Pattern Development 10. CO 2 Gas Drive w/ Nitro Boost Wilmington Onshore CO 2 Pilots Wilmington Offshore THUMS Unit
68 Heavy Oil Example 14+ API Gravity Wilmington Field Los Angeles (3 CO 2 Pilots) Wilmington Field
 4. Double Displacement (Yates Field) 5. Gas Cycling (Denbury, Mississippi). 6. Huff-and-Puff (100+ Projects) 7. Heavy Oil - Calif. (14+ API Gravity) 8.")
69 Shale Oil Bakken, Wolfcamp Ten CO 2 Recovery Methods used for Tertiary Oil Recovery in the United States 1. Conventional WAG Recovery (90%+) 2. Residual Oil Zone (ROZ) (Seminole) 3. Gravity Drainage (Yates Field) 4. Double Displacement (Yates Field) 5. Gas Cycling (Denbury, Mississippi). 6. Huff-and-Puff (100+ Projects) 7. Heavy Oil - Calif. (14+ API Gravity) 8. Shale Oil (Bakken) (Under Investigation) 9. Horizontal Well Pattern Development 10. CO 2 Gas Drive w/ Nitro Boost

70 Williston Basin Bakken Formation Shale Oil Target To improve Primary Oil Recovery, operators have resorted from single to bilateral Horizontal Well Completions with massive sand fracture technology to improve Primary Oil Recovery.

71 Williston Basin Bakken Formation To make this technology work, large investments involving many horizontal wells on steep decline are required to keep a reasonable continuous rate profile. This results in a many well, many year continuous drilling programs.


72 Williston Basin Bakken Formation Results of this effort are shown below The 10 year Bakken development plan shown above contains 10 one year phases. Ninety wells per phase per year are required for the first four phases with 45 wells per phase per year for the last six phases. This results in a total of 635 wells to be drilled over a 10 year period with a single well cost of around 3 million dollars. For other areas of the Bakken drilling costs can exceed 12 million dollars per well.
73 Williston Basin Bakken Formation Reservoir Model Study CO 2 Tertiary Prediction CO 2 Oil Recovery Primary Oil Recovery Simulation Comparison study results are shown above. Primary recovery was limited to 5 years (3.64% OOIP). With CO 2 Injection over 95 years, Continuous Injection of CO 2 out-performed water injection and other cyclic Huff-n-Puff injection schemes.
74 Williston Basin Bakken Formation Reservoir Model Study CO 2 Tertiary Prediction Water flood Recovery CO 2 Recovery The simulation results show that CO 2 flooding presents a technically promising method for recovering Bakken oil, but over a very long injection period (95 years of injection). Also, note the long time to breakthrough (several months to many years).
 2. Residual Oil Zone (ROZ) (Seminole) 3. Gravity Drainage (Yates Field) 4.")
 8. Shale Oil (Bakken) (Under Investigation) 9.")
75 Horizontal Well Development Ten CO 2 Recovery Methods used for Tertiary Oil Recovery in the United States 1. Conventional WAG Recovery (90%+) 2. Residual Oil Zone (ROZ) (Seminole) 3. Gravity Drainage (Yates Field) 4. Double Displacement (Yates Field) 5. Gas Cycling (Denbury, Mississippi). 6. Huff-and-Puff (100+ Projects) 7. Heavy Oil - Calif. (14+ API Gravity) 8. Shale Oil (Bakken) (Under Investigation) 9. Horizontal Well Pattern Development 10. CO 2 Gas Drive w/ Nitro Boost


76 Horizontal Drilling CO 2 Projects Canada - Weyburn Field Utah - Aneth Field Current CO 2 Floods Montana Cedar Creek Anticline North Sea Denmark Dan Field Future CO 2 Floods
 2. Residual Oil Zone (ROZ) (Seminole) 3. Gravity Drainage (Yates Field) 4.")
 8. Shale Oil (Bakken) (Under Investigation) 9.")
77 CO 2 Gas Drive w/ Nitro Boost Ten CO 2 Recovery Methods used for Tertiary Oil Recovery in the United States 1. Conventional WAG Recovery (90%+) 2. Residual Oil Zone (ROZ) (Seminole) 3. Gravity Drainage (Yates Field) 4. Double Displacement (Yates Field) 5. Gas Cycling (Denbury, Mississippi). 6. Huff-and-Puff (100+ Projects) 7. Heavy Oil - Calif. (14+ API Gravity) 8. Shale Oil (Bakken) (Under Investigation) 9. Horizontal Well Pattern Development 10. CO 2 Gas Drive w/ Nitro Boost

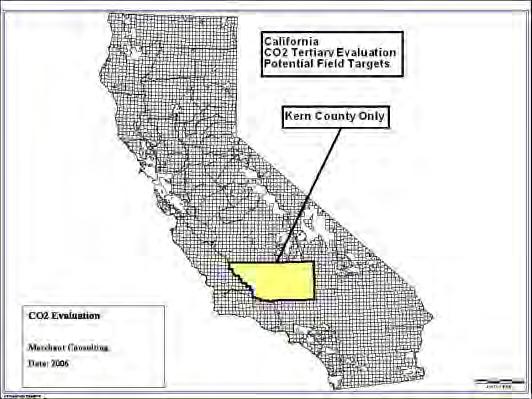
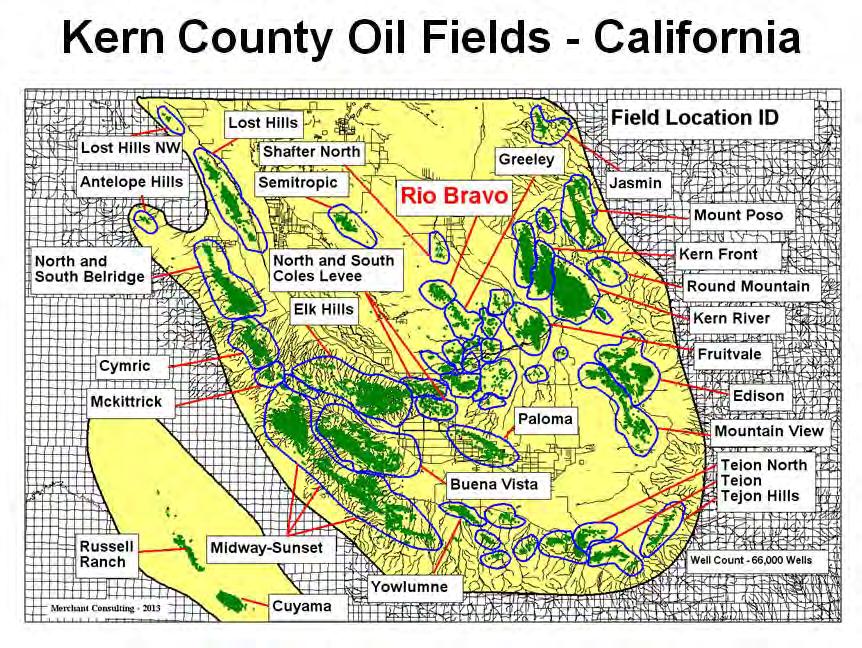
78 California Kern County Oil Fields Kern County California Kern County California

79 Rio Bravo Field - Phased-in Pattern Development Conventional WAG Case Producer and Injector Pattern Development

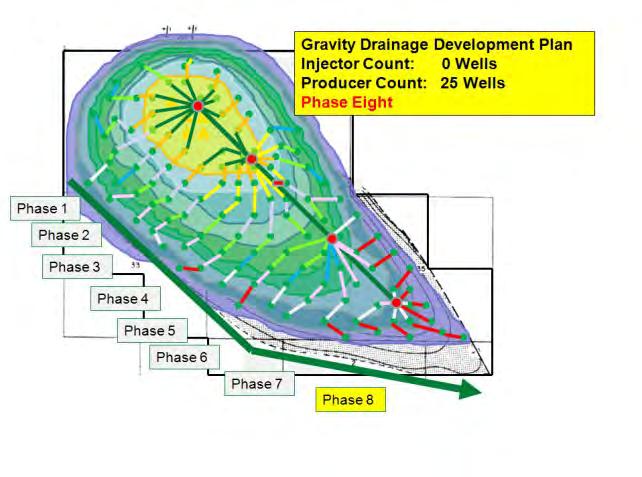
80 Rio Bravo Field - Phased-in Pattern Development Gravity Drainage Case - Injectors

81 Rio Bravo Field - Phased-in Pattern Development Gravity Drainage Case - Producers

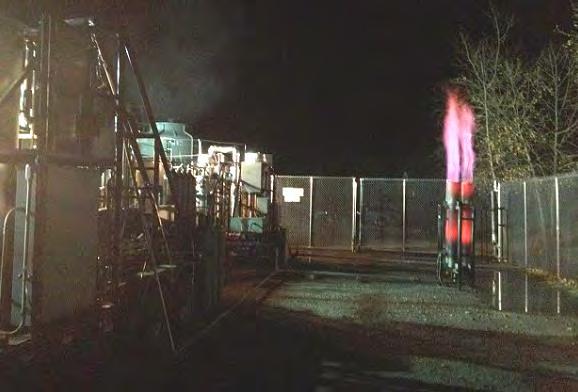
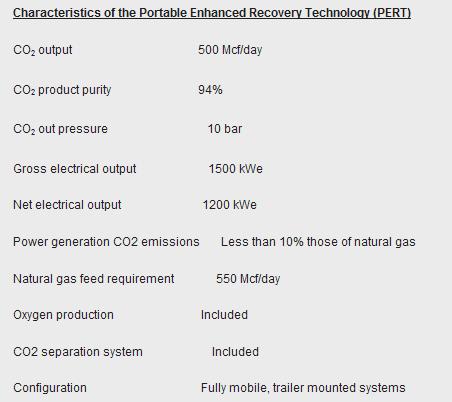
82 Oxy Fuel Concept

83 Rio Bravo Unit Field - Phased-in Pattern Development Gravity Drainage Case CO 2 Injection w/ Nitro Boost
 Additional CO 2 Injection Wells (down-dip) 84")
84 Rio Bravo Field - Phased-in Pattern Development Gravity Drainage Case with addition of Nitro Boost Gravity Drainage Development Plan CO2 Injector Count: 5 Wells N2 Injector Count: 5 Wells Producer Count: 113 Wells Nitro Boost Addition N 2 Injection Wells (up-dip) Additional CO 2 Injection Wells (down-dip) 84
85
 2. Residual Oil Zone (ROZ) (Seminole) 3. Gravity Drainage (Yates Field) 4. Double Displacement (Yates Field) 5.")

86 Recover both Tertiary Oil and Water Eleventh CO 2 Recovery Methods used for Tertiary Oil Recovery in the United States 1. Conventional WAG Recovery (90%+) 2. Residual Oil Zone (ROZ) (Seminole) 3. Gravity Drainage (Yates Field) 4. Double Displacement (Yates Field) 5. Gas Cycling (Denbury, Mississippi). 6. Huff-and-Puff (100+ Projects) 7. Heavy Oil - Calif. (14+ API Gravity) 8. Shale Oil (Bakken) (Under Investigation) 9. Horizontal Well Pattern Development 10. CO 2 Gas Drive w/ Nitro Boost Eleventh CO 2 Recovery Method used for CO 2 Sequestration Enhanced Oil Recovery - EOR Note: Recover both Tertiary Oil and Water
87 Note: This paper, along with my other SPE and CMTC Publications can be down-loaded from my WEB sites listed above.


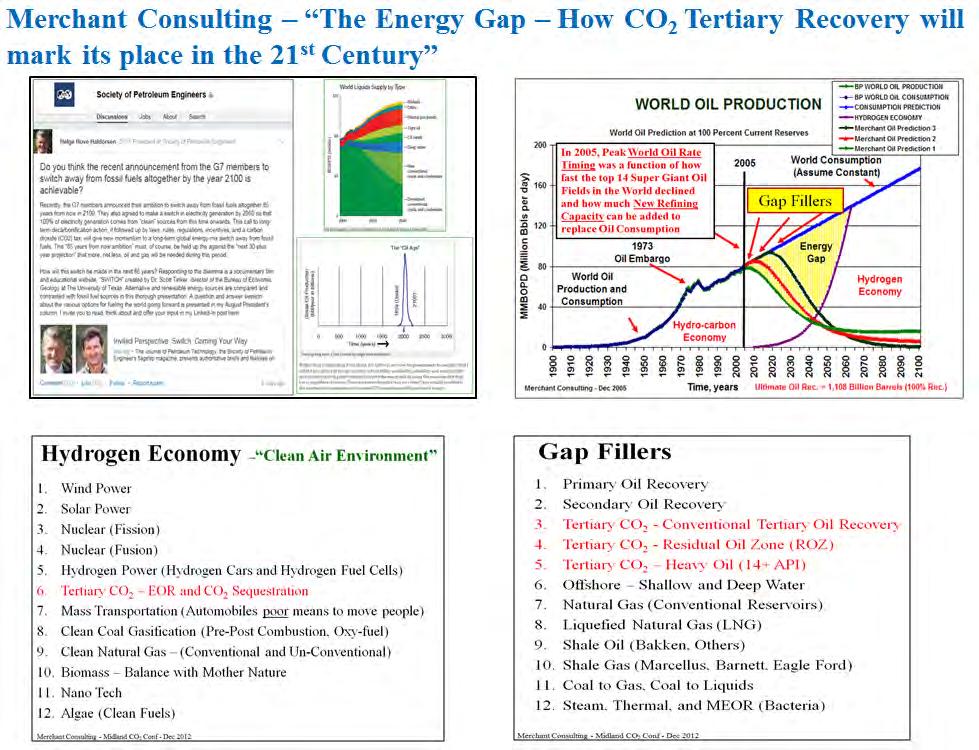
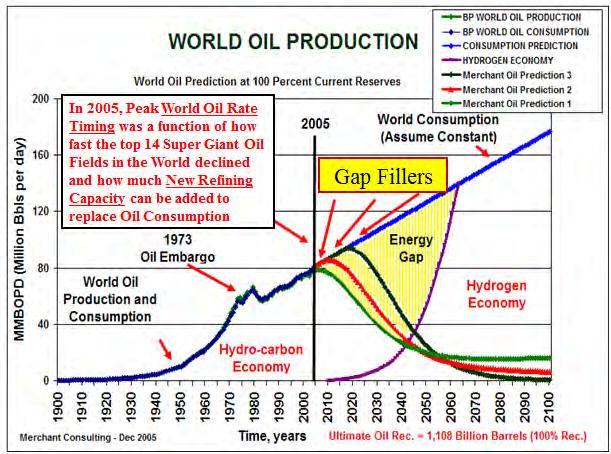
88 Tertiary CO 2 Flooding CO 2 Sequestration Future 2005 In the 21 st Century, CO 2 Sequestration will provide CO 2 from IGCC Natural Gas and Coal Fired Power Plants, Refineries, and other large scale Anthropogenic CO 2 Sources to fill the Energy Gap that exists between Peak Oil and the future Hydrogen Energy Economy.
89
90
91 Gap Fillers 1. Primary Oil Recovery 2. Secondary Oil Recovery 3. Tertiary CO 2 - Conventional Tertiary Oil Recovery 4. Tertiary CO 2 - Residual Oil Zone (ROZ) 5. Tertiary CO 2 Heavy Oil (14+ API) 6. Offshore Shallow and Deep Water 7. Natural Gas (Conventional Reservoirs) 8. Liquefied Natural Gas (LNG) 9. Shale Oil (Wolfcamp, Eagle Ford, Bakken, Others) 10. Shale Gas (Marcellus, Barnett, Eagle Ford) 11. Coal to Gas, Coal to Liquids 12. Steam, Thermal, and MEOR (Bacteria)
92 Hydrogen Economy Clean Air Environment 1. Wind Power 2. Solar Power 3. Nuclear (Fission) 4. Nuclear (Fusion) 5. Hydrogen Power (Hydrogen Cars and Hydrogen Fuel Cells) 6. Tertiary CO 2 EOR and CO 2 Sequestration 7. Mass Transportation (Automobiles poor means to move people) 8. Clean Coal Gasification (Pre-Post Combustion, Oxy-fuel) 9. Clean Natural Gas (Conventional and Un-Conventional) 10. Biomass Balance with Mother Nature 11. Nano Tech 12. Algae (Clean Fuels)
93
 David Merchant (Amoco) Ron Brockmeyer (Amoco)")
94 Merchant Thanks to Steering Committee! 1995 First CO 2 Conference: Talk on: Montage approach to Reservoir Management in Tertiary CO 2 Floods SPE Pictured: Tom McKnight (Union Royalty) David Merchant (Amoco) Ron Brockmeyer (Amoco) Russell Martin (Enron Gas Pipeline) Newspaper Article celebrates CO 2 Injection start-up into the Elmar field along with the CO 2 Conference scheduled for December 4-5, 1995
95 Merchant Thanks to Steering Committee! 1995 Montage approach to Reservoir Management in Tertiary. CO 2 Floods SPE Screening CO 2 Candidate Reservoirs Fundamentals of Pattern Analysis 2000 Setting up the Pieces What Constitutes a Simulation? 2004 Pattern Performance as a Diagnostic Tool for Reservoir Surveillance 2004 Monitoring the CO 2 Flood - Problem Identification and Solutions 2009 Comparisons of Conventional CO 2 WAG Injection Techniques used in the Permian Basin 2010 Life beyond 80 A look at Conventional WAG Recovery beyond 80% HCPV in CO 2 Tertiary Floods SPE The Energy Gap - How CO 2 Tertiary Recovery will mark its place in the 21 st Century 2013 Short Course: Surveillance and Monitoring of CO 2 Injection Projects Pattern Balancing and Mass Balance 2014 Short Course: Produced Water Management for CO 2 Injection Projects Factors in the Permian Basin Subsurface Mass Balance 2015 CMTC Life beyond 80 A look at Conventional WAG Recovery beyond 80% HCPV in CO 2 Tertiary Floods SPE
96 Thanks, Now its your turn? David H. Merchant Merchant Consulting CO 2 Storage Solutions WEB: Key Words: Merchant Consulting, CO2 Storage Solutions, CO2 Seminars on Wheels Magnolia, Texas o