Tracking LEED Performance Metrics at Old Dominion University s Engineering & Computational Sciences Research Laboratory
|
|
|
- Marian Matilda Goodwin
- 5 years ago
- Views:
Transcription
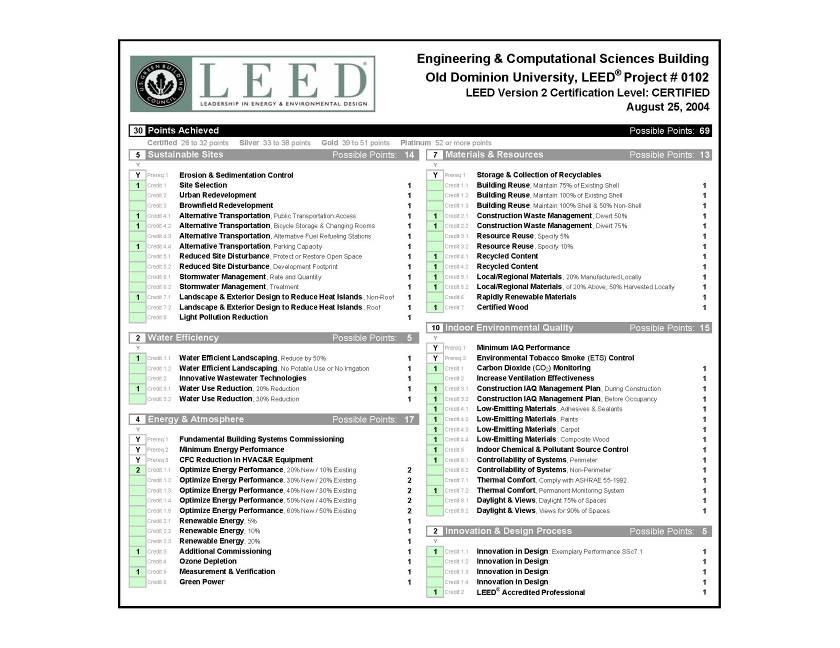
1 Tracking LEED Performance Metrics at Old Dominion University s Engineering & Computational Sciences Research Laboratory Bryna Cosgriff Dunn, LEED ap Moseley Architects Greening Virginia Universities and Colleges September 26, 2006 Harrisonburg, VA
2 Agenda Project Overview Energy Performance Benchmarks Water Performance Benchmark Post Occupancy Survey Lessons Learned


3 Engineering & Computational Sciences Laboratory 21,300 ODU Carnegie Research Extensive University Forbes Cyber University Top Programs Modeling & Simulation Oceanography Nuclear Physics Engineering Management Budget: $11,820,000 Bid: $ 10,522,000 Photo Credit: Steve Maylone
4 Energy costs are a big concern! Utility Costs (FY05) Electric $2,586,473 Natural Gas 663,233 Oil 26,698 Water/Sewer 311,817 Total $3,588,221 Utility Costs/GSF $1.35/GSF
5 Design Goals for E&CS project Construct Flagship for Energy/Water Conservation Improve Indoor Environmental Quality Use Recycled Materials/Construction Waste Mgmt. Create Test Site - Pending Energy Deregulation Build 1st LEED Engineering Lab (HE) in USA Build 1st LEED (HE) Facility in Va
6 WHY LEED? Validation imbedded in process Demonstrates environmental stewardship Example for Virginia higher education Benchmark performance Build support for the future
7

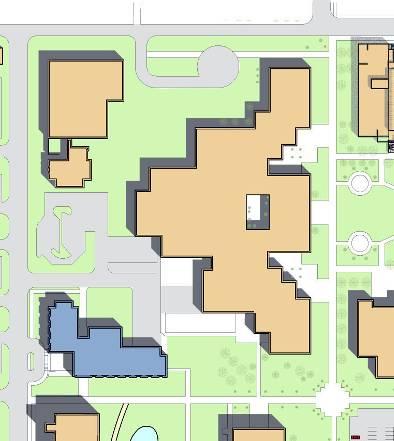
8 Our Site

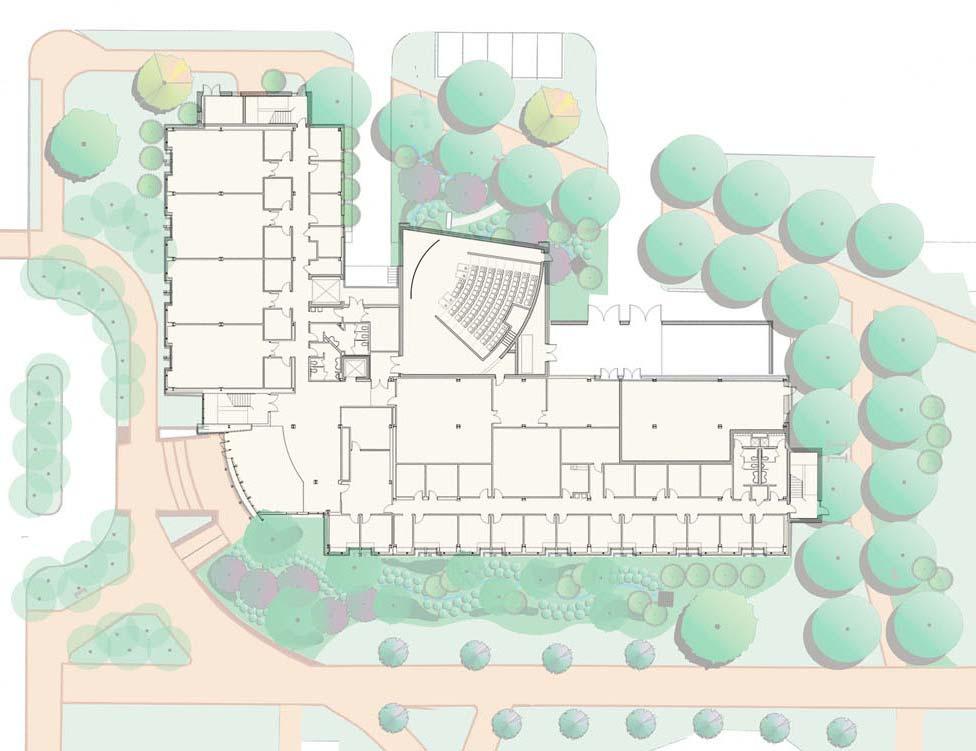
9 Restoration of Open Space BEFORE AFTER

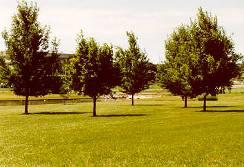

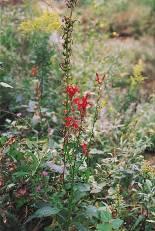
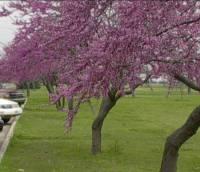
10 Water Efficient Landscaping Red Bud Saw Tooth Oak Cardinal Flower Day Lily
11 Minimize Energy Consumption State of Virginia Building Code required meeting ASHRAE The Engineering and Computational Sciences Building was designed according to ASHRAE Modeled Energy Improvement = 21%
12 Architectural Strategies to Minimize Energy Consumption Building Orientation Daylighting and Sunscreens Low-e glazing Rigid board insulation as exterior wall sheathing Increased insulation in roof (R-38)

13 Shading & Lighting: Solar Shading Screens Photo credit: Steve Maylone


14 Shading & Lighting: Solar Shading Screens INTERIOR LIGHT SHELVES Maximize natural daylighting EXTERIOR WINDOW SHADING Minimize heat gain during cooling season TYPICAL LAB BAY - SECTION TYPICAL LAB BAY - SOUTH ELEVATION


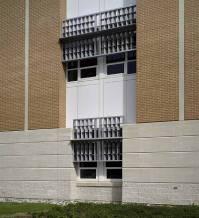
15 Shading & Lighting: Solar Shading Screens West Facing Solar Shading Screens South Facing Solar Shading Screens View of Roof Top Daylight Monitor


16 Shading & Lighting: Solar Shading Screens Light Shelves in Faculty Offices

17 Shading & Lighting: Solar Shading Screens 4 th Floor OCCS Office incorporating Natural Top Lighting
18 Mechanical Strategies to Minimize Energy Consumption Energy recovery devices ( heat wheels ) at airhandling units Multiple zones per floor Demonstration geothermal system for auditorium Occupancy sensors for lighting Carbon dioxide monitors


19 Minimize Energy Consumption 4th Floor University Data Center Demonstration/Visualization Auditorium incorporating Geothermal System
20 Measurement & Verification Plan To ensure that energy savings are actually realized at this facility, a long-term monitoring and verification infrastructure has been established to monitor the following: Lighting systems and controls Constant and variable motor loads Variable frequency drive operation Chiller efficiency at variable loads Cooling load Air and water economizer and heat recovery cycles Boiler efficiencies Building specific process energy efficiency systems Indoor water risers and outdoor irrigation systems
21 Construction Indoor Air Quality (IAQ) Management Material and equipment protection Source control Pathway interruption Housekeeping during construction Scheduling of materials installation Testing of IAQ after construction
22 Low Emitting Materials Adhesives met the VOC limits of the South Coast Air Quality Management District Rule #1168 Sealants met the Bay Area Air Resources Board Regulation 8 Rule 51 Paints met the VOC and chemical component limits of the applicable Green Seal standard Carpets met the Carpet and Rug Institute Green Label Indoor Air Quality Test Program Composite Wood Products contained no added urea-formaldehyde resins


23 Operable Windows One operable window and one lighting control zone per every 200 square feet for all perimeter spaces
24 Energy Performance Benchmarks ASHRAE BASE CASE LEED DESIGN CASE ODU Campus Energy Use LABS 21 Data Occupant IEQ Survey (CBE)
25 Benchmarking Ground Rules CRAC/Data Center Process Loads Extracted (per LEED criteria) from: ASHRAE Base Case LEED Design Case Actual Building Performance Actual Performance Does Not Take Advantage of Nighttime Setback Savings Initial Year of Operation/Addressing Warranty Issues
26 Benchmark: Models versus Actual Energy Performance 450, , , ,000 ASHRAE kwh 250, ,000 LEED Model 150, ,000 Actuals 50,000 0 Sep-04 Nov-04 Jan-05 Mar-05 May-05 Jul-05 Sep-05 Nov-05 Jan-06 Mar-06 Summer Peak Ongoing Research Programs + Not Utilizing Nighttime Setback w/crac Process Loads

27 Benchmark: Models versus Actual Summer Peak Ongoing Research Programs + Not Utilizing Nighttime Setback w/o CRAC Process Loads
28 Out Performing LEED Base-case Model 1. Energy recovery devices ( heat wheels ) at air-handling units 2. Multiple zones per floor 3. Demonstration geothermal system for auditorium 4. Occupancy sensors for lighting 5. Carbon dioxide monitors
29 Benchmark: Actual versus Campus Energy Use kwh/gsf E&CS LEED Design LEED Case ASHRAE ASHRAE Base Case Campus Avg.
30 Benchmark: LABS21 Labs21 is a voluntary partnership program dedicated to improving the environmental performance of U.S. laboratories. Carnegie Mellon University Cornell University Duke University Fred Hutchinson Cancer Research Center Harvard University North Carolina A&T State University Northern Arizona University Sierra Nevada College Sonoma State University Stanford University University of California-Davis University of California-Merced University of Colorado at Boulder University of Hawaii University of North Carolina-Asheville University of Rochester Wright State University

31 LABS 21 Energy Climate Zones

32 LABS 21 Energy Benchmark Data Table Region 4

33 LABS 21 Zone 4 Laboratories

34 LABS 21 *Zone 4 & National Laboratories

35 Benchmark: Water consumption

36 PERFORMANCE VS. LEED PREMIUM Positive bid environment in 2003 Project $1.0 M +/- under budget No quantifiable bid premium for LEED Basic Certification Level Capital E Report December % - 2.5% Davis Langdon Report July 2004, 0% - 3%
37 Occupant Satisfaction Data Collection OBJECTIVE Study the performance of green and LEED-certified buildings in comparison to conventional buildings, in terms of occupant satisfaction with indoor environmental quality (IEQ). BACKGROUND This database contains survey responses from over 200 buildings and 35,000 individual occupants, making it a useful measure for studying building performance. The survey consists of a set of core questions to assess occupant satisfaction with four main IEQ factors in the workspace thermal comfort, lighting, air quality, and acoustics. The survey relies directly on occupants to obtain feedback about how they feel about their IEQ conditions in their space, and how it affects their effectiveness.

38 About the CBE database
39 Who are our occupants? Worked in building 1-2 years 91% Worked in present workspace more than 1 year Spend more than 30 hours/week in personal workspace Aged Aged 50+ Gender: Male Gender: Female 93% 73% 52% 36% 70% 30%
40 What work do our occupants do? Administrative Support 4% Technical 32% Professional 34% Managerial/Supervisory 19% Other 9%
41 What departments are our respondents in? Aerospace 4% VMASC 4% Computer Science 21% Math and Statistics 25% Facilities and Maintenance 12% Communication/Computing Svcs 35%

42 Benchmark: Occupant Satisfaction
43 LESSONS LEARNED Understand potentials/limitations of construction delivery method Establish construction schedule duration to accommodate commissioning/iaq testing M&V infrastructure is a powerful tool for improving building energy performance Ensure programming of performance reports is complete before project close-out Incorporate nighttime setback mode Submeter large isolated uses like the CRAC load Use actual consumption as new base line to monitor future building energy performance
44 LESSONS LEARNED Post Occupancy Survey has identified several technical issues for follow up Occupancy Sensors OCCS Open Office Acoustics Issues Data Center/Computer Science Server Room CRAC Units Target LEED points that are compatible w/programmatic use 2 nd Occupancy Survey is critical to understand building performance


45 Virginia Resources National Capital Region Chapter James River Green Building Council Southwest Virginia Chapter Virginia Sustainable Building Network
46 Tracking LEED Performance Metrics at Old Dominion University s Engineering & Computational Sciences Research Laboratory Bryna Cosgriff Dunn, LEED ap Moseley Architects Greening Virginia Universities and Colleges September 26, 2006 Harrisonburg, VA