Background to Research Leading to Development of Upflow Filtration
|
|
|
- Madlyn Oliver
- 5 years ago
- Views:
Transcription

1 Uday Khambhammettu Metcalf & Eddy, Inc. San Diego, CA Background to Research Leading to Development of Upflow Filtration Lisa Glennon Hydro International, Inc. Portland, ME Robert Pitt Department of Civil, Construction, and Environmental Engineering University of Alabama, Tuscaloosa, AL


2 Critical source area controls are important components of a comprehensive stormwater management program Pollution prevention, outfall controls, better site design, etc., are usually also needed In contaminated areas, infiltration should only be used cautiously, after pretreatment to minimize groundwater contamination


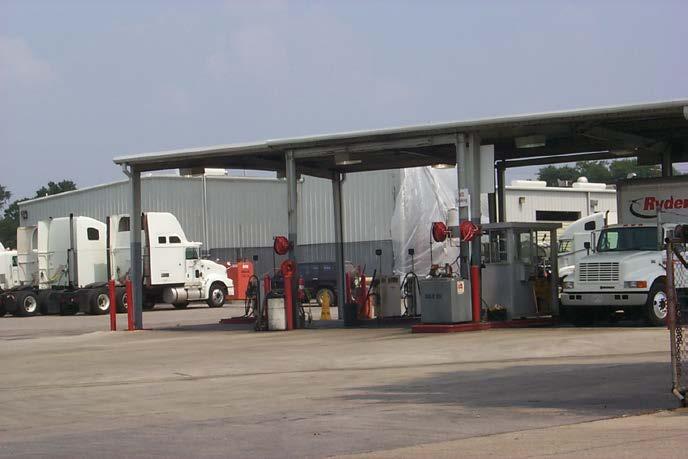
3 Large parking areas, convenience stores, and vehicle maintenance facilities are usually considered critical source areas.


4 Storage yards, auto junk yards, and lumber yards


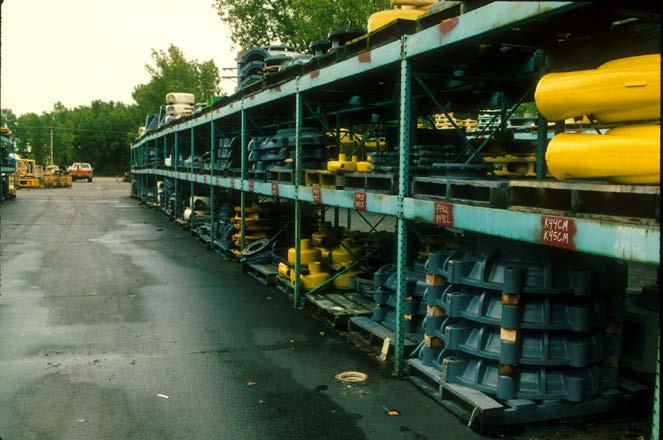
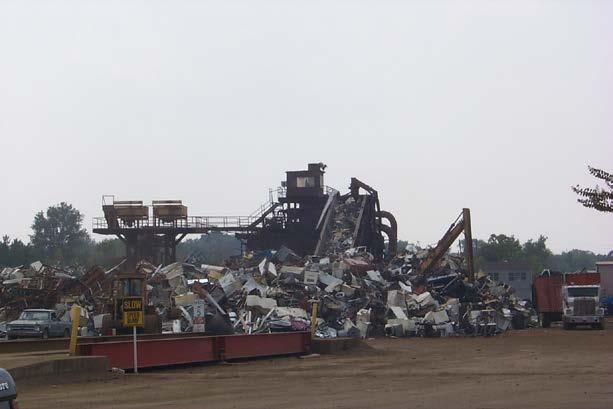
5 along with industrial storage areas, loading docks, refueling areas, and manufacturing sites.
6 Measured Particle Sizes, Including Bed Load Component, at Monroe St. Detention Pond, Madison, WI
7 Need to remove very small particles for high levels of stormwater control
8 High levels of pollutant reduction require the capture of very fine particulates, and likely further capture of dissolved pollutant fractions.
9 Filtered Sample Ionic and Colloidal Associations Analyte % Ionic % Colloidal Magnesium Calcium Zinc Iron 97 3 Chromium Potassium Lead Copper Cadmium Most of the dissolved stormwater metals are in ionic forms and are therefore potentially amenable to sorption and ion-exchange removal processes.
10 Development of Stormwater Control Devices using Media Multiple treatment processes can be incorporated into stormwater treatment units sized for various applications. Gross solids and floatables control (screening) Capture of fine solids (settling or filtration) Control of targeted dissolved pollutants (sorption/ion exchange)

11 Pilot-Scale Treatment Tests using Filtration, Carbon Adsorption, UV Disinfection, and Aeration

12 Pilot-scale filters examining many different media.

13 Lab and pilot-scale filters and multichambered treatment train (MCTT)
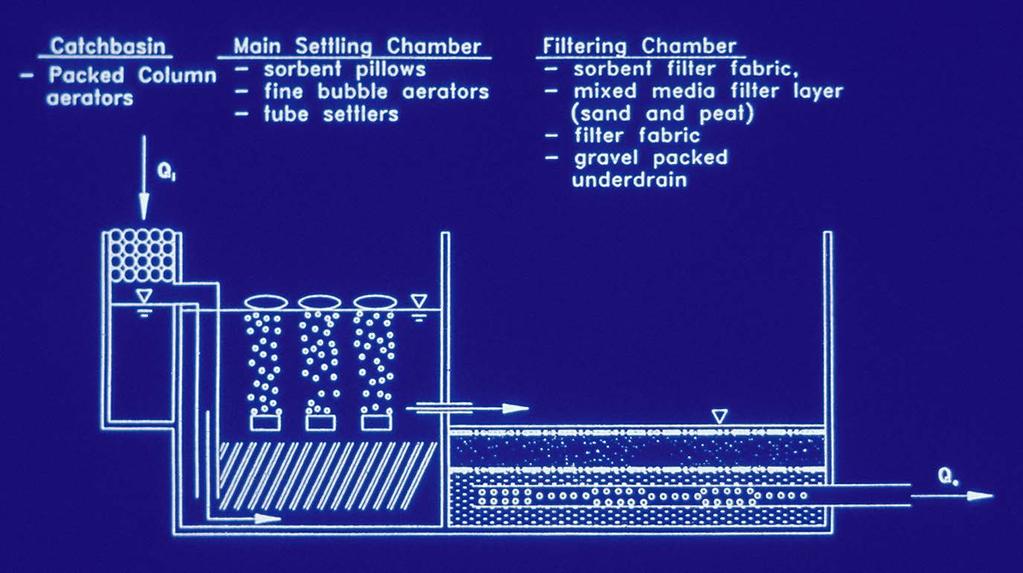
14 MCTT Cross-Section

15 Pilot-Scale Test Results for SS

16 Pilot-Scale Test Results for Zn


17 Milwaukee, WI, Ruby Garage Public Works Maintenance Yard MCTT Site

18 Minocqua, WI, MCTT Installation


19
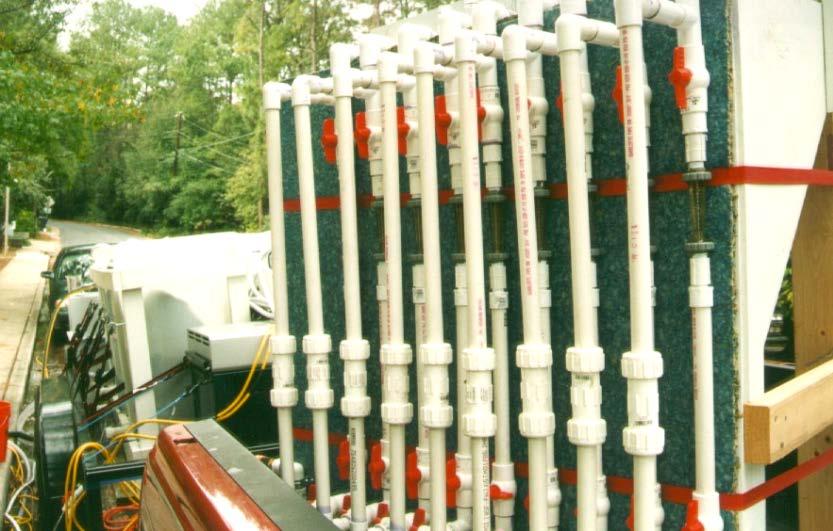
20 Wisconsin Full-Scale MCTT Test Results (median % reductions and median effluent quality) Milwaukee (15 events) Minocqua (7 events) Suspended Solids 98 (<5 mg/l) 85 (10 mg/l) Phosphorus 88 (0.02 mg/l) >80 (<0.1 mg/l) Copper 90 (3 µg/l) 65 (15 µg/l) Lead 96 (1.8 µg/l) nd (<3 µg/l) Zinc 91 (<20 µg/l) 90 (15 µg/l) Benzo (b) fluoranthene >95 (<0.1 µg/l) >75 <0.1 µg/l) Phenanthrene 99 (<0.05 µg/l) >65 (<0.2 µg/l) Pyrene 98 (<0.05 µg/l) >75 (<0.2 µg/l)
21 Water Environment Research Foundation (WERF) project on Metals Removal from Stormwater Main Project Goals: Contribute to the science of metals capture from urban runoff by filter media and grass swales. Provide guidelines to enhance the design of filters and swales for metals capture from urban runoff. Media Filtration Goals: Characterize physical properties Assess & quantify ability of media to capture metals Rank media & select media for in-depth study Evaluate effect of varying conditions on rate and extent of capture Laboratory- and pilot-scale studies of pollutant removal Disposal issues of used media (using TCLP)
22 Treatment Media Examined during WERF Study Traditional Media Ion Exchange Resin Granular activated carbon (GAC) Sand Metals Examined - Copper, Cadmium, Chromium, Zinc, Lead, and Iron Other Low Cost (disposable) media Compost 2 Zeolites Iron Oxide Coated Sand Agrofiber Cotton Mill Waste Peat-Sand Mix Kudzu Peanut Hull Pellets
")


23 Laboratory Media Studies Rate and Extent of Metals Capture Capacities (partitioning) Kinetics (rate of uptake) Effect of ph & ph changes due to media, particle size, interfering ions, etc Packed bed filter studies Physical properties and surface area determinations
24 Cation Exchange Capacities for Different Media CEC (meq/100 g) Peat Moss 22 Compost 19 Activated Carbon 5.4 Zeolite 6.9 Cotton Waste 3.8 Agrofiber 9.4 Sand 3.5

25 Contaminant Losses during Anaerobic vs. Aerobic Conditions between Events

26

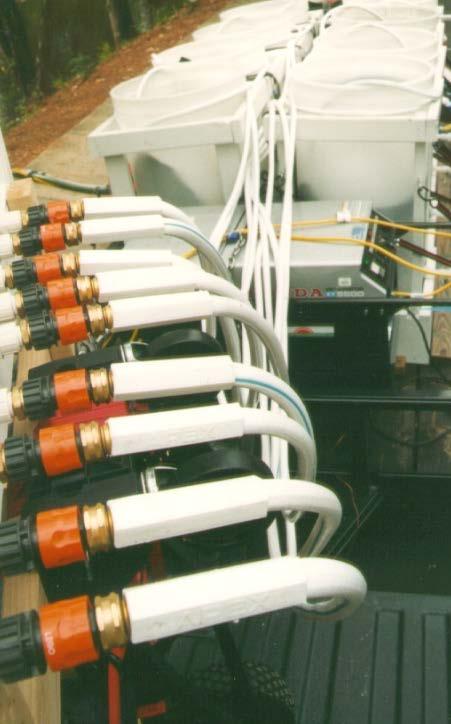
27 Pilot-Scale Downflow Filtration Setup Media Investigated: Activated Carbon Zeolite Sand Lightweight Sand Loamy Soil Municipal Leaf Compost Peat Moss Kenaf Fiber Cotton Textile Waste
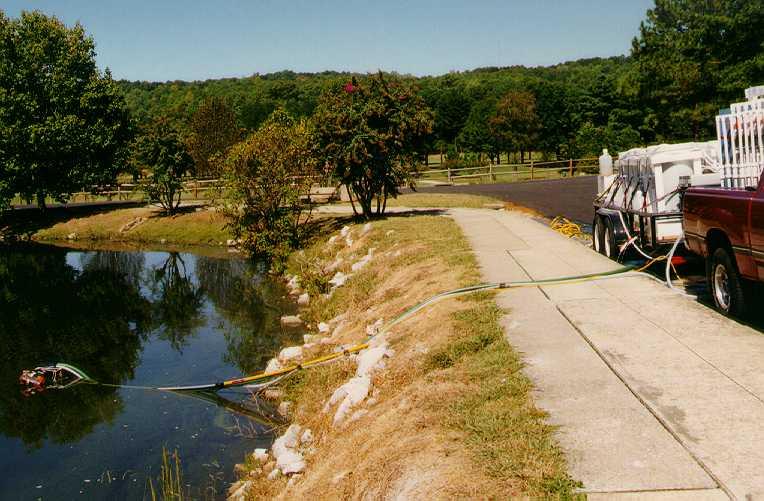

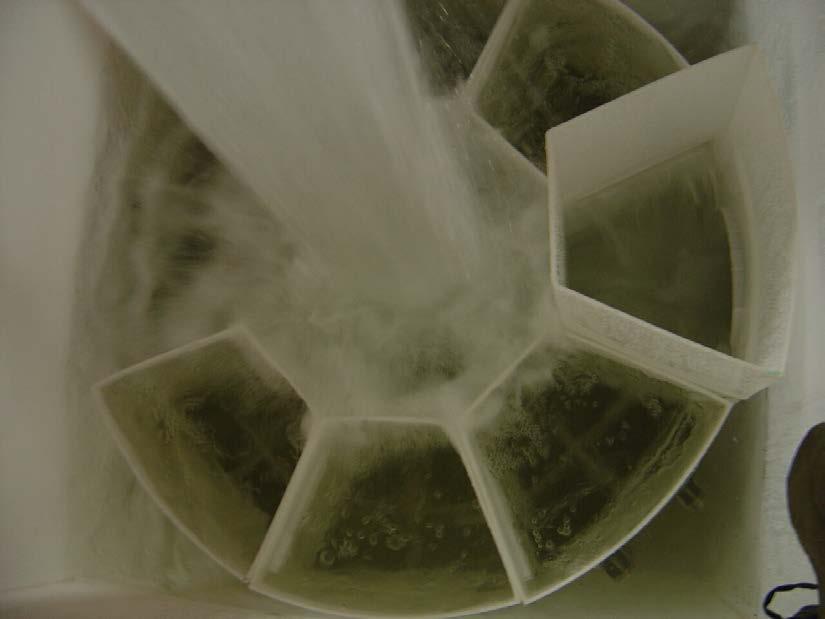
28 Pilot-Scale Filtration Setup after Pre-Treatment by Stormwater Pond
29
30 Clogging Problems Originally Addressed by Pre- Treatment. What about Upflow Filtration? Expected Advantages: Reduced Clogging: Sump collects large fraction of sediment load. Prolonged Life: Particles trapped on the surface of the media will fall into the sump during quiescent periods. High Flow Rates: Since large and heavy solids will be removed by way of settling in the sump prior to encountering the filter, the filters can be operated at higher flow rates. Upflow Filter Design with Sump No sump With sump

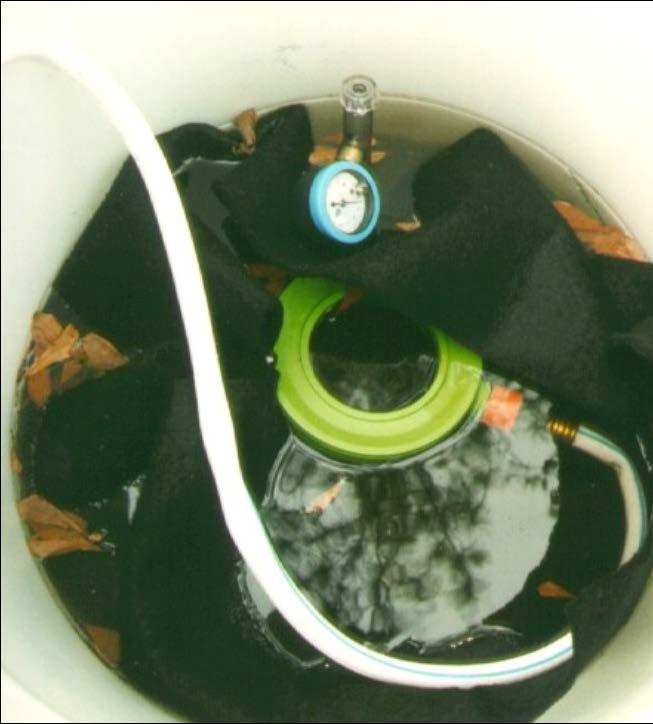
31 Upflow Filters for Metals Removal Particulate Solids: Good removal (>90%) for all media for all runs. Particulate Metals: Generally % removal for Pb, Zn, Cd, and Fe and 60-95% removal for Cu and Cr. Peat had the best removal rates for particulate bound metals. Removal rates of compost and zeolite were about the same. Sump Pressure gage
32 Upflow filter insert for catchbasins Main features of the MCTT can be used in smaller units. The Upflow Filter TM uses sedimentation (22), gross solids and floatables screening (28), moderate to fine solids capture (34 and 24), and sorption/ion exchange of targeted pollutants (24 and 26). Upflow Filter TM patented
33 Successful flow tests using prototype unit and mixed media as part of EPA SBIR phase 1 project (controlled lab tests). Phase 2 tests recently completed (field tests), and ETV testing now starting Flow (gpm) to 90% removal of dissolved zinc using sand/peat upflow filtration Headloss (inches) % Removal Residence Time, minutes Series1 Series2 Series3 15 to 20 gpm/ft 2 obtained for most media tested


34 Test site drainage area, Tuscaloosa, AL (anodized aluminum roof, concrete and asphalt parking areas; total of 0.9 acres)

35


36 EPA SBIR2 UpFlow TM Filter tests using Frankenstein 2 prototype


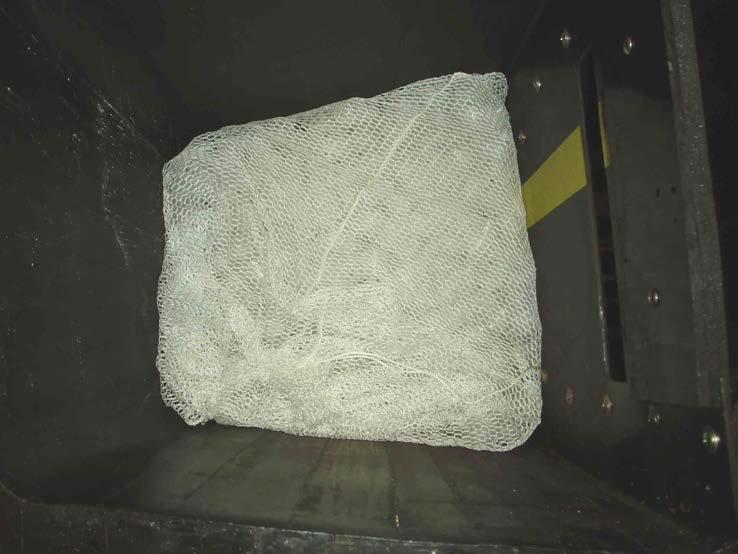
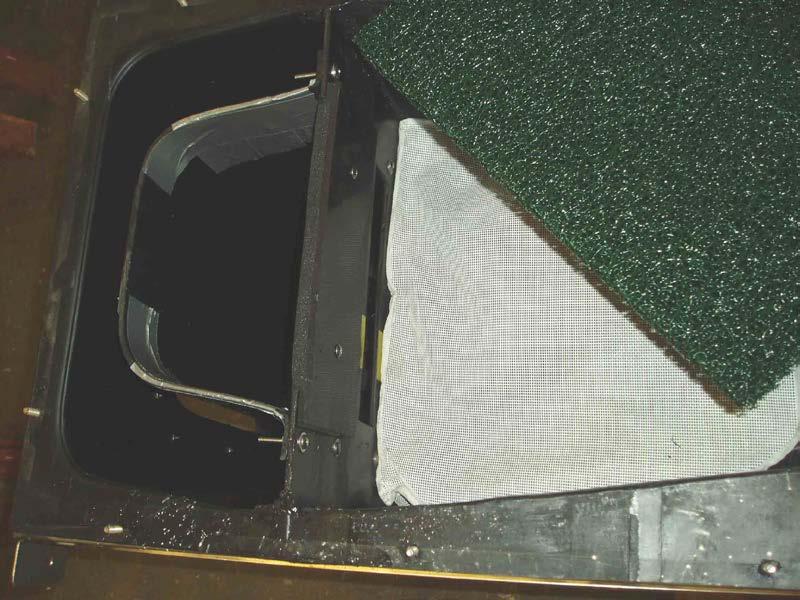
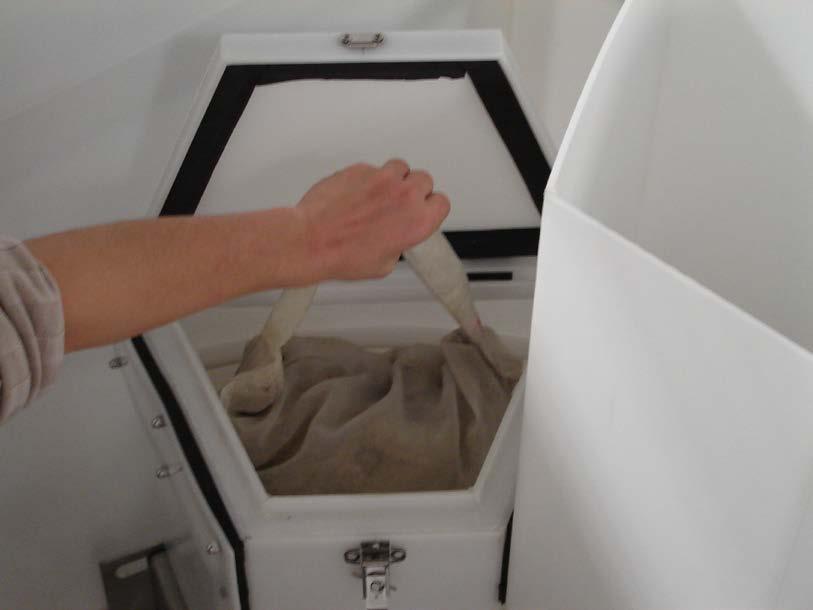
37 Support material and media

38 EPA-funded SBIR2 Field Test Site Monitoring Equipment, Tuscaloosa, AL
 for bypass")
39 Flow tests (300 gpm) for bypass capacity
40 Treatment Flow Rates for Mixed Media
41 Performance Plot for Mixed Media on Suspended Soilds for Influent Concentrations of 500 mg/l, 250mg/L, 100 mg/l and 50 mg/l 600 High Flow 500 Suspended Soilds (mg/l) Mid Flow 500 Low Flow 500 High Flow 250 Mid Flow 250 Low Flow 250 High Flow 100 Mid Flow 100 Low Flow 100 High Flow 50 Mid Flow 50 0 Influent Conc. Effluent Conc. Low Flow 50
42 Suspended Solids Removal Tests Media (each bag) Flow (gpm) Influent SS Conc. (mg/l) Average Effluent SS Conc. (mg/l) % SS reduc. Zeo+ Zeo High (21) Zeo+ Zeo Mid (10) Zeo+ Zeo Low (6.3) Mix + Mix High (27) Mix + Mix Mid (15) Mix + Mix Low (5.8) Zeo: Manganese-coated zeolite Mix: 45% Mn-Z, 45% bone char, 10% peat moss
43 Upflow Filter Mixed Media Tests (Mn-coated Zeolite, Bone Char, Peat Moss) Performance Plot for Particle Size Distributions % Finer Particle Size (um) Influent PSD 50 mg/l High Flow 50 mg/l Mid Flow 50 mg/l Low Flow 100 mg/l High Flow 100 mg/l Mid Flow 100 mg/l Low Flow 250 mg/l High Flow 250 mg/l Mid Flow 250 mg/l Low Flow 500 mg/l High Flow 500 mg/l Mid Flow 500 mg/l Low Flow
44 % Reductions concentration in particle size range (mg/l): 0 to 0.45 µm (TDS) 350 m/day (or less) 760 m/day 1200 m/day (to overflow) 69 (and smaller) (and larger) to 3 µm 2.1 (and smaller) (and larger) to 120 µm 4.4 (and smaller) (and larger)
45 Probability Plot of Concentration for Particle Range um Normal Probability Plot of Concentration for Particle Range um Normal Percent Variable Influent (mg/l) Effluent (mg/l) Mean StDev N AD P Percent Variable Influent (mg/l)_1 Effluent (mg/l)_1 Mean StDev N AD P mg/l mg/l Probability Plot of Concentration for Particle Range um Normal Probability Plot of Concentration for Particle Range >240 um Normal Percent Variable Influent (mg/l)_6 Effluent (mg/l)_6 Mean StDev N AD P <0.005 Percent Variable Influent (mg/l)_8 Effluent (mg/l)_8 Mean StDev N AD P * * 12 * mg/l mg/l
46 August 29, 2005 Hurricane Katrina Rainfall and Runoff and Sampling Periods
47 Treatment Flow Rate Changes during 10 Month Monitoring Period
48 Treatment Flow Rates needed for Seattle, WA
49 Treatment Flow Rates needed for Atlanta, GA
50 70 to 90% SS reductions for influent concentrations >80 mg/l 100 % Reduction Influent Suspended Solids (mg/l)
51 Effluent SS <100 mg/l whenever influent is <500 mg/l 1000 Effluent Suspended Solids (mg/l) Influent Suspended Solids (mg/l)
52 Particulate Solids Removal by Particle Size, during Monitoring Period (UpFlow Filter, with Sump)
53 COD and phosphorus concentrations as a function of particle size
54 Copper and zinc concentrations as a function of particle size
55

56 UpFlow Filter 1 Components: 1. Access Port 2. Filter Module Cap 3. Filter Module 4. Module Support 5. Coarse Screen 6. Outlet Module 7. Floatables Baffle/Bypass Hydro International, Ltd

57 Upflow Filter Components Module Cap/Media Restraint and Upper Flow Collection Chamber 2. Conveyance Slot 3. Flow-distributing Media 4. Filter Media 5. Coarse Screen 6. Filter Module Hydro International, Ltd


58 Hydraulic Characterization High flow tests Assembling Upflow Filter modules for lab tests Hydro International, Ltd. Initial CFD Model Results


59


60 Operation during normal and bypass conditions


61 Draindown between events ETV test setup at Penn State - Harrisburg

62 Upflow Filter can be evaluated in WinSLAMM
63 Conclusions The bench-scale treatability tests conducted during the development of the MCTT showed that a treatment train was needed to provide redundancy because of frequent variability in sample treatability storm to storm, even for a single sampling site. Possible to develop other stormwater controls that provide treatment train approach. Upflow filtration with a sump and interevent drainage provided the best combination of pre-treatment options and high flow capacity, along with sustained high contaminant removal rates.
64 Constituent and units Conclusions (continued) Reported irreducible concentrations (conventional highlevel stormwater treatment) Particulate solids 10 to 45 <5 to 10 (mg/l) Phosphorus 0.2 to to 0.1 (mg/l) TKN (mg/l) 0.9 to Cadmium (µg/l) Copper (µg/l) 15 3 to 15 Lead (µg/l) 12 3 to 15 Zinc (µg/l) 37 <20 Effluent concentrations with treatment train using sedimentation along with sorption/ion exchange
65 Selected References Barrett, M. Performance Summary Report for the Multi- Chambered Treatment Trains. Prepared for the California Department of Transportation. May Clark, S., R. Pitt, and R. Raghavan. SBIR Phase 1 report for Upflow Filtration Treatment of Stormwater. U.S. EPA. Publication pending Corsi, S.R., S.R. Greb, R.T. Bannerman, and R.E. Pitt. Evaluation of the Multi-Chambered Treatment Train, a Retrofit Water Quality Management Practice. U.S. Geological Survey. Open-File Report Middleton, Wisconsin. 24 pgs Johnson, P., R. Pitt, S. Clark, M. Urritta, and R. Durrans. Innovative Metal Removal for Stormwater Treatment. Water Environment Research Foundation. Publication pending Pitt, R., B. Robertson, P. Barron, A. Ayyoubi, and S. Clark. Stormwater Treatment at Critical Areas: The Multi-Chambered Treatment Train (MCTT). U.S. Environmental Protection Agency, Wet Weather Flow Management Program, National Risk Management Research Laboratory. EPA/600/R-99/017. Cincinnati, Ohio. 505 pgs. March 1999.
66 Acknowledgements WERF Project 97-IRM-2 Project Manager: Jeff Moeller U.S. EPA Small Business Innovative Research Program (SBIR1 and SBIR2 plus ETV testing) Project Officer: Richard Field Many graduate students at the University of Alabama and Penn State-Harrisburg Industrial Partners (US Infrastructure and Hydro International)