2040 MTP Information Session Transportation Alternatives Analysis
|
|
|
- Gloria Briggs
- 5 years ago
- Views:
Transcription
1 2040 MTP Information Session Transportation Alternatives Analysis


2 2040 Metropolitan Transportation Plan TP? a guide for major transportation investments 59,313

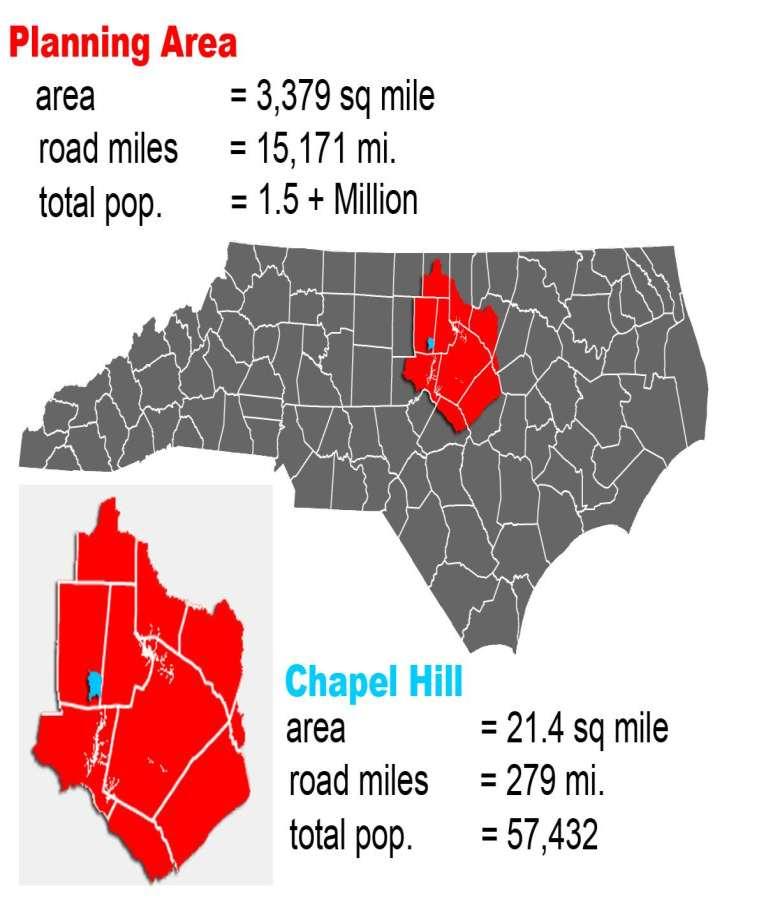
3 MPO Planning Boundaries
4 About the MPO DCHC-MPO is a regional planning body responsible for Transportation Planning in Durham, Orange, and parts of Chatham County FEDERAL MANDATE MPO must plan use of federal transportation funding Policy Board -- Transportation Advisory Committee (TAC) composed mostly of local elected officials.
5 Why are MTP s done? Maintain our transportation infrastructure Roads Bike-Ped Transit Predict future travel/infrastructure needs Roads Bike-Ped Transit Meet Federal Requirements


6 The Metropolitan Transportation Plan is fiscally constrained.
7 Transportation Funding State and Federal Transportation Funds DCHC MPO Chapel Hill Carrboro Hillsborough Durham Orange Co.

8 Projects must be in the MTP in order to receive state and federal transportation funding
9 MTP: A Frequently Updated Plan 1 MPO COORDINATION 2 LOCAL INPUT 3 PUBLIC REVIEW MTP * MTP s are updated every 4 years
10 MTP PROCESS October APPROVAL AIR QUALITY we are here DRAFT MTP PREFERRED OPTION ALTERNATIVES ANALYSIS DEFICIENCY ANALYSIS SE DATA..aka PROJECTIONS GOALS AND OBJECTIVES
11 GOALS AND OBJECTIVES..guide the Metropolitan Transportation Plan Overall System Public Transit Environmental Protection Social System Protection Bike-Ped Land Use Public Involvement Safety & Security Freight & Urban Goods
12 SE DATA..aka PROJECTIONS used to help estimate future transportation conditions 1) Projections are used as an input in a regional transportation computer model 2) Growth projections are developed state agencies and MPO (population & employment) 3) growth projections are assigned to Traffic Analysis Zones based on local input.

13 How are projections developed?. using official estimates from the State Demographer and Employment security Commission

14 Orange County NC

15 Traffic Analysis Zones (TAZ)

16 TAZ s with Land Use Modeling Grid

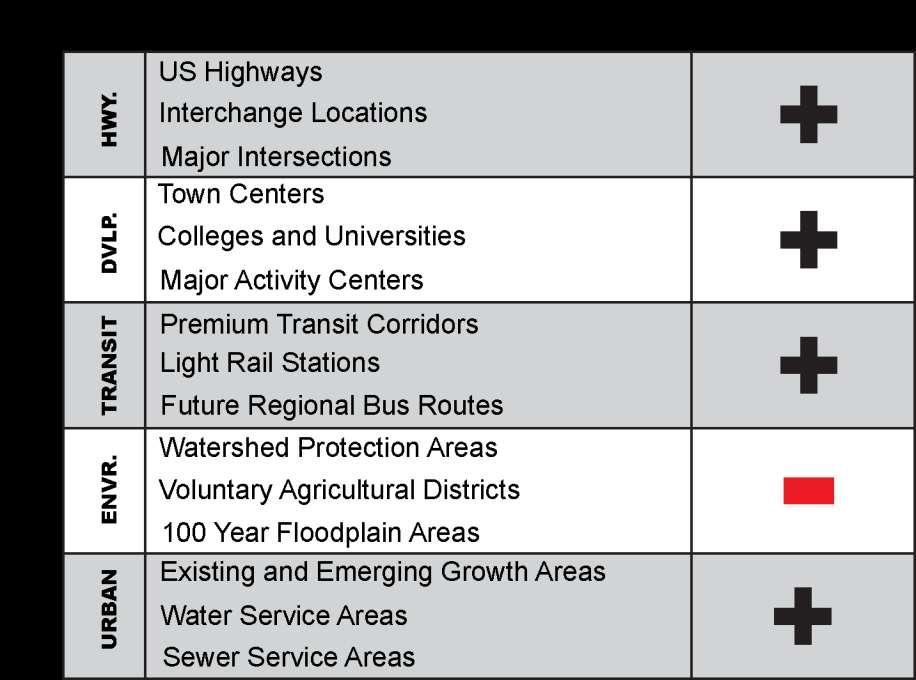
17 Suitability Analysis EFFECT Water and Sewer +


18 Suitability Analysis EFFECT Watershed Protection Areas -
19
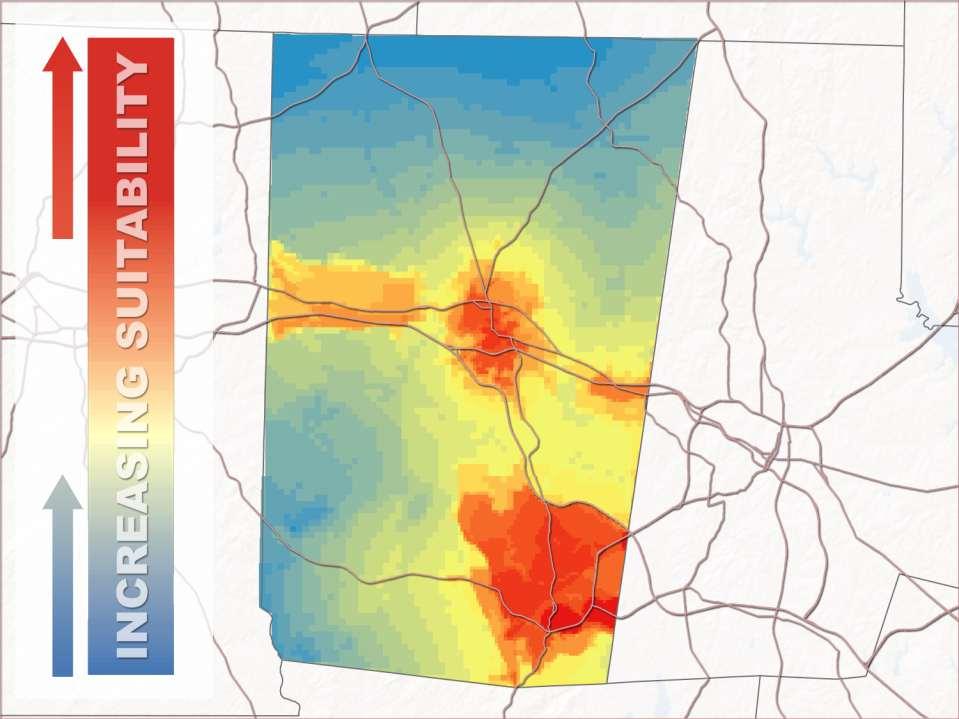


20 Highest Suitability score for Orange County.
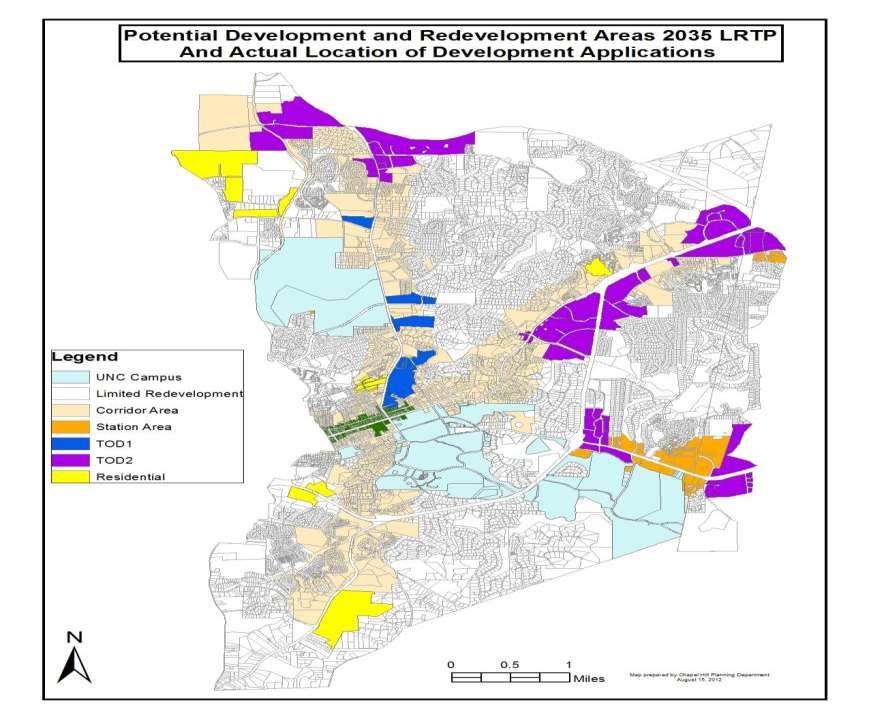
21 Transp. Network SE Data ALTERNATIVES ANALYSIS COMM PLAN *Pop = 85k *Emp = 72k COMM PLAN *Pop = 85k *Emp = 72k COMM PLAN *Pop = 85k *Emp = 72k TRANSIT INTENSIVE *Pop = 87k *Emp = 68k E+C Hwy. Intensive Moderate Transit Intensive *These figures are draft estimates for total population and employment within Chapel Hill s jurisdiction used for the 2040 MTP.

22 Community Plans Alternative: Dwellings COMM PLAN *Pop = 85k *Emp = 72k

23 Transit Intensive Alternative: Dwellings TRANSIT INTENSIVE *Pop = 87k *Emp = 68k

24 Community Plans Alternative: Employment COMM PLAN *Pop = 85k *Emp = 72k

25 Transit Intensive Alternative: Employment TRANSIT INTENSIVE *Pop = 87k *Emp = 68k

26 SE DATA Alternative Community Plans 2040 Pop. Guide Total = 195,124 Pop. Per Dwelling Unit = 2.5 Persons
27 SE DATA Alternative Community Plans 2040 Employment Guide Total = 99,515
28 SE DATA Alternative Transit Intensive 2040 Pop. Guide Total = 195,124 Pop. Per Dwelling Unit = 2.5 Persons
29 SE DATA Alternative Transit Intensive 2040 Employment Guide Total = 99,515


30
31 SE Data Alternatives: Share by Jurisdiction Population 2010 Base Total 34% 9% 18% 39% 2040s (Comm. Plans) 13% 2040 (Transit Intensive) 13% 41% 35% 41% 35% 11% 10% Carrboro Chapel Hill Hillsborough Orange Co.
32 Carrboro Chapel Hill Hillsborough Orange Co. SE Data Alternatives: Share by Jurisdiction Employment 12% 2010 Base Total 11% 8% 69% 2040 (Comm. Plans) 11% 6% 16% 66% 2040 (Transit Intensive) 12% 6% 14% 68%
33 Chapel Hill 2040 Totals: SE Data Scenarios Community Plans Scenario Transit Intensive Scenario COMM PLAN Pop = 85k Emp = 72k TRANSIT INTENSIVE Pop = 87k Emp = 72k SE Data Links
34 Transp. Network SE Data ALTERNATIVES ANALYSIS COMM PLAN *Pop = 85k *Emp = 72k COMM PLAN *Pop = 85k *Emp = 72k COMM PLAN *Pop = 85k *Emp = 72k TRANSIT INTENSIVE *Pop = 87k *Emp = 68k E+C Hwy. Intensive Moderate Transit Intensive *These figures are draft estimates for total population and employment within Chapel Hill s jurisdiction used for the 2040 MTP.
35 Transportation Network Alternatives ALTERNATIVE E+C Existing plus committed projects. NO LIGHT RAIL. ALTERNATIVE Hwy. Intensive New roads and widening projects. Current bus transit No bus transit improvements from the county plans No rail transit
36 ALTERNATIVE Moderate ALTERNATIVE Transit Intensive Current bus transit Bus transit improvements in county plans Light rail and regional rail (based on Locally Preferred Alternative) MLK Blvd Bus Rapid Transit (BRT) in Chapel Hill. An aspirational transit network Current bus transit Bus transit improvements in County Plans Light rail between Durham and Wake counties Light rail and regional rail extensions in Orange County CRT addition between Cary and western RTP Five Bus Rapid Transit (BRT) projects in Chapel Hill

37 ALTERNATIVE Moderate POP EMP
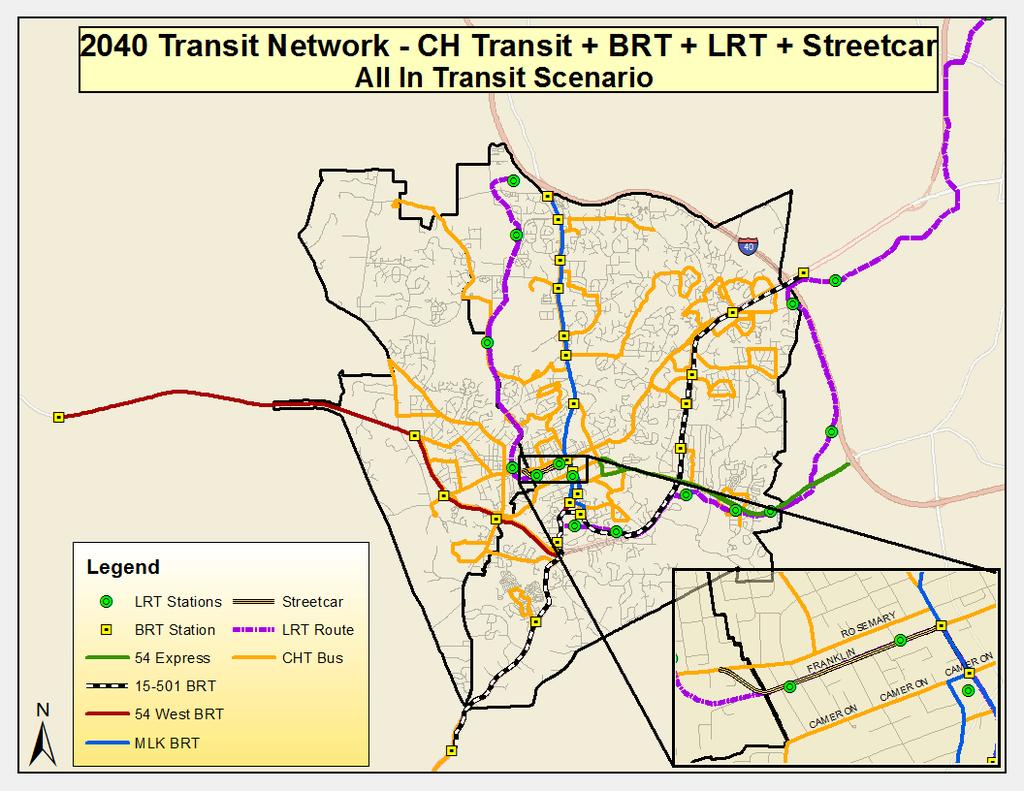


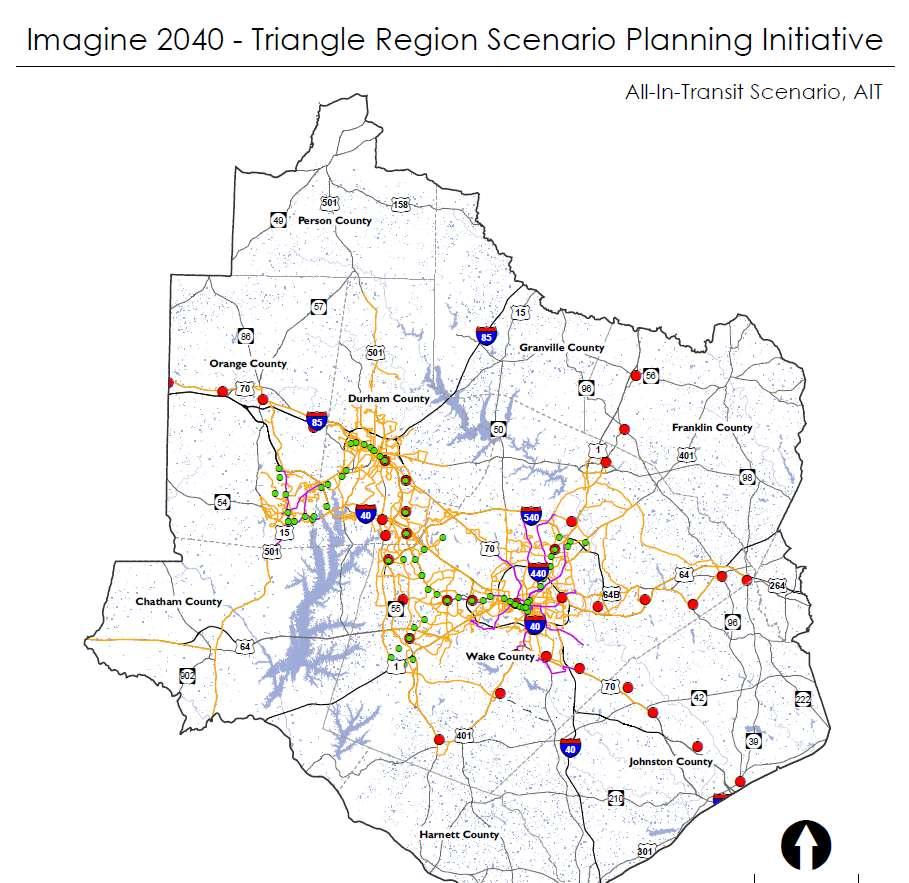
38 ALTERNATIVE Transit Intensive
39
40 Detailed Info: Transportation Alternatives Highway Projects Transit Projects Alternatives Analysis Page

41 Performance Measures General Indicators Travel Time Congestion Mode Choice Air Quality Cover entire System Useful for comparing overall effectiveness

42 Performance Measure: V/C Maps V/C stands for Road Volume divided by Road Capacity. Expressed as a ratio, the V/C for a Road in these maps is a calculated value generated by the Triangle Regional Model. The Maps below show which roads would have congestion in 2040 assuming different Land Use And Transportation alternatives for the Region. 3 COMM PLAN Pop = 85k Emp = 72k Moderate

43 Performance Measure: V/C Maps V/C stands for Road Volume divided by Road Capacity. Expressed as a ratio, the V/C for a Road in these maps is a calculated value generated by the Triangle Regional Model. The Maps below show which roads would have congestion in 2040 assuming different Land Use And Transportation alternatives for the Region. *4 TRANSIT INTENSIVE Pop =?k Emp =?k Transit Intensive
44 Detailed Info: Volume/Capacity Maps
45 Performance Measure: Travel Time Activity Centers Downtown Durham Carrboro/Chapel Hill Downtown Hillsborough Research Triangle Park Downtown Raleigh, and Pittsboro

46 Travel Time by Alternative Chapel Hill to Durham
47 Travel Time by Alternative Chapel Hill to Pittsboro
48 Travel Time by Alternative Chapel Hill to RDU Airport

49 Travel Time by Alternative Chapel Hill to Raleigh
50 Detailed Info: Travel Time


51 Scenario 2010 E+C HWY Mod AIT Population 198, , , , ,394 Daily Total VMT VMT Per Capita 7,300,000 7,280, ,260,000 7,240, ,220,000 7,200, ,180,000 7,160, ,140, E+C Highway Mod AIT E+C Highway Mod AIT Daily Total VHT VHT Per Capita 180, , , , , , , E+C Highway Mod AIT E+C Highway Mod AIT

52 Scenario 2010 E+C HWY Mod AIT Population 198, , , , ,394 Hours of Delay (Daily) Hours of Delay Per Capita (Daily) 45, ,000 35, ,000 25, ,000 15, ,000 5, E+C Highway Mod AIT E+C Highway Mod AIT


 129,143 129,273 128,581")
53 All Trips (Daily) Drive Alone (Daily) Rail (Daily) 1,070,000 1,060,000 1,050,000 1,040,000 1,030,000 1,020,000 1,010,000 1,000, , E+C 2040 HWY 2040 Mod 2040 AIT 485, , , , , , E+C 2040 HWY 2040 Mod 2040 AIT 15,000 10,000 5, E+C 2040 HWY 2040 Mod 2040 AIT 395,000 Carpool (Daily) 40,000 Bus (Daily) Non-Motorized: Bike and Walk (Daily) 390,000 30, , , , E+C 2040 HWY 2040 Mod 2040 AIT 20,000 10, E+C 2040 HWY 2040 Mod 2040 AIT 132, , , , E+C HWY Mod AIT Scenario 2010 E+C 2040 HWY 2040 Mod 2040 AIT - All Trips 1,018,441 1,018,342 1,032,788 1,026,755 1,060,389 - Drive alone (single occupant vehicle -SOV) 470, , , , ,952 - Carpool (Share ride) 382, , , , ,076 - Bus 35,925 35,905 37,323 30,362 39,372 - Rail ,985 14,382 - Non-Motorized (Bike and Walk) 129, , , , ,607

54 Transit Ridership 2010 E+C HWY Mod AIT CHT 38,180 38,460 39,061 37,476 46,888 Total Bus Ridership - CHT Mod AIT Durham-Orange LRT 8,576 27,335 Durham-Orange Light Rail Ridership 50,000 45,000 30,000 40,000 25,000 35,000 30,000 20,000 25,000 20,000 15,000 15,000 10,000 10,000 5,000 5, E+C HWY MOD AIT 0 MOD AIT
55 Next Steps Town advisory boards will have the opportunity to provide comments and recommendations to the Chapel Hill Town Council during their individual board meetings in September. The Town Council is expected to hold a Public Forum on September 24, 2012 and finalize their comments and recommendations for the Durham-Chapel Hill-Carrboro Metropolitan Planning Organization on October 8, 2012.
56 How can Citizens Participate? Workshops Chapel Hill Town Hall 9/20/12 4-7PM TAC Public Hearing Durham City Hall (2 nd Floor) 9/12/12 9AM Comment Period is 8/17/12 thru 10/10/12
57 Chapel Hill Public Forum Chapel Hill Town Hall 9/24/12 7PM Council Action Item Chapel Hill Town Hall 10/8/12 7PM
58 Consider the distribution of future growth in Orange County/Chapel Hill Evaluate the performance of the moderate transit and transit intensive transportation networks. Identify projected areas of congestion. Examine Performance Factors by alternative. Understand differences between the Community Plan and Transit Intensive land use scenarios.