URBAN FORESTED WATERSHEDS ADAPTATION PLANNING AND PRACTICES
|
|
|
- Daisy Brooks
- 5 years ago
- Views:
Transcription
1 ONLINE COURSE URBAN FORESTED WATERSHEDS ADAPTATION PLANNING AND PRACTICES Session 5: Step 4 Review and Step 5 Intro Tuesday, December 4, 11 am ET Web session etiquette. Please: If you are using a phone, turn off your computer speakers to avoid feedback and terrible noises. Mute your line unless you are speaking to the group. Mute/unmute your line
2 Today s Agenda Discussion: Step 4 review Discussion: how are you adapting your forests to a changing climate? Lecture: Step 5: Monitoring Website demo and homework
3 Step 4: IDENTIFY adaptation approaches and tactics for implementation. Key Question: What actions can enhance the ability of the ecosystem to adapt to anticipate changes and meet management goals?

4 Adaptation Strategies & Approaches A menu of possible actions that allows you to decide what is most relevant for a particular location and set of conditions. Find in: Step 4 of online workbook, Chapter 3-4 of FAR, or
5 Adaptation Strategies and Approaches CONCEPT Option Strategy Approach Tactic Big ideas Increase resistance Build resilience Facilitate transition ACTION See Step 4 Course Materials for a recorded presentation that provides more details
6 Adaptation Strategies & Approaches CONCEPT ACTION Option Strategy Approach Tactic Broad adaptation responses Sustain fundamental ecological functions Reduce the impact of existing biological stressors Maintain and enhance species and structural diversity Facilitate community adjustments through species transitions
7 Adaptation Strategies & Approaches CONCEPT Option Strategy Approach Tactic More specific actions Promote diverse age classes Maintain and restore diversity of native tree species Identify and move species to sites that are likely to provide future habitat ACTION
8 Adaptation Strategies & Approaches CONCEPT Option Strategy Approach Tactic Prescriptive actions selected by producer that are designed for individual site conditions and management objectives YOU DECIDE! ACTION
9 Adaptation Strategies & Approaches Management Goals & Objectives Climate Change Impacts Challenges & Opportunities Why it s important: Helps connect the dots from broad concepts to specific actions for implementation. Intent of Adaptation (Option) Make Idea Specific (Strategy, Approach) Action to Implement (Tactic)
10 Step 4: IDENTIFY adaptation approaches and tactics for implementation. Feasible? Practicability Effective?
11 Key Strategies You Selected: Urban Forest 1: Sustain or restore fundamental ecological functions 2: Reduce the impact of biological stressors 3: Reduce the risk and long-term impacts of severe disturbances 4: Maintain or create refugia 5: Maintain and enhance species and structural diversity 6: Increase ecosystem redundancy across the landscape 7: Promote landscape connectivity 8: Maintain and enhance genetic diversity 9: Facilitate composition adjustments through species transitions 10: Realign urban ecosystems after disturbance Watershed 1: Sustain fundamental hydrologic processes 2: Maintain and enhance water quality 3: Maintain or restore forests and vegetative cover 4: Facilitate forest ecosystem adjustments through species transitions 5: Accommodate altered hydrologic processes 6: Design and modify infrastructure to accommodate future conditions


12 What Options did you select? RESISTANCE RESILIENCE TRANSITION
13 Tactics you evaluated but did not select?
14 What are some new tactics or strategies you developed that you were not doing before?
15 Were there challenges you had that could not be addressed? Do others have ideas?
16 Were there tactics you developed that did not align with any of the strategies or approaches?
17 Any innovative ideas you ve heard about that others are doing?


18 Step 5: MONITOR and evaluate effectiveness of implemented actions.

19 Today s Agenda Discussion: Step 4 review Discussion: how are you adapting your forests to a changing climate? Lecture: Step 5: Monitoring Website demo and homework

20 Today Step 5! 5. MONITOR and evaluate effectiveness of implemented actions. 1. DEFINE area of interest, management objectives, and time frames. 2. ASSESS climate change impacts and vulnerabilities for the area of interest. Vulnerability assessments, scientific literature, and other resources Menu of Adaptation Strategies & Approaches 4. IDENTIFY and implement adaptation approaches and tactics. 3. EVALUATE management objectives given projected impacts and vulnerabilities.
21 A FEW THOUGHTS ABOUT MONITORING Be VERY CLEAR about your objectives! What question you are asking guides your monitoring approach: Scientific research = Is this outcome statistically significant compared to a control? Could we expect similar results elsewhere? Impact/ response monitoring = What changes are occurring? Implementation monitoring = Did we do the action? Effectiveness monitoring = Did our actions actually have the desired effect?
22 Course Material Landing Page

23 Step 5 Landing Page
24 Add a Monitoring Variable

25 Add a Monitoring Variable
26 Step 5: MONITOR and evaluate effectiveness of implemented actions. Monitoring Variable Items that can tell you whether you have achieved your management goals & objectives. If possible, use an item that also helps evaluate a particular tactic. For example: Planted seedling survival
27 Step 5: MONITOR and evaluate effectiveness of implemented actions. Evaluation Criteria What is success? What you re monitoring or measuring. What are the units on your data? For example: 60% survival of non-local genotypes.
28 Step 5: MONITOR and evaluate effectiveness of implemented actions. Monitoring Implementation How the monitoring will actually get done. Use existing monitoring when possible! For example: Regular post-planting stocking surveys. Supplemental surveys at 10 years.
29 Add a Monitoring Variable

30 Apply to Objectives

31 Homework
32 EXAMPLES
33 Step 5: MONITOR and evaluate effectiveness of implemented actions. Twentymile Creek and Marengo River Priority Watershed project Monitoring Item Monitoring Metric Criteria for Evaluation Brook Trout pop (+other spp) Channel stability # fish (size, pop, catch/effort) Detecting changes to Bankfull width, depth, and area Maintaining or increasing populations Maintaining stable channels no change in width: depth ratio Water temperature Summer max, max weekly mean Cold: < 23 C for annual max Cool: < 26 C for annual max forestadaptation.org/cnnf-water
34 Step 5: MONITOR and evaluate effectiveness of implemented actions. City of Columbia, MO: Street Tree Management Plan Monitoring Item Monitoring Metric Criteria for Evaluation Street Tree Survival % survival at 3 years 70% street tree survival at 3 years. Species Diversity Invasive species Biannual inventory of the percentage of trees that belong to a family Presence/absence of invasive vegetation at recently disturbed sites after 1 year. no more than 10% of street trees may belong to a single family Absence of invasive species
35 Step 5: MONITOR and evaluate effectiveness of implemented actions. City of Goshen, IN: Goshen Tree Benefits Campaign Monitoring Item Monitoring Metric Criteria for Evaluation Whip and seedling survival Survival of balled and burlapped trees and larger plantings Survival (mapped using Treekeeper) Survival (mapped using Treekeeper) 50% survival at 3 years. 85% after 3 years. % tree canopy Urban tree canopy assessment (remote sensing) 25% by 2025, 30% by 2030, 35% by 2035, 40% by 2040, 45% by
36 MONITORING TOOLS

37 Cambridge, MA: Cartegraph GIS Inventory

38 Street Tree Vulnerability Assessment media/42f2847a3dcb4706bb5981d66d0ab157.ashx

39 LiDAR Mapping
40 Citizen Science in Lombard, Philadelphia, Grand Rapids, and Malmo Sweden Novice: 1 year of experience or less (volunteers, interns) Intermediate: 1-3 years experience (volunteers, interns) Expert: experienced urban forest researchers and certified arborists Roman et al. 2017
41 Methods Volunteers received 6-7 hours of training led by experts Field guide provided Field work carried out without supervision Trees observed by 1 expert, 3 novices, and 3 intermediates Results compared between novice/intermediate and expert Field crew questionnaire Characteristics, level of training of participants Roman et al. 2017
42 Citizen science is good for: Classifying site type and land use Dieback rating (especially low, high) Genus ID (especially common ones like Acer, Gleditsia, Tilia Number of stems DBH within 1 inch (2.54 cm) Roman et al. 2017
43 Did not work as well for: Crown transparency Wood condition Classifying trees in middle dieback categories Species ID Identifying less common genera (Amelanchier, Prunus, Syringa) Species within genera DBH of multistemmed trees Radial growth monitoring Roman et al. 2017

44 My City s Trees: Urban FIA

45 Zoom in on a city

46 Get Inventory Summaries

47 Download Reports

48 I-Tree Landscape

49 USA National Phenology Network
50 USA National Phenology Network


51 Caroline Lake State Natural Area Adaptation Demonstration Major concerns: Forest composition could become less diverse given climate changes How can we better use forest inventory data to tell us: Are forests are at risk from climate change? Are management actions reducing risk? Matt Dallman (TNC), find project at forestadaptation.org/node/659
52 Climate-informed inventory: New Risk Metrics Northern Hardwood Stand: Low (PCM B1) High (GFDL A1F1) Proportion of Stand (IV %) Future: Current Habitat At-risk Proportion of Stand (%) Future: Current Habitat At-risk Proportion of Stand (%) Species Basal Area Stems Per Acre Freq. (%) Change Class Change Class Sugar maple No Change Large Decrease 40.8 White ash Increase Increase 0.0 American basswood No Change Increase 0.0 Yellow birch Decrease Large Decrease 7.0 Bigtooth aspen No Change Large Decrease 5.5 Red maple No Change Decrease 5.0 Northern red oak Increase No Change 0.0 American elm Increase Large Increase 0.0 Paper birch Decrease Large Decrease 2.0 Black ash Decrease Decrease 1.2 Black cherry Large Increase Increase 0.0 Eastern hemlock Increase Large Decrease 0.8 Quaking aspen Decrease Large Decrease 0.8 Total Proportion at-risk: 11.0 Proportion at-risk: 63.0
53 Climate-informed inventory: New Risk Metrics Northern Hardwood Stand: Low (PCM B1) High (GFDL A1F1) Proportion of Stand (IV %) Future: Current Habitat At-risk Proportion of Stand (%) Future: Current Habitat At-risk Proportion of Stand (%) Species Basal Area Stems Per Acre Freq. (%) Change Class Change Class Sugar maple No Change Large Decrease 40.8 White ash Increase Increase 0.0 American basswood No Change Increase 0.0 Yellow birch Decrease Large Decrease 7.0 Bigtooth aspen No Change Large Decrease 5.5 Red maple No Change Decrease 5.0 Northern red oak Increase No Change 0.0 American elm Increase Large Increase 0.0 Paper birch Decrease Large Decrease 2.0 Black ash Decrease Decrease 1.2 Black cherry Large Increase Increase 0.0 Eastern hemlock Increase Large Decrease 0.8 Quaking aspen Decrease Large Decrease 0.8 Total Proportion at-risk: 11.0 Proportion at-risk: 63.0
54 Climate-informed inventory: New Risk Metrics Northern Hardwood Stand: Low (PCM B1) High (GFDL A1F1) Proportion of Stand (IV %) Future: Current Habitat At-risk Proportion of Stand (%) Future: Current Habitat At-risk Proportion of Stand (%) Species Basal Area Stems Per Acre Freq. (%) Change Class Change Class Sugar maple No Change Large Decrease 40.8 White ash Increase Increase 0.0 American basswood No Change Increase 0.0 Yellow birch Decrease Large Decrease 7.0 Bigtooth aspen No Change Large Decrease 5.5 Red maple No Change Decrease 5.0 Northern red oak Increase No Change 0.0 American elm Increase Large Increase 0.0 Paper birch Decrease Large Decrease 2.0 Black ash Decrease Decrease 1.2 Black cherry Large Increase Increase 0.0 Eastern hemlock Increase Large Decrease 0.8 Quaking aspen Decrease Large Decrease 0.8 Total Proportion at-risk: 11.0 Proportion at-risk: 63.0


55 Climate-informed inventory: Risk Maps Risk by stand: overstory


56 100 year storms and floods Current streamflow Using stream channel capacity to manage future risks to infrastructure Terminology Future projected 100y flow Tools you can use Image: American Forests Image: i-study.co.uk Wobus et al, 2017; Mills et al, 2018
57

58

59 Increases and decreases in frequency and magnitude of river flood events generally coincide with increases and decreases in the frequency of heavy rainfall events
60 Climate change and flooding A changing climate Non stationary conditions Warming temperatures Earlier snowmelt in the spring Storm systems generate more rain because warm air holds more moisture than cold air. Seasonal floods are expected to arrive earlier in the spring While no single storm or flood can be attributed directly to global warming, changing climate conditions are at least partly responsible for past trends and the increasing frequency of major flood events. More heavy summer rainfall events Take home Message: Reimagine normal storms, and normal flows.


61 Future Climate: Precipitation More rain in winter and spring Winter Spring High Certainty: More rainfall annually & some seasons Potential for more frequent & intense heavy rains Reduced snowpack, earlier melting Summer Fall percent change relative to the average. RCP8.5. Stippling indicates that changes are assessed to be large compared to natural variations USGCRP, 2017: Climate Science Special Report: Fourth National Climate Assessment, Volume I

.")
 USGCRP, 2017: Climate Science Special")
62 Future Climate: Increases in extreme events Frequency of regional extreme precipitation events Heavy precipitation Sight increase in the very lightest precipitation days Large increase in the heaviest days Uncertainty for each specific duration grows as the return period increases, specifically for short duration storms. - Sarhadi and Soulis, 2017). doi.org/ /2016gl Model avg (CMIP models) USGCRP, 2017: Climate Science Special Report: Fourth National Climate Assessment, Volume I


63 Future Climate: Increases in extreme events Frequency & intensity of hourly heavy precip. will increase 1-2 times Winter (DJF) Summer (JJA) Future increases in 99 th % of hourly precipitation event intensities by 2100 Relative to January Prein et al doi: /nclimate3168.
64 Streams change over time: Channel capacity Traditional hydrological modelling assumes that the catchment does not change Understanding the natural capacity of your stream can reduce risks and mitigate infrastructure losses Channel geometry (width, mean, depth, cross-sectional area) and discharge Future changes in streamflow are expected to alter channel morphology Bankfull discharge is the streamflow that occurs when the stream fills its channel and any additional discharge will result in the stream overflowing its banks. 1-2 year flow Moves the most sediment over time and shapes the stream channel Channel forming flow

65 Understanding local channel capacity can help managers recognize areas prone to natural stream-erosion Indiana's Fluvial Erosion Hazard Program (


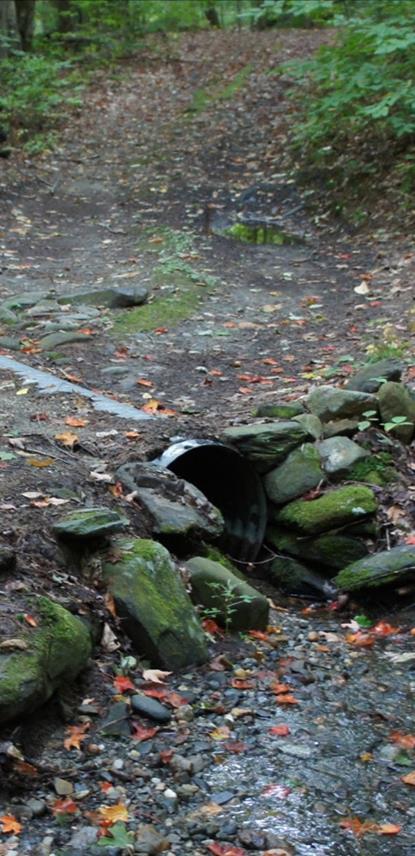
66 Find #s based on current - Chequamegon-Nicolet National Forest: Marengo and Twentymile Creek Watersheds forestadaptation.org/cnnf-water Find resources to help incorporate climate change into future infrastructure decisions If culverts built today cannot accommodate future channel conditions, then climate change could indirectly create barriers..and consequent loss habitats Wilhere et al
67 Hydrologic Frequency Terminology 100-Year Event that occurs on average every 100 years Average Recurrence Interval Commonly used term, included in NOAA Atlas 14 1% AEP flood: With observed or modeled data, a 1% AEP flood defines both a flow volume (E.g. 10,000 cubic feet per second) and an expected return interval or frequency for that flow volume (on average, once every 100-y) 1% Annual Chance Event that has a 1% chance of being exceeded in any year Average Exceedance Probability (AEP) Common term used to delineate special flood hazard areas in federal flood insurance rate maps FEMA & USGS use this term

68 Does a 100-year storm always cause a 100-year flood? No. Several factors can independently influence the cause-and-effect relation between rainfall and streamflow. - Extent of rainfall in the watershed - Soil saturation before the storm - Watershed size and duration of the storm Learn more
 threshold by 2100 Quantify damages from 100-year (1% annual exceedance")
69 Predicting future flood risks in the 100-y floodplain Modeling approach: Used National Flood Insurance Program (NFIP) geospatial data on 100yr floodplains - regulatory floodplain that requires flood insurance Modeled both the frequency, and magnitude of high flow events with a 1% annual exceedance probability (AEP) threshold by 2100 Quantify damages from 100-year (1% annual exceedance probability, or AEP) floods nationwide Only modeled 100-yr yet, larger floods will be more damaging 1,000 model runs for high emissions (RCP 8.5), low (RCP 4.5) to develop trends Wobus et al, 2017
70 Bigger flow volume for more frequent events The 100 m3s-1 flow baseline 1% AEP flood becomes twice as frequent by end of century (shift from 100-y to 50-y average return interval RCP 4.5) Larger flow volumes 100-y return interval [1% AEP event] becomes 25% larger in 2090 RCP 4.5 *Example of change in inland flooding for one river reach. Modeled future flows Found flow and flood magnitude increased in some cases. Mills et al, 2017, Wobus et al 2017 Ensemble mean, 29 models
 Increases in frequency 10 times current baseline Decreases in frequency Mills et al, 2017, Wobus et al 2017 Ensemble mean, 29")
71 HIGH emissions LOW emissions Change in frequency of annual 1% (100 year) event from baseline, by 2100 Red: Extreme increases in frequency for the baseline flood (> 1) Blue: Largest decreases in frequency (< 1) Increases in frequency 10 times current baseline Decreases in frequency Mills et al, 2017, Wobus et al 2017 Ensemble mean, 29 models
 floods. Map shows 2090 - RCP 8.")

72 Projected change in the frequency of baseline 1% annual exceedance probability (AEP) floods. Map shows RCP 8.5 (High emissions, business as usual scenario) Arkansas Mills et al, 2017, Wobus et al 2017 Ensemble mean, 29 models Increases in frequency (>1) Decreases in frequency (<1)

73 Projected Flood damages ($ cost) (Wobus et al, 2017) High emissions: Flood damages exceed low emissions by ~$3B/year in 2100 Gray lines show results from 1,000 simulations for RCP 4.5 and RCP 8.5 Emissions scenarios diverge primarily after *in 2014 dollars Wobus et al, 2017
 (Slater et al, 2015) Stream channels evolve, aggrade, degrade, narrow, widen.")
74 Stream channels are dynamic, and change over time Any changes in a river channel s capacity (i.e., the depth, width, and roughness) may significantly alter the frequency of local flooding above set flood levels (even in the absence of any changes in discharge) (Slater et al, 2015) Stream channels evolve, aggrade, degrade, narrow, widen. Particularly in locations that have experienced major changes in channel capacity due to urbanization or water regulation Image: Cuyahoga Soil & Water Conservation District Read more on this concept: Slater, L. J., M. B. Singer, and J. W. Kirchner (2015), Hydrologic versus geomorphic drivers of trends in flood hazard, Geophys. Res. Lett., 42, , doi: /2014gl


75 What can we do? Leave? Pretend it s not happening? Embrace uncertainty Reframe our idea of future conditions Get out in front and address the problem in planning now?

76 Where to start Understand the channel capacity at your site Learn how to incorporate ecological considerations into roadstream crossing designs to accommodate changing hydrology USDA FS Stream Simulation tool
 Updates are noteworthy: Atlas 14 includes most recent 30 years of precipitation data And includes more weather stations than previous efforts.")
77 Where to start: Evaluate storm frequency tool: NOAA Atlas 14 NOAA has updated precipitation frequency (PF) estimates for the U.S (Pmin, Pmax, Pavg) Updates are noteworthy: Atlas 14 includes most recent 30 years of precipitation data And includes more weather stations than previous efforts. Gridded precipitationfrequency estimates at 30 arcseconds resolution Provides estimates of 500 yr and 1000 yr events

78 Where to start: Evaluate storm frequency - NOAA Atlas 14 Atlas 14 can replace older technical reports when making infrastructure sizing and design decisions for conveyance and detention. Likely - Precipitation Frequency estimates used for stormwater management do not accurately reflect the depths falling during precipitation events Climate change projections indicate rainfall volumes will continue to increase over the next 50 years Start with Atlas 14, incorporate other considerations.
 Bulletin 71/Atlas 14 [% change] Huron River Watershed Stormwater Guide https://www.hrwc.")
79 Expected normal rainfall amount Case study: Ann Arbor, MI (Older technical report vs. Atlas 14) Bulletin 71/Atlas 14 [% change] Huron River Watershed Stormwater Guide Atlas 14 prediction: Changes storm estimates

80

 https://ny.water.usgs.")
81 Tool: USGS Future Flow NY state only Get future flow predictions for your watershed Flood regressions and climate change scenarios future peak flows Estimate flows (cfs, and % change)
82 To-do list for next week: Complete Step 5: Monitor and evaluate effectiveness Complete the Homework section after Step 5 Recommended readings: Roman et al Janowiak et al Come to Session 6 (Tuesday, December 11) ready to discuss your monitoring! Thanks everyone! Troubleshooting? Stay on the line.