Inland sea versus coastal ocean zooplankton response to The Blob.
|
|
|
- Lee Matthews
- 5 years ago
- Views:
Transcription


1 Inland sea versus coastal ocean zooplankton response to The Blob. Julie Keister 1, Jennifer Fisher 2, Ian Perry 3, William T. Peterson 4, Kelly Young 3, Moira Galbraith 3, Amanda Winans 1, Bethellee Herrmann 1, Jan Newton 1, Wendi Ruef 1, John Mickett 1 1-University of Washington Oceanography, Seattle 2-Hatfield Marine Science Center, Newport, OR 3-Department of Fisheries and Oceans, Canada 4-NOAA Northwest Fisheries Science Center


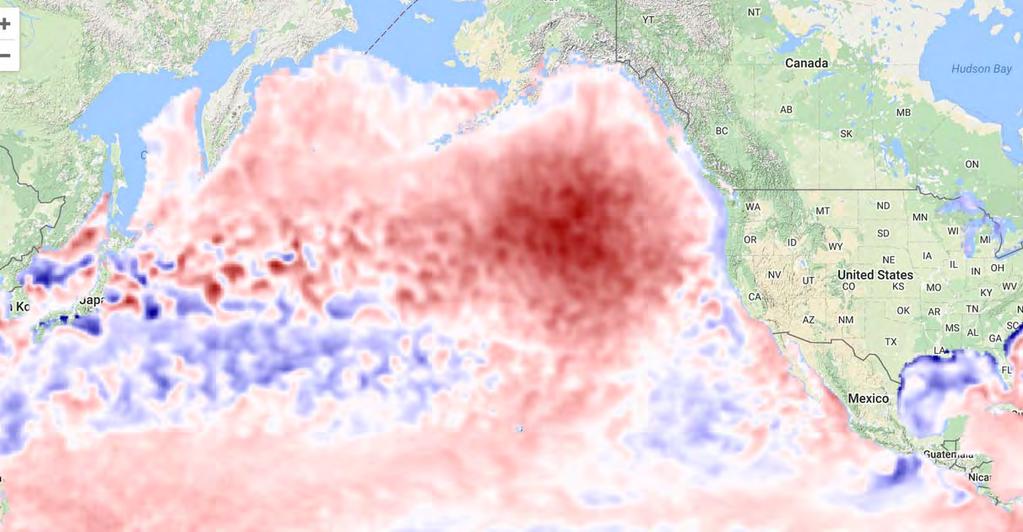
2 Record high temperatures occurred during the Pacific Warm Anomaly, a.k.a. The Blob January 2014 Developed offshore during winter SST anomalies NANOOS Visualization System:

3 Summer 2014 Warm water held offshore by upwelling in summer 2014 July 2014 SST anomalies NANOOS Visualization System:

4 Dramatically advected onto shelf in Fall 2014 with shift to downwelling. October 2014 SST anomalies NANOOS Visualization System:


5 Very warm water at >50 m depth on shelf in October. Cha ba buoy off La Push, WA Temperature July August September October
6 Oregon coast temperatures remained high Fall 2014 through Fall 2016:


 Extremely low salmon returns Abandoned and starved sea lion pups")
7 Reported biological impacts during the Blob: Unprecedented copepod species richness off Oregon (Peterson et al. 2017; Jacobson yesterday) Unprecedented negative cold water copepod anomalies Near record positive warm water copepod anomalies Extremely low juvenile/adult euphausiid biomass Massive Cassin s auklet die offs (J. Parrish) Extremely low salmon returns Abandoned and starved sea lion pups Unprecedented, wide spread toxic Pseudo nitzschia bloom (Du et al. 2016) Image: NOAA
8 How was this big anomaly reflected in inland sea systems? Were responses coherent throughout the region? Nutrients Chlorophyll Zooplankton Salmon
 1997 present (hydrography, King Count) Collaborative program 200 m average depth Newport Line: Continental shelf upwelling system 1996 present NOAA NWFSC (W. Peterson et al.")
9 Zooplankton time series: Strait of Georgia: Inland Fjord 1995 present DFO Canada (D. Mackas, I. Perry, et al.) 300 m average depth Puget Sound: Inland Fjord 2014 present (zooplankton, J. Keister et al.) 1997 present (hydrography, King Count) Collaborative program 200 m average depth Newport Line: Continental shelf upwelling system 1996 present NOAA NWFSC (W. Peterson et al.) 65 m depth
10 Puget Sound: Water column heat content anomalies Region Month Central Sound
11 Oregon coast Nutrient and Chlorophyll anomalies Relative to mean Nutrient anomalies anomaly (um L -1 ) NH-5 Surf NO 2 + NO 3-10 Chlorophyll anomalies anomaly (ug L -1 ) NH-5 Surf Chl-a Year
12 Puget Sound Nutrient and Chlorophyll anomalies Relative to mean 0.15 Nutrient anomalies <2m: Nitrate/nitrite Anomaly (mg/l) Chlorophyll anomalies <2m: Chl a Anomaly (ug/l)
13 Zooplankton biomass anomalies: Relative to mean Zooplankton Biomass Anomaly (mg/m3) Zooplankton Biomass Anomaly (mg/m3) Oregon coast Zooplankton biomass anomalies Jan 14 Jan 15 Jan 16 Jan 17 Puget Sound Zooplankton biomass anomalies
14 Annual cumulative zooplankton biomass: Cumulative Biomass (mg C m 3) Cumulative Biomass (mg C m 3 ) Oregon Coast Apr May Jun Jul Aug Sep Oct Nov Dec Central Puget Sound 2014 Apr May Jun Jul Aug Sep Oct Nov Dec 2014
15 Central Strait of Georgia zooplankton biomass increase Abundance Zooplankton biomass annual anomalies Anomaly of Log10 abundance (#/m 2 ) Anomaly of Log10 biomass (g/m 2 ) Biomass Anomaly of Log10 biomass (g/m 2 ) Young et al., Salish Sea Ecosystem Conference, 2018

16 Coastal salmon that out migrated in 2014 and 2015 had some of lowest returns on record: Year Coho survival Chinook returns Ranked from best (1) to worst (18) Juvenile salmon growth was high in all years, (B. Beckman unpub. June IGF 1 data) Coho survival and Chinook returns were lower in 2015.

17 Puget Sound Juvenile Chinook salmon growth and size: Tended to be higher and less variable in 2015 than IGF 1 index of growth for 3 regions: Bellingham Bay San Juans N. Whidbey N. Whidbey juvenile salmon size: Chamberlain et al Courtesy of C. Greene et al., NOAA
18 Puget Sound Coho salmon survival rate was higher for 2015 out migrants than 2014: smolt to adult survival Puget Sound Coho salmon smolt to adult survival Out migration in 2014 Out migration in Big Beef Creek Bingham Creek Green River Puyallup River Satsop River Skagit River Skykomish River Willapa River
19 Puget Sound salmon prey taxa much higher biomass in warm years: Cumulative biomass (mg C m 3 ) Prey Field Biomass 0 Apr May Jun Jul Aug Sep Oct Nov Dec Cumulative Biomass (mg C m 3 ) Crab larvae biomass Apr May Jun Jul Aug Sep Oct Nov Dec Prey Field = Decapods + amphipods + ichthyoplankton + euphausiids


20 Big difference between systems Mechanisms? Hypotheses?
21 H1: Fundamental differences between systems Deeper, warmer, more stratified system. Circulation limited by sills drought decreased stratification higher production Shallower, colder upwelling site. Strongly influenced by water mass advection. Typical Summer SST Upwelling of warmer, less saline deep water, low NO 3, increased stratification lower production


22 Strong evidence for advection-driven changes in California Current zooplankton Typical Summer SST Very few unusual species observed in Puget Sound
23 H2: Different temperature optima of resident dominant species? North Pacific warm water species { Puget Sound dominants: Calanus pacificus Corycaeus anglicus Paracalanus Pseudocalanus moultoni Typical Summer SST Boreal cold water species { Oregon Upwelling dominants: Calanus marshallae Pseudocalanus mimus Acartia longiremis
24 Working Hypothesis: Puget Sound: Higher temperature higher growth of resident species, supported by sufficient primary production. Typical Summer SST Oregon Coast: Advection of high temperature, nutrient poor water & oceanic species assemblage. Insufficient primary production, only small species present

 Mechanisms under investigation!")
25 Conclusions During Blob years: Large regional contrasts in zooplankton observed: Lower zooplankton biomass on continental shelf Higher zooplankton biomass in Puget Sound Mixed response in salmon: High juvenile growth in both regions during warm years Indication of better survival from Puget Sound rivers in 2015; worse on coast. But returns low in both regions (lag in PS?) Mechanisms under investigation! 2017 conditions returning to ~normal (at least in Puget Sound).


26 Partnerships & Funding Innumerous field crew! All of the co-authors Additional data from: Kim Stark Gabriela Hannach Cheryl Morgan Karen Suchy