NIPCC versus IPCC. Presentation to DDP Oakland, CA, Aug 4, S. Fred Singer Science & Envir Policy Project
|
|
|
- Brice Owen
- 5 years ago
- Views:
Transcription
1 NIPCC versus IPCC Presentation to DDP Oakland, CA, Aug 4, 2007 S. Fred Singer Science & Envir Policy Project
2 The Science is Not Settled: Major Issues Remain Unresolved by the IPCC Human Contribution to Warming is Insignificant: CO2 is Not a Pollutant ========================================================= A Report of the NIPCC (Non-governmental International Panel on Climate Change) on the IPCC 4 th Assessment of Climate Science (May 2007; Summary released Feb. 2, 2007)
3 The UN-IPCC Working Group-1 (Science) fails to consider important scientific issues any one of which would upset its major conclusion that current warming is dominated by anthropogenic (human-generated) causes. The science is far from settled, as often claimed. If the cause is natural as shown here then all costly efforts to mitigate climate change, like control of CO2 emissions, even on a global basis, are ineffective.
4 The NIPCC strongly rejects the current public hysteria and alarmism about global warming (GW). We assert that an increase in GH gases is no threat to humanity or to nature. In fact, a warmer climate and/or more CO2 would benefit most human activities, especially agriculture and forestry. In any case, natural climate change is unstoppable; adaption, not GH-gas control, is the only sensible response.
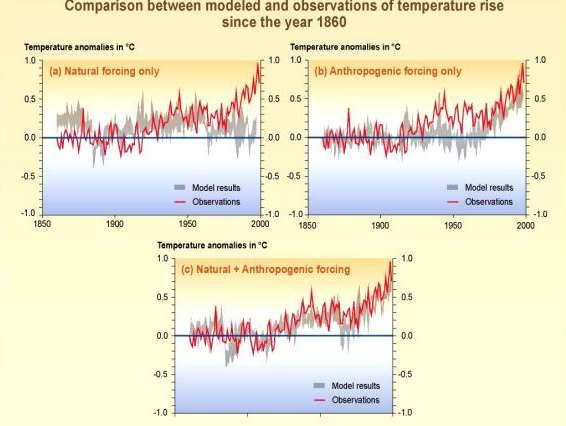
5 The IPCC does not apply generally accepted methodologies to determine what fraction of current warming is natural or how much is caused by the rise in greenhouse (GH) gases. Yet a comparison of fingerprints from best available observations with the results of state-of-the-art GH models leads to the conclusion that the (human-caused) GH contribution is minor. This result, evidently, contradicts the major IPCC conclusion and therefore has important consequences for policy, including also implications for the conclusions of IPCC Working Group-2 ( Impacts, Adaptation, and Vulnerability ) and WG-3 ( Mitigation of Climate Change ).
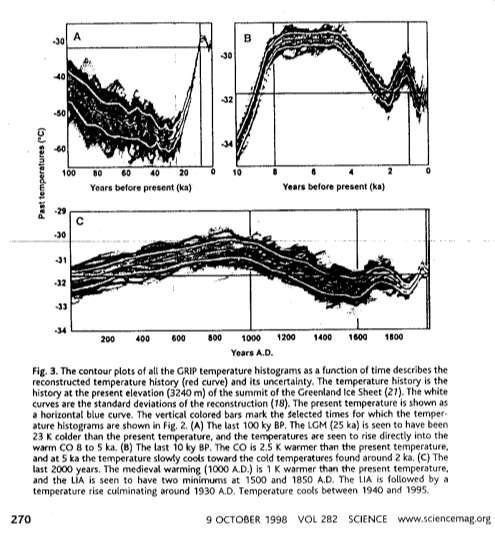
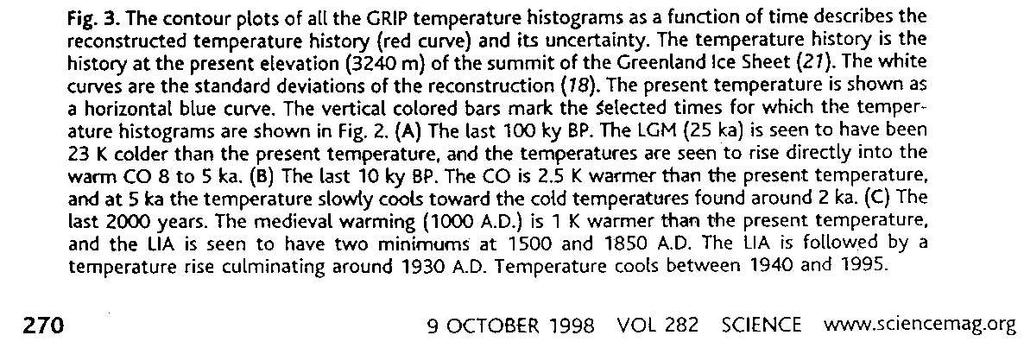
6 The IPCC continues to ignore the overwhelming evidence that, on decadal time scales, the Sun is responsible for much of past climate change. It is therefore highly likely that the Sun is also a major cause of 20 th century warming, with anthropogenic GH warming making only a minor contribution. In addition, the IPCC ignores, or addresses imperfectly, other science issues that call for discussion and explanation and are detailed in individually signed Appendices to this report.
7 The task of this NIPCC report is to critique the IPCC s Fourth Assessment Report (AR4) and to: correct errors and misstatements supply science data that was available but was ignored by the IPCC add relevant material published since May 2006, the IPCC cut-off date.
8 In general, the UN-IPCC fails to consider important scientific issues any one of which would upset its major conclusion that most of current warming is very likely human caused. We discuss first two major issues and then list less crucial ones. The major issues are: The cause of current warming whether natural or anthropogenic? Matching fingerprints Shortcomings of climate models Lessons from Nuclear Winter The causes of natural climate change esp. solar influences.
9 How good is our understanding of the atmospheric carbon-dioxide budget? What determines sea level rise The physics of sea-surface heating The ocean heat content and its implications. Multi-decadal Ocean Cycles and their impacts. How anthropogenic GW (AGW) leads to less severe weather and fewer hurricanes. The question of what caused the pre-1940 warming. The mismatch between modeled fingerprints and empirical data.
10 It is obvious that our imperfect understanding of such climate problems means that the science is far from settled and that proposed efforts to mitigate climate change by various schemes to control GHgas emission (or similar costly policies) are misguided; they are certainly ineffective and economically harmful.
11 This report of the NIPCC exhibits evidence, based on the best available temperature data, that clearly falsifies the principal IPCC conclusion, namely that the reported warming (since 1979) is caused by the human emission of GH gases. Our result, if sustained, points to natural causes and has obvious policy implications: All schemes proposed for controlling CO2 emissions, including the Kyoto Protocol, are ineffective and waste resources that can better be applied to genuine societal problems.
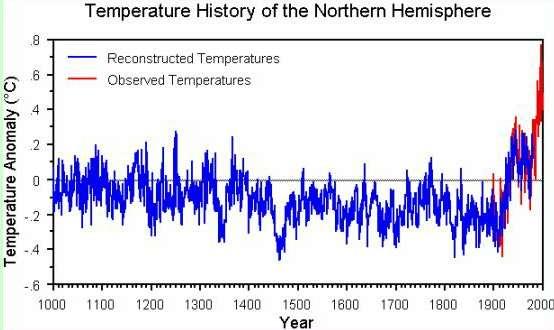
12 It is important to emphasize also that if for whatever reason -- a modest warming were to occur even one that matches temperatures seen during the Medieval Warm Period of around 1100 AD or the much larger ones recorded during the Holocene Climate Optimum of some 6000 years ago -- the impact will not be damaging but will on the whole be beneficial. The evident survival of polar bears and other species, of polar ice sheets and glaciers, of corals, all demonstrate that warmer temperatures have not been harmful as many seem to fear. A colder climate would certainly be harmful; logic dictates that if a warmer climate were also harmful, then the present climate would have to be optimal an unlikely occurrence.
13
14
15 Figure 2 Temperature Deviation ( C) Year -0.6

16 Figure 3.6
17

18 Figure TS.5
19

20 CCSP 1.1 Chapter 1, Figure 1.3F PCM Simulations of Zonal-Mean Atmospheric Temperature Change

21 CCSP 1.1 Chapter 5, Figure 7E
22 CCSP 1.1 Chapter 5, Figure 4G

23 A more detailed view of the disparity: Douglass, Knox, Pearson, Singer GRL-2006
24 John Maynard Keynes: If the facts change, I ll change my opinion. What do you do, Sir?
25

26 El Niño Volcanoes El Chichon Pinatubo
27
28
29 NUMBERS OF WEATHER STATIONS AND GRID BOXES Weather Stations: Northern/Southern. Grid Boxes Northern/Southern (Possible for 5º x 5º)
30
31 Sea Level Rise to 2100 H R S Draft 2007 Hansen (H) Rahmst. (R) Singer (S) Max Min

32 Figure TS.3
33
34
35
36

37 CCSP Executive Summary Figure 4G: Modeled and Observed Temperature Trends in the Tropics (20 o S-20 o N)
38