GRUAN ICM-4 visit to NIES/CGER, March 8, The GOSAT Project. Tatsuya Yokota
|
|
|
- Juliana Robertson
- 5 years ago
- Views:
Transcription
1 GRUAN ICM-4 visit to NIES/CGER, March 8, 2012 The GOSAT Project Tatsuya Yokota Center for Global Environmental Research (CGER) National Institute for Environmental Studies (NIES), Japan Dec. 17, 2008
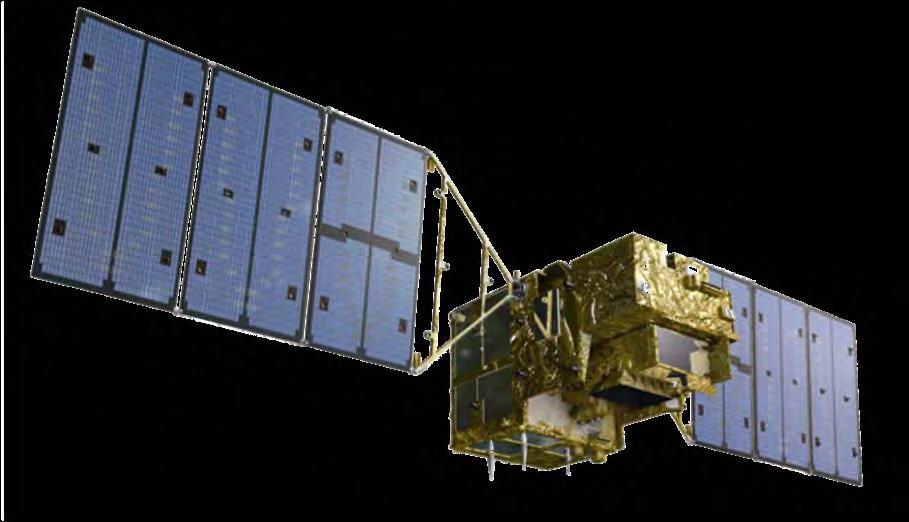
2 Contents Status of the GOSAT observations TANSO-FTS SWIR CO 2 and CH 4 Level 2 (V01.xx) data products Validation summary and temporal variation of Level 2 (V01.xx) data products Collaboration with worldwide researchers GOSAT (IBUKI) launched by H-IIA F-15 vehicle on January 23, (Photo by Mitsubishi Heavy Industries, LTD)


3 GOSAT was launched on 23 January 2009 from Tanegashima Island in Japan, and has been operating for more than 3 years. GOSAT is the first satellite in the world dedicated to observing greenhouse gases. Researchers worldwide are using GOSAT data. GOSAT makes measurements globally, particularly over the areas where ground monitoring stations are sparse. GOSAT data are available from June GOSAT (IBUKI) launched by H-IIA F-15 vehicle on January 23, (Photo by Mitsubishi Heavy Industries, LTD) 2
4 Status of the GOSAT observations 13-Mar-12 3


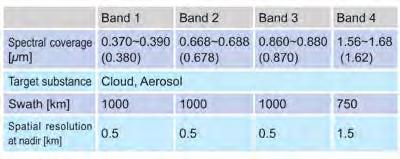
5 TANSO-FTS (Fourier Transform Spectrometer) TANSO=Thermal And Near infrared Sensor for carbon Observation TANSO also means carbon in Japanese TANSO-FTS TANSO-CAI TANSO-CAI (Cloud and Aerosol Imager) 4


6 Greenhouse gases Observing SATellite Pointing and Footprints cross track patters Cloud and Aerosol Scattering>>S Camera FOV > 30 km TANSO FTS IFOV=10.5 km TANSO CAI IFOV=0.5, 1.5 km SWATH 900km TANSO-CAI IMC ID=5 North Cross Track X km TANSO-FTS Camera Y km deg Equator Sun Glint West TANSO-FTS S Polarization Bands South P Day Side: 1 pm orbit (Courtesy by H. Suto (JAXA)) 5 East
7 Status of ground measurements of GHGs (GHG monitoring stations: 325, CO2 measurement: 214, CH4 measurement: 195 as of 7 March 2012) 6


 GHG data are obtained")
8 Status of ground measurements of GHGs (GHG monitoring stations: 325, CO2 measurement: 214, CH4 measurement: 195 as of 7 March 2012) GHG data are obtained only for cloud-free scenes! 7
 (2.5 deg. mesh) (by Y.")
9 Measurement data numbers and coverage (June 2009 May 2010) (2.5 deg. mesh) (by Y. Yoshida (NIES)) 8


10 TANSO-FTS Level 1B Band 1P SWIR Band 1S Band 2P Band 2S Band 3P TIR Band 3S Band 4 9
 Ground Monitoring Station Data Source: NIES GOSAT project pamphlet")
11 GOSAT Data Processing Flow L2 (column abundance obtained by each scan) L3 (spatial and temporal average of column abundances) Ground Monitoring Station Data Source: NIES GOSAT project pamphlet 10
 Level 3 (L3) Level 4 (L4A, L4B)")
12 GOSAT Standard Data Products Level 1 (L1) Level 2 (L2) Level 3 (L3) Level 4 (L4A, L4B) 11
13 TANSO-FTS SWIR CO 2 and CH 4 Level 2 (V01.xx) data products 12
 Level 2 Level 3 Oct. 2009 Oct. 2010 Oct.")
14 XCO 2 TANSO-FTS SWIR Level 2 & Level 3 Annual Change of XCO 2 (October 2009, 2010, 2011) Level 2 Level 3 Oct Oct Oct


15 XCH 4 TANSO-FTS SWIR Level 2 & Level 3 Annual Change of XCH 4 (October 2009, 2010, 2011) Level 2 Level 3 Oct Oct Oct

16 GIF Animation of Monthly Level 2 of XCO 2 and XCH 4 (2.5 deg. mesh, June 2009 December 2010) XCO 2 XCH 4 15
 (for 22 months except for May 2009) XCO 2 XCH 4 Available from Gallery")
17 GIF Animation of Monthly Level 3 of XCO 2 and XCH 4 (2.5 deg. mesh, April 2009 February 2011) (for 22 months except for May 2009) XCO 2 XCH 4 Available from Gallery page of 16
 17")
18 (Japan exhibition COP17) 17
19 Validation summary 18


20 Schematic illustration of validation experiments Source: GOSAT Project pamphlet 19

21 TCCON sites for GOSAT validation

![97] ppm Coincidence Condition: FTS: +/- 0.](/docs-images/92/109846678/images/22-4.jpg "5 hr +/- 1 hr +/- 1 hr GOSAT: 1~3 deg +/- 2 deg +/- 5 deg Number: 62 256 966 [Bias, STD]:")
22 (by IWGGMS-7 (2011)) XCO 2 and XCH 4 comparing TCCON FTS sites & GOSAT CO 2 CO 2 CO 2 y=x+b [Bias, STD]: [-8.85, 4.75] ppm [-8.57, 4.44] ppm [-8.25, 3.97] ppm Coincidence Condition: FTS: +/- 0.5 hr +/- 1 hr +/- 1 hr GOSAT: 1~3 deg +/- 2 deg +/- 5 deg Number: [Bias, STD]: [-20.4, 18.9] ppb [-15.8, 22.3] ppb [-14.8, 22.6] ppb CH 4 CH 4 CH 4 21
23 Validation Summary TANSO-FTS SWIR Level 2 (V01.xx) (validated by comparing with ground-based TCCON FTS) X CO2 Bias ppm (-2.3 %) Standard Deviation 4.75 ppm (1.2 %) X CH ppb (-1.2 %) 18.9 ppb (1.1 %) (by Morino et al., Atmos. Meas. Tech., 4, , 2011) 22
24 Collaboration with TCCON sites for GOSAT Validaiton NIES has contracted with the following universities/institutes for the research support and/or technical assistance in order to obtain TCCCON ground-based FTSs data in sync with GOSAT observations over the sites. U. Bremen (Germany): Bremen, Bialystok, Orleans, Spitsbergen Caltech (USA): Park Falls, Lamont U. Wollongong (Australia): Darwin, Wollongong NIWA (New Zealand): Lauder 13-Mar-12 23
 about 40-50 sites in the world CONTRAIL data (so called JAL data) for CO 2 NOAA aircraft sampling data for CH 4 NIES aircraft sampling data for CO 2 and CH 4 2007-2010 Papers for calculating")
25 Aircraft measurements by JAL, NOAA, and NIES (by I. Morino & O. Uchino) about sites in the world CONTRAIL data (so called JAL data) for CO 2 NOAA aircraft sampling data for CH 4 NIES aircraft sampling data for CO 2 and CH Papers for calculating XCO 2 from a profile : Araki et al. Atmos. Chem. Phys., 10, , 2010 and Miyamoto et al. submitted to Atmos. Chem. Phys. CONTRAIL: in situ CO 2 measurements NOAA, NIES: flask sampling Uncertainty of XCO 2 from profile: ~ 1 ppm CONTRAIL Project (Comprehensive Observation Network for TRace gases by AIrLiner) (T. Machida et al., J. Atmos. Oceanic Technol., 25, , 2008.) 24 24
 Using CONTRAIL & NOAA Data Coincidence: ±2 deg.(long. & Lat.) GOSAT CH 4 (ppm) X CH4 Data Number: 926 Bias: -0.")
26 Validation by Using Aircraft Measurement Data GOSAT CO 2 (ppm) X CO2 aircraft CO 2 (ppm) y=x+b Data Number: 548 Bias: -8.3 ppm STD: 4.4 ppm (by I. Morino & O. Uchino) Using CONTRAIL & NOAA Data Coincidence: ±2 deg.(long. & Lat.) GOSAT CH 4 (ppm) X CH4 Data Number: 926 Bias: -0.6 ppb STD: 20 ppb Solid line: one-to-one Dashed line: Regression line as y=x+b aircraft CH 4 (ppm) 25
27 Validation Summary TANSO-FTS SWIR Level 2 (V01.xx) (validated by comparing with ground-based TCCON FTS) X CO2 Bias (-8.3) ppm (-2.3 %) Standard Deviation 4.75 (4.4) ppm (1.2 %) X CH (-0.6) ppb (-1.2 %) 18.9 (20) ppb (1.1 %) (by Morino et al., Atmos. Meas. Tech., 4, , 2011) ( ): by using Aircraft measurement data 26
28 Illustration of how light scattering would impact data processing (Major error sources: cirrus & aerosols) The light path can be modified by two mechanisms: One is direct scattering of sunlight from the cloud to the satellite (by S. Oshchepkov & A. Bril (NIES)) The other mechanism is due to multiple light reflections between the cloud and the ground surface Cloud Cloud Aerosol Aerosol Dark Surface Bright Surface This effect is predominant for dark surface such as ocean and leads to underestimation of gas amount This effect holds for bright surface like over desert and leads to overestimation of gas amount 27
29 Temporal variation of Level 2 (V01.xx) 28
) 29")
30 CO 2 Temporal & latitudinal variation (for all data) 2011/11/30 CH /11/30 (by Y. Yoshida (NIES)) 29

31 Temporal variation of zonal mean, comparing with NIES TM XCO 2 (for all data) 2009/4/1 2011/11/ /4/1 2011/11/30 XCH /4/1 2011/11/ /4/1 (by Y. Yoshida (NIES)) 2011/11/

32 Preliminary results of SWIR L2 V02 (by Y. Yoshida (NIES)) 31
33 Preliminary results of SWIR L2 V02 (by Y. Yoshida (NIES)) 32

34 GOSAT contribution to carbon flux estimation Inversion of atmospheric transport model 33 33
. Results for four months (July 2009, October 2009, January 2010, and April 2010) are presented.")
35 Monthly CO 2 Flux Estimates July 2009 October 2009 (Level 4A data product) 64-regional monthly CO 2 fluxes estimated from ground-based network data* and GOSAT XCO 2 retrievals (currently under evaluation). Results for four months (July 2009, October 2009, January 2010, and April 2010) are presented. January 2010 April 2010 *GLOBALVIEW-CO2 (2011), Cooperative Atmospheric Data Integration Project - Carbon Dioxide. CD-ROM, NOAA ESRL, Boulder, Colorado (Also available on Internet via anonymous FTP to ftp.cmdl.noaa.gov, Path: ccg/co2/globalview). Land Ocean GOSAT websites JAXA GOSAT project NIES GOSAT Project Press conference statements

36 Collaboration with worldwide researchers 35
 Carbon Balance Estimation and Atmospheric Transport Models 5) Data application The 1st GOSAT RA")

 National Institute")
37 GOSAT Research Promotion Research Announcement Research Topics 1) Calibration 2) Data Processing Algorithm 3) Validation 4) Carbon Balance Estimation and Atmospheric Transport Models 5) Data application The 1st GOSAT RA in research themes were selected. The 2nd GOSAT RA in research themes were selected. The 3rd GOSAT RA in research themes were selected. Data Release CAI & FTS-L1B data product: October 30, 2009 CAI & FTS-L2 data product: February 18, 2010 Improved FTS-L2 data product: August 24, 2010 Japan Aerospace Exploration Agency (JAXA) National Institute for Environmental Studies (NIES) Ministry of the Environment (MOE) 36
38 Countries of GOSAT RA PIs Country Total Japan USA Canada UK France Finland Norway 1 1 Russia 4 4 Germany Italy 2 2 Belgium 1 1 Netherlands Brazil 1 1 Czech 1 1 Spain Singapore 1 1 China Korea NewZealand 1 1 India Indonesia 1 1 Taiwan, ROC 1 1 Australia 2 2 Total

39 NIES GOSAT Project Web site 38
40 Concluding Remarks GOSAT has continued observations more than 2 years and 9 month since June Biases of GOSAT TANSO-FTS SWIR Level 2 data product (V01.xx) are X CO2 : -2 ~ -3% and X CH4 : ~1 %. Standard deviations of them are ~1 %. The L2 algorithm will be revised into V02.xx soon. GOSAT data have been used by worldwide researchers. We are collaborating on Cal/Val, retrieval, carbon source/sink estimation, and scientific data use. GOSAT project has continued collaborating with alliance organizations (AO1: JMA, NASA, ESA, CNES, ECMWF, ) 39