Total Maximum Daily Loads for Total Phosphorus in the Wisconsin River Basin
|
|
|
- Tracey Greer
- 5 years ago
- Views:
Transcription


1 Total Maximum Daily Loads for Total Phosphorus in the Wisconsin River Basin Final Report December 21, /21/2018 Including Adams, Clark, Columbia, Dane, Forest, Jackson, Juneau, Langlade, Lincoln, Marathon, Monroe, Oneida, Portage, Price, Richland, Sauk, Shawano, Taylor, Vernon, Vilas, Waushara, and Wood Counties, Wisconsin Prepared For: U.S. Environmental Protection Agency Region 5 77 W. Jackson Blvd. Chicago, IL Prepared By: WI Department of Natural Resources 101 S. Webster St PO Box 7921 Madison, WI
2 Page intentionally left blank Total Maximum Daily Loads for Total Phosphorus in the Wisconsin River Basin Page 1
3
4 Total Maximum Daily Loads for Total Phosphorus in the Wisconsin River Basin Contents List of Figures... iii List of Tables... iv List of Appendices... iv List of Acronyms and Terms... v 1 INTRODUCTION... 1 Federal TMDL Program... 1 Wisconsin River TMDL Project... 1 Problem Statement... 2 Narrative Water Quality Criteria Numeric Water Quality Criteria Designated Uses Fish and Other Aquatic Life Uses Recreational Uses WATERSHED CHARACTERIZATION Ecological Landscapes Central Sand Plains Central Sand Hills Forest Transition North Central Forest Northern Highlands Hydrology and Water Resources Wisconsin River Main Stem Wisconsin River Tributary Streams Lakes and Reservoirs MONITORING Wisconsin River Main Stem and Tributary Monitoring Reservoir Monitoring Additional Phosphorus Evaluation Sites Sediment Monitoring SOURCE ASSESSMENT Phosphorus Sources Point Sources Nonpoint Sources Spatial Framework Analysis Framework Water Quality Model Selection Model Simulation Period Calibration Results Page i
5 4.3.4 Existing Conditions Model Results Analysis of Baseline Phosphorus and Sediment Loading Nonpoint Source Loading Point Source Loading Seasonality POLLUTANT LOADING CAPACITY Linking Pollutant Loading to Concentration Critical Conditions Rivers and Streams Lakes and Reservoirs Allowable Watershed Loads Site-Specific Criteria and Load Capacity Analysis POLLUTANT LOAD ALLOCATIONS TMDL Equation Load Allocation Approach Load Allocations Background Sources Agricultural Sources Non-permitted Urban Sources Wasteload Allocation Permitted Municipal and Industrial Wastewater Discharges General Permits Permitted Municipal Separate Storm Sewer Systems Concentrated Animal Feeding Operations Margin of Safety Reserve Capacity Seasonal Variation TMDL IMPLEMENTATION Implementation Planning Reasonable Assurances for Point Sources Reasonable Assurances for Nonpoint Sources Statewide Agricultural Performance Standards & Prohibitions County Agricultural Performance Standards & Prohibitions WDNR Cost-Sharing Grant Programs Targeted Runoff Management (TRM) Grant Program Notice of Discharge (NOD) Grants Program Lake Management Planning Grants Lake and River Protection Grants DATCP Soil & Water Resource Management Program DATCP Producer Led Watershed Protection Grants Program Federal Programs Water Quality Trading & Adaptive Management Phosphorus Multi-Discharger Variance (MDV) Healthy Soil, Healthy Water Partnership Post-Implementation Monitoring Page ii
6 Statewide Tracking Database Implementation of Current TMDL Allocations and SSC Based Allocations PUBLIC PARTICIPATION Wisconsin River Symposium Invited Presentations at Stakeholder Sponsored Meeting Technical Meetings & Webinars Draft TMDL Model Review Other Stakeholder Meetings & Webinars Wisconsin River TMDL GovDelivery Subscription List Draft TMDL Allocations and Draft TMDL Review Public Informational Hearing REFERENCES List of Figures Figure 1. TMDL project area... 1 Figure 2. Project area regions... 1 Figure 3. Total phosphorus impaired waters: lower region Figure 4. Total phosphorus impaired waters: central region Figure 5. Total phosphorus impaired waters: upper region Figure 6. Total phosphorus impaired waters: headwaters region Figure 7. Agricultural areas Figure 8. Tribal lands Figure 9. Ecological landscapes Figure 10. Main stem monitoring: median total phosphorus Figure 11. Tributary monitoring: median total phosphorus Figure 12. Reservoir monitoring: geomean total phosphorus Figure 13. Reservoir monitoring: geomean Chlorophyll-a Figure 14. Reservoir monitoring: geomean Chlorophyll-a, exceedance frequency Figure 15. TMDL Subbasins: lower region Figure 16. TMDL Subbasins: central region Figure 17. TMDL Subbasins: upper region Figure 18. TMDL Subbasins: headwaters region Figure 19. Locations of permitted MS4s Figure 20. Defining land cover and land management in agricultural areas Figure 21. Discharge on the WI River between Merrill and Prairie Du Sac Figure 22. TP load on the WI River between Merrill and Prairie Du Sac Figure 23. TP load delivered by major tributary watersheds Figure 24. TP yields per subbasin Figure 25. Sources of TP loads Figure 26. Locations of wastewater treatment facilities: lower region Figure 27. Locations of wastewater treatment facilities: central region Figure 28. Locations of wastewater treatment facilities: upper region Figure 29. Locations of wastewater treatment facilities: headwaters region Figure 30. Locations of permitted MS4s: lower region Page iii
7 Figure 31. Locations of permitted MS4s: central region Figure 32. Locations of permitted MS4s: upper region Figure 33. Boxplots showing intra-annual pollutant variability Figure 34 Locations of CAFOs: lower region Figure 35. Locations of CAFOs: central region Figure 36. Locations of CAFOs: upper region Figure 37. Flow-weighted mean, growing-season median ratio Figure 38. Allocation approach when baseline load is above allowable load Figure 39. Allocation approach when baseline load is below allowable load Figure 40. Allocation approach for reach with a reservoir Figure 41. Counties with manure storage ordinances List of Tables Table 1. Total phosphorus impaired river and stream segments... 4 Table 2. Sediment/total suspended solids impaired river and stream segments Table 3. Phosphorus impaired lakes addressed by TMDL Table 4. Wisconsin numeric phosphorus criteria Table 5. Recommended site-specific phosphorus criteria Table 6. Tribal lands Table 7. Criteria for siting hydrologic break points Table 8. Descriptions of models used to determine baseline pollutant loads Table 9. List of permitted MS4s Table 10. Average annual ( ) discharge, total phosphorus (TP) load, and estimated TP delivery fractions for main stem WI river monitoring stations Table 11. Watershed model performance benchmarks for a monthly time step Table 12. Final fit statistics of streamflow, total suspended solids (TSS), and total phosphorus (TP) after bias correction Table 13. Permitted MS4 area by TMDL subbasin Table 14. List of CAFOs Table 15. WI river tributary monitoring stations used to convert from annual flow-weighted mean (FWM) to growing-season median (GSM) total phosphorus concentration Table 16. Summary of current loading and loading capacity for total phosphorus (TP) in WI River Basin impaired lakes and reservoirs Table 17. County Land and Water Plan update schedule Table 18. Draft TMDL products accessible for external review during development Table 19. Wisconsin River TMDL GovDelivery list bulletins List of Appendices Appendix A Tributary Information and Charts Appendix B Lakes Requiring Additional Evaluation Appendix C Site-Specific Criteria Analysis Appendix D Watershed Modeling Documentation Appendix E Sediment Monitoring Appendix F Baseline Load Appendix G MS4 Detail Maps Appendix H Total Phosphorus Loading Capacity of Petenwell and Castle Rock Flowages Page iv
8 Appendix I BATHTUB and Empirical Lake Models Appendix J Allocations Appendix K Proposed Site-Specific Criteria Allocations Appendix L Watershed Implementation Activities Appendix M CE-QUAL-W2 Reservoir Model Appendix N Agricultural Targets Appendix O Trading and Adaptive Management Information Appendix P Response To Preliminary Comments (February 21 to April 23, 2018 Comment Period) Appendix Q Public Hearing Comments (August 20 through September 19, 2018 comment period) Appendix R Response to Public Hearing Comments (August 20 through September 19, 2018 comment period) Page v
9 List of Acronyms and Terms 303(d) List List of Impaired Waters AM BMPs CAFO CREP CRP DATCP DO FAL FSA LA LAL LCD LFF LWRM ml MOS MS4 NCCW NOD NPS Program NRCS PI POTW RC WinSLAMM SWAT Wisconsin s Watershed Adaptive Management Option Best Management Practices Concentrated Animal Feeding Operation Conservation Reserve Enhancement Program Conservation Reserve Program Department of Agriculture, Trade, and Consumer Protection Dissolved Oxygen Fish and Aquatic Life Farm Service Agency Load Allocation Limited Aquatic Life Land Conservation Department Limited Forage Fish Land and Water Resources Management milliliters Margin of Safety Municipal Separate Storm Sewer System Noncontact Cooling Water Notice of Discharge Nonpoint Source Pollution Abatement Program Natural Resources Conservation Service Phosphorus Index Publicly Owned Treatment Works Reserve Capacity Source Loading and Management Model Soil and Water Assessment Tool Page vi
10 TBEL TMDL TP TRM TSS US EPA USGS WDNR WisCALM WisDOT WLA WPDES WQBEL WQT WVIC WWSF WWTF Technology-Based Effluent Limit Total Maximum Daily Load Total Phosphorus Targeted Runoff Management Total Suspended Solids United States Environmental Protection Agency United States Geological Survey Wisconsin Department of Natural Resources Wisconsin Consolidated Assessment and Listing Methodology Wisconsin Department of Transportation Wasteload Allocation Wisconsin Pollutant Discharge Elimination System Water Quality-Based Effluent Limit Water Quality Trading Wisconsin Valley Improvement Company Warm Water Sport Fish Wastewater Treatment Facility Page vii
11


12 1 INTRODUCTION Federal TMDL Program Section 303(d) of the Federal Clean Water Act (CWA) requires each state to identify impaired waters within its boundaries; impaired waters are those not meeting water quality standards for any given pollutant applicable to the water s designated uses. Section 303(d) further requires that states develop a Total Maximum Daily Load (TMDL) for all pollutants violating or causing violation of applicable water quality standards for each impaired water body. A TMDL is the maximum amount of pollutant that a water body is capable of assimilating while continuing to meet the existing water quality standards. In April of 1991, the United States Environmental Protection Agency (EPA) Office of Water s Assessment and Protection Division published Guidance for Water Quality-based Decisions: The Total Maximum Daily Load (TMDL) Process. In July 1992, EPA published the final Water Quality Planning and Management Regulation (40 CFR Part 130). Together, these documents describe the roles and responsibilities of EPA and the states in meeting the requirements of Section 303(d) of the Federal Clean Water Act (CWA) as amended by the Water Quality Act of 1987, Public Law FIGURE 1. TMDL PROJECT AREA Under a TMDL, pollutant allocations are set at the levels necessary to meet the applicable standards for all point and nonpoint sources causing impairment, with consideration given to seasonal variations and margin of safety. TMDLs provide the framework that allows states to establish and implement pollution control and management plans, with the goal indicated in Section 101(a)(2) of the CWA: water quality which provides for the protection and propagation of fish, shellfish, and wildlife, and recreation in and on the water, wherever attainable Wisconsin River TMDL Project The Wisconsin River TMDL project area encompasses the Wisconsin River Basin from the Lake Wisconsin dam near Prairie Du Sac, WI to the basin s headwaters in Vilas, County, WI (Figure 1). The TMDL project area encompasses 9,156 square miles, including all or portions of the following 22 counties: Adams, Clark, Columbia, Dane, Forest, Jackson, Juneau, Langlade, Lincoln, Marathon, Monroe, Oneida, Portage, Price, Richland, Sauk, Shawano, Taylor, Vernon, Vilas, Waushara, and Wood. Twenty-four major tributaries, and additional smaller ones, drain into the main stem of the river (see Figure 3A in Section 1.3) The river system includes 25 hydroelectric dams on the main stem of the river and 21 tributary storage reservoirs that regulate flow on the river s main stem. Summary information by tributary is illustrated in Appendix A. Because of the size of the project area, many of the map figures of the project area included in this report are divided into four regions the lower, FIGURE 2. PROJECT AREA central, upper and headwaters project areas; these figure regions are REGIONS illustrated in Figure 2. The lower region includes the tributaries that drain to the Wisconsin River below Castle Rock and Petenwell reservoirs and extends to the outlet of Lake Wisconsin. The Central region spans the area downstream of the Lake DuBay dam to the Page 1
13 area upstream of, and including, Castle Rock Lake. The Upper region spans the area that drains to Lake DuBay up to the point where the Spirit River Reservoir discharges into the Wisconsin River. The Headwaters region includes everything upstream of the Upper region, where the Spirit River Reservoir discharges into the river. Many lakes, rivers, and streams in the Wisconsin River Basin are impaired by excessive phosphorus. These impairments lead to nuisance algae growth, oxygen depletion, water clarity problems and reduced submerged aquatic vegetation in lakes, excessive beds of submerged aquatic vegetation in streams, and degraded habitat. They also adversely affect fish and other aquatic life, recreation, and navigation. This document establishes a framework for addressing these impairments, through the development of TMDLs for total phosphorus (TP). Problem Statement Phosphorus, an essential nutrient for plant growth, is problematic for aquatic ecosystems when present in large amounts because it fertilizes the growth of excessive algae blooms and other plant growth in aquatic systems. Algal blooms, particularly those that form surface scums, are unsightly and can have unpleasant odors, making recreational use of the water body unpleasant, affecting the quality of life of the people who live and work nearby. Algae blooms that include toxic blue-green algae or cyanobacteria can be harmful to fish and pose health risks to humans. When algal blooms die, the decomposition of the organic matter depletes the supply of dissolved oxygen in the water and depending on the severity of a low dissolved oxygen event, fish kills can occur. Overabundant growth of aquatic plants can also lead to many other undesirable consequences. For example, mats of filamentous algae and duckweed can block sunlight from penetrating the water, choking out beneficial submerged aquatic vegetation. Large areas of excessive vegetative growth can inhibit use of the water for fishing, boating, and swimming. These environmental impacts have negative economic impacts to local communities and the state. Water bodies can also be impaired by excess sediment loading. Sediment that is suspended in the water scatters and absorbs sunlight, reducing the amount of light that reaches submerged aquatic vegetation, which reduces its photosynthetic rate and growth. Bottom-rooted aquatic plants (called macrophytes) produce lifegiving oxygen, provide food and habitat for fish and other aquatic life, stabilize bottom sediments, protect shorelines from erosion, and take up nutrients that would otherwise contribute to nuisance algae growth. As photosynthetic rates decrease, less oxygen is released into the water by the plants. If light is completely blocked from bottom dwelling plants, the plants will stop producing oxygen and will die. As the plants are decomposed, bacteria will use up even more oxygen from the water. Reduced water clarity can also have direct impacts on aquatic fauna, including fish, waterfowl, frogs, turtles, and insects. Suspended sediments interfere with the ability of fish and waterfowl to see and catch food and can clog the gills of fish and invertebrates, making it difficult for them to breathe. When sediments settle to the bottom of a river, they can smother the eggs of fish and aquatic insects, as well as suffocate newly hatched insect larvae. Settling sediments can also fill in spaces between rocks, which could have been used by aquatic organisms for homes. Excess sediments can also cause an increase in surface water temperature because the sediment particles absorb heat from sunlight. This can cause dissolved oxygen levels to fall even farther (warmer waters hold less dissolved oxygen), and further harm aquatic life. In addition to its direct effects, sediment may also carry nutrients, heavy metals and other pollutants into water bodies. A large proportion of the phosphorus that moves from land to water is attached to sediment particles. In general, this means that managing sediment sources can help manage phosphorus sources (Sharpley et al., 1990). Through monitoring and assessment, the Wisconsin Department of Natural Resources (WDNR) has identified all or part of 73 streams, covering 120 individual segments/assessment units in the Wisconsin River Basin, as impaired due to phosphorus pollution, and has listed these on the state s (d) Impaired Waters List. Page 2
14 The Department has also identified nine lakes in the project area as impaired due to phosphorus that will be addressed by this TMDL. Phosphorus impaired rivers and streams addressed by this TMDL are listed in Table 1. Total phosphorus impaired river and stream segments. Rivers and streams impaired by sediment and TSS are listed in Table 2. Sediment/total suspended solids impaired river and stream segments. Lakes and reservoirs impaired by phosphorus and addressed by this TMDL are listed in Table 3. Phosphorus impaired lakes addressed by TMDL. These impairments are illustrated in Figure 3 through Figure 6. This information is also shown by tributary basin in Appendix A. The analysis method employed in this TMDL divided the Wisconsin River Basin into smaller subbasins. Each of these subbasins, approximately the size of a 12-digit federal hydrologic unit code (HUC-12) watershed, has an allocated load for phosphorus based on the phosphorus criteria for the waterbodies in that subbasin and to address more stringent downstream water quality criteria. The delineation of these subbasins often directly corresponds with the spatial extent of impaired river and stream segments or the contributory drainage areas of impaired lakes; however, subbasins were also delineated for waterbodies not listed as impaired. Thus, allocations were assigned to subbasins with listed and unlisted waterbodies. The resulting system of subbasin allocations provide protection ensuring that allocated loads meet promulgated water quality criteria for all waterbodies within the subbasin as well as downstream waterbodies. If future monitoring determines that additional river or stream segments within a subbasin are impaired, these impaired segments can be added to Wisconsin s future 303(d) Impaired Waters Lists under Category 5B: impaired waters with an approved TMDL or restoration plan. There are some lakes in the Wisconsin River Basin that are not explicitly addressed by the TMDL. These lakes are listed as impaired for reasons possibly related to excessive phosphorus, even though phosphorus is not specifically identified as the pollutant causing their impairment. These lakes are listed and discussed in Appendix B. These lakes and reservoirs will require further evaluation to determine if the allocations listed in Appendix J will be sufficient to achieve water quality standards for the lakes or if more detailed studies, sitespecific restoration plans, adoption of site-specific criteria (SSC), or other measures will be needed to achieve water quality goals. Most of these lakes are in the headwaters of the Wisconsin River where there are limited agricultural nonpoint sources of phosphorus and very few point sources. While implementation of the phosphorus allocations assigned in the TMDL are likely to result in water quality improvements, additional evaluation of phosphorus sources beyond the scope and scale of this TMDL, such as failing septic systems and stabilization and restoration of shore land buffers, are all potential avenues that will need to be explored in lake specific management plans. This report identifies the TMDLs, load allocations, and recommended management actions that will help restore water quality in the Wisconsin River Basin for phosphorus impaired waterways. Sediment and TSS impaired streams and rivers have not been assigned explicit allocations and are therefore not explicitly addressed in this TMDL. The sediment and TSS impaired segments listed in Table 2. Sediment/total suspended solids impaired river and stream segments are impaired due to nonpoint sources of sediment and TSS; there are not permitted point sources upstream of or discharging directly to these segments that cause or contribute to the sediment and TSS impairments. It is reasonable to expect that TMDL implementation actions that reduce TP to acceptable levels will also reduce TSS loads. Based on the lack of numeric sediment and TSS criteria for streams and rivers it is recommended that the segments listed in Table 2. Sediment/total suspended solids impaired river and stream segments rely on a combination of nonpoint phosphorus reductions along with the development of 9-Key Element Plans to reduce nonpoint sediment and TSS loads to an extent sufficient to achieve designated fish and other aquatic life uses. Page 3
15 T a b l e 1. To t a l p h o s p h o r u s i m p a i r e d r i v e r a n d s t r e a m s e g m e n t s Waterbody Start Mile End Mile Counties Assessment Unit WBIC Pollutants Impairments 1 Phosphorus Criteria 2 (µg/l) Fish & Aquatic Life Designated Use (proposed DU, if different) 3 TMDL Subbasin(s) Baraboo River Sauk, Columbia Total Phosphorus Water Quality Use Restrictions 100 Default FAL 4, 137, 179, Lower Baraboo Figure Region Tributary Watershed Baraboo River Sauk Total Phosphorus Impairment Unknown 100 Default FAL 5, 179, 180, 184, 231 Lower Baraboo Baraboo River Juneau, Sauk Total Phosphorus Impairment Unknown 100 Default FAL , 227 Lower Baraboo Baraboo River Juneau Total Phosphorus Impairment Unknown 100 Default FAL 187,274 Lower Baraboo Baraboo River Juneau Total Phosphorus Impairment Unknown 100 Default FAL* 27 Lower Baraboo Baraboo River Monroe Total Phosphorus Impairment Unknown 100 Cold 28, 189 Lower Baraboo Bear Creek Juneau, Monroe Total Phosphorus Degraded Biological Community 75 Default FAL 51, 52 Lower Lemonweir Bear Creek Portage, Wood Total Phosphorus Water Quality Use Restrictions 75 Default FAL 78 Central Mill Beaver Creek 0 4 Wood Total Phosphorus Water Quality Use Restrictions 75 Default FAL 307 Central Yellow Beaver Creek Wood Total Phosphorus Water Quality Use Restrictions 75 Default FAL 307 Central Yellow Beaver Creek 0 4 Juneau, Monroe Total Phosphorus Impairment Unknown 75 Default FAL 53 Lower Lemonweir Big Eau Pleine River Marathon Total Phosphorus Low DO 75 WWSF 87, 88 Upper Big Eau Pleine Big Eau Pleine River Marathon Total Phosphorus Low DO 75 WWSF 327 Upper Big Eau Pleine Big Eau Pleine River Marathon Total Phosphorus Low DO 75 WWSF 91, 152, 324 Upper Big Eau Pleine Big Rib River Taylor Total Phosphorus Impairment Unknown 75 Cold 276 Upper Rib Big Rib River Taylor Total Phosphorus Impairment Unknown 75 Default FAL 276 Upper Rib Black Creek Marathon Total Phosphorus Impairment Unknown 75 Default FAL 102, 215 Upper Rib Black Creek Marathon Total Phosphorus Impairment Unknown 75 Cold 104 Upper Rib Brewer Creek Juneau Total Phosphorus Degraded Biological Community, Impairment Unknown 75 Cold 43, 44 Lower Lemonweir 1 Water Quality Use Restrictions = TP criteria were overwhelmingly exceeded (1.5 times the criteria for lakes and 2 times the criteria for rivers/streams); Degraded Biological Community = In addition to TP exceedance biological impairment was shown (poor macroinvertebrate and/or fish Index of Biological Integrity (IBI) scores); Impairment Unknown = TP exceeded criteria but no biological impairment was shown (either no biological data or all IBIs were fair excellent); Low DO = Low dissolved oxygen 2 Phosphorus criteria (µg/l): The waterbody s applicable phosphorus criterion under s. NR , Wis. Admin. Code. 3 Fish & Aquatic Life Designated Use Status: This column indicates the waterbody s current Fish & Aquatic Life (FAL) Designated Use (DU) subcategory. If the DU has an asterisk behind it, that indicates that the waterbody was classified as Trout Class III before 1980, and may or may not be proposed as Cold in future DU revisions. Acronyms within this column are as follows: FAL=Fish & Aquatic Life; LFF=Limited Forage Fish; LAL=Limited Aquatic Life; WWSF=Warmwater Sport Fish; default FAL = Default Fish & Aquatic Life Page 4
16 T a b l e 1. To t a l p h o s p h o r u s i m p a i r e d r i v e r a n d s t r e a m s e g m e n t s Total Maximum Daily Loads for Total Phosphorus in the Wisconsin River Basin Waterbody Start Mile End Mile Counties Assessment Unit WBIC Pollutants Impairments 1 Phosphorus Criteria 2 (µg/l) Fish & Aquatic Life Designated Use (proposed DU, if different) 3 TMDL Subbasin(s) Brewer Creek Juneau Total Phosphorus Impairment Unknown 75 Cold 44 Lower Lemonweir Cat Creek 0 2 Wood Total Phosphorus Water Quality Use Restrictions 75 Default FAL 65 Central Yellow Figure Region Tributary Watershed Cazenovia Branch Richland, Sauk Total Phosphorus Impairment Unknown 75 Default FAL 310 Lower Baraboo Cleaver Creek 0 5 Juneau Total Phosphorus Water Quality Use Restrictions 75 Default FAL 26 Lower Baraboo Copper Creek 0 6 Sauk Total Phosphorus Council Creek Monroe Total Phosphorus Degraded Biological Community Degraded Biological Community 75 Default FAL 8 Lower Baraboo 75 Default FAL 55 Lower Lemonweir Crossman Creek Juneau, Sauk Total Phosphorus Impairment Unknown 75 Default FAL 17 Lower Baraboo Crossman Creek Juneau Total Phosphorus Impairment Unknown 75 Default FAL 19 Lower Baraboo Dawes Creek Wood Total Phosphorus Impairment Unknown 75 Default FAL 62 Central Yellow Deer Creek Taylor Total Phosphorus Water Quality Use Restrictions 75 Default FAL 98 Upper Big Eau Pleine Dell Creek Sauk Total Phosphorus Impairment Unknown 75 Default FAL 31 Lower Lower WI Dell Creek Sauk Total Phosphorus Impairment Unknown 75 Cold 32 Lower Lower WI Dell Creek Sauk Total Phosphorus Impairment Unknown 75 Cold 32 Lower Lower WI Dell Creek Juneau Total Phosphorus Impairment Unknown 75 Default FAL 33 Lower Lower WI Dill Creek 0 8 Marathon Total Phosphorus Water Quality Use Restrictions 75 Default FAL 93 Upper Big Eau Pleine Dill Creek 8 20 Clark, Marathon Total Phosphorus Water Quality Use Restrictions 75 LFF 95 Upper Big Eau Pleine Duck Creek 0 12 Columbia Total Phosphorus Impairment Unknown 75 Default FAL 3 Lower Lower WI E Br Big Eau Pleine River 0 11 Marathon Total Phosphorus Water Quality Use Restrictions 75 Default FAL 99 Upper Big Eau Pleine East Br Big Creek 0 7 Juneau, Sauk Total Phosphorus Degraded Biological Community 75 Default FAL 15 Lower Baraboo Fenwood Creek Marathon Total Phosphorus Impairment Unknown 75 Default FAL 89, 326 Upper Big Eau Pleine Fenwood Creek Marathon Total Phosphorus Impairment Unknown 75 Default FAL 90 Upper Big Eau Pleine Hamann Creek 0 10 Marathon Total Phosphorus Impairment Unknown 75 Default FAL 92 Upper Big Eau Pleine Page 5
17 T a b l e 1. To t a l p h o s p h o r u s i m p a i r e d r i v e r a n d s t r e a m s e g m e n t s Waterbody Start Mile End Mile Counties Assessment Unit WBIC Pollutants Impairments 1 Hay Creek Sauk Total Phosphorus Hemlock Creek Wood Total Phosphorus Hills Creek 0 10 Juneau, Vernon Total Phosphorus Degraded Biological Community Degraded Biological Community, Impairment Unknown Degraded Biological Community Phosphorus Criteria 2 (µg/l) Fish & Aquatic Life Designated Use (proposed DU, if different) 3 TMDL Subbasin(s) Figure Region Tributary Watershed 75 Cold 9 Lower Baraboo 75 Default FAL/LFF for section from Vesper Dam to Dawes Creek. 62, 201 Central Yellow 75 Default FAL 21 Lower Baraboo Hulbert Creek Sauk Total Phosphorus Impairment Unknown 75 Cold 243 Lower Lower WI Lemonweir River Juneau Total Phosphorus Impairment Unknown 100 Default FAL 36, 244, 245 Lower Lemonweir Lemonweir River Juneau Total Phosphorus Impairment Unknown 100 Default FAL 45 Lower Lemonweir Lemonweir River Juneau, Monroe Total Phosphorus Impairment Unknown 100 Default FAL 195, 197, 306 Lower Lemonweir Little Baraboo River Richland, Sauk Total Phosphorus Little Bear Creek Wood Total Phosphorus Degraded Biological Community Degraded Biological Community, Impairment Unknown Little Bear Creek Wood Total Phosphorus Impairment Unknown 75 Little Eau Pleine River Marathon, Portage Total Phosphorus Degraded Biological Community 75 Default FAL 14, 301 Lower Baraboo 75 Default FAL 79 Upper Default FAL with portions listed as LFF and LAL in NR , 211 Upper 75 Default FAL 80, 150 Upper Little Eau Pleine River Clark, Marathon Total Phosphorus Water Quality Use Restrictions 75 Default FAL 85, 212, 213 Upper Little Hemlock Creek Wood Total Phosphorus Water Quality Use Restrictions 75 Default FAL 62 Central Yellow Little Eau Pleine Little Eau Pleine Little Eau Pleine Little Eau Pleine Little Hoten Creek Juneau Total Phosphorus Impairment Unknown 75 Cold 48 Lower Lemonweir Little Hoton Creek Juneau Total Phosphorus Impairment Unknown 75 Cold 48 Lower Lemonweir Little Lemonweir River Juneau Total Phosphorus Impairment Unknown 75 Default FAL 47 Lower Lemonweir Little Lemonweir River Juneau Total Phosphorus Impairment Unknown 75 Default FAL 47, 48, 196 Lower Lemonweir Little Lemonweir River Juneau, Monroe Total Phosphorus Impairment Unknown 75 Cold 49 Lower Lemonweir Little Lemonweir River Monroe Total Phosphorus Impairment Unknown 75 Cold 50 Lower Lemonweir Lyndon Creek 0 6 Juneau Total Phosphorus Impairment Unknown 75 Default FAL* 34, 192 Lower Lower WI Page 6
18 T a b l e 1. To t a l p h o s p h o r u s i m p a i r e d r i v e r a n d s t r e a m s e g m e n t s Total Maximum Daily Loads for Total Phosphorus in the Wisconsin River Basin Waterbody Start Mile End Mile Counties Assessment Unit WBIC Pollutants Impairments 1 Phosphorus Criteria 2 (µg/l) Fish & Aquatic Life Designated Use (proposed DU, if different) 3 TMDL Subbasin(s) Lyndon Creek Juneau Total Phosphorus Impairment Unknown 75 Default FAL* 35 Lower Lower WI Mill Creek Portage Total Phosphorus Low DO 75 Default FAL 78, 146 Central Mill Mill Creek Wood, Portage Total Phosphorus Low DO 75 Default FAL 207, 332 Central Mill Figure Region Tributary Watershed Mill Creek Monroe Total Phosphorus Impairment Unknown 75 Cold 58, 305 Lower Lemonweir Mink Creek Taylor Total Phosphorus Impairment Unknown 75 Cold 276 Upper Rib Narrows Creek 0 23 Sauk Total Phosphorus Impairment Unknown 75 Default FAL 7, 181, 183 Lower Baraboo North Br Duck Creek Columbia Total Phosphorus Water Quality Use Restrictions 75 Default FAL 2, 177 Lower Lower WI Onemile Creek Juneau Total Phosphorus Impairment Unknown 75 Default FAL 38 Lower Lemonweir Onemile Creek Juneau Total Phosphorus Impairment Unknown 75 Default FAL* 39 Lower Lemonweir Onemile Creek Juneau Total Phosphorus Impairment Unknown 75 Cold 40 Lower Lemonweir Onemile Creek Juneau Total Phosphorus Impairment Unknown 75 Cold 41 Lower Lemonweir Onemile Creek Juneau Total Phosphorus Impairment Unknown 75 Cold 42 Lower Lemonweir Plum Creek 0 8 Sauk Total Phosphorus Impairment Unknown 75 Default FAL 18 Lower Baraboo Puff Creek Wood Total Phosphorus Degraded Biological Community 75 Default FAL 307 Central Yellow Raeder Creek 0 3 Marathon Total Phosphorus Impairment Unknown 75 Default FAL 96 Upper Big Eau Pleine Randall Creek 9 10 Marathon Total Phosphorus Water Quality Use Restrictions 75 Default FAL 97 Upper Big Eau Pleine Randall Creek 0 9 Marathon Total Phosphorus Water Quality Use Restrictions 75 Default FAL? 94 Upper Big Eau Pleine Rocky Creek Wood Total Phosphorus Impairment Unknown 75 Default FAL 66 Central Yellow Scotch Creek Marathon Total Phosphorus Impairment Unknown 75 Default FAL 101 Upper Rib Scotch Creek Marathon Total Phosphorus Impairment Unknown 75 LFF 106 Upper Rib Scotch Creek Marathon Total Phosphorus Impairment Unknown 75 Default FAL 105 Upper Rib Seeley Creek Sauk Total Phosphorus Impairment Unknown 75 Default FAL 6 Lower Baraboo Page 7
19 T a b l e 1. To t a l p h o s p h o r u s i m p a i r e d r i v e r a n d s t r e a m s e g m e n t s Waterbody Start Mile End Mile Counties Assessment Unit WBIC Pollutants Impairments 1 Phosphorus Criteria 2 (µg/l) Fish & Aquatic Life Designated Use (proposed DU, if different) 3 TMDL Subbasin(s) Figure Region Tributary Watershed Sevenmile Creek 0 15 Juneau Total Phosphorus Impairment Unknown 75 Default FAL 37 Lower Lemonweir Seymour Creek Juneau Total Phosphorus Impairment Unknown 75 Default FAL* 23 Lower Baraboo Seymour Creek Juneau, Vernon Total Phosphorus Impairment Unknown 75 Default FAL 24 Lower Baraboo Seymour Creek Monroe, Vernon Total Phosphorus Impairment Unknown 75 Default FAL* 25 Lower Baraboo Silver Creek Sauk Total Phosphorus Low DO, Degraded Habitat 75 Default FAL 12 Lower Baraboo South Br Creek (S Br Baraboo) Vernon Total Phosphorus Impairment Unknown 75 Default FAL 22 Lower Baraboo South Fork Lemonweir River Monroe Total Phosphorus Low DO, Degraded Biological Community 75 Default FAL 54 Lower Lemonweir South Fork Lemonweir River Monroe Total Phosphorus Impairment Unknown 75 Default FAL 56, 57 Lower Lemonweir Spring Brook Creek Langlade, Marathon Total Phosphorus Degraded Biological Community 75 Default FAL (Cold) 107, 216 Upper Eau Claire Spring Brook Creek Langlade Total Phosphorus Low DO 75 Default FAL 216 Upper Eau Claire Squaw Creek 0 9 Tributary to the South Branch of Yellow River Marathon, Wood Total Phosphorus Impairment Unknown 75 LFF (FAL) 84 Upper Clark Total Phosphorus Water Quality Use Restrictions 75 LAL (FAL) 71 Central Yellow Twin Creek 0 9 Sauk Total Phosphorus Impairment Unknown 75 Default FAL 11 Lower Baraboo Little Eau Pleine Unnamed Creek Wood Total Phosphorus Water Quality Use Restrictions 75 Default FAL 72 Central Yellow Unnamed Creek (T23N,R3E,S10,SESW,72) Unnamed Creek (T23N,R3E,S10,SESW,72) Page Wood Total Phosphorus Impairment Unknown 75 Default FAL 67, 72 Central Yellow 3 5 Wood Total Phosphorus Impairment Unknown 75 Default FAL 72, 313 Central Yellow Unnamed Stream Wood Total Phosphorus Unnamed Stream Clark Total Phosphorus Unnamed Trib to Yellow River Unnamed Trib to Yellow River Degraded Biological Community Degraded Biological Community 75 Default FAL 67 Central Yellow 75 Default FAL 70 Central Yellow Wood Total Phosphorus Impairment Unknown 75 Default FAL 68 Central Yellow Clark Total Phosphorus Water Quality Use Restrictions 75 Default FAL 275 Central Yellow W Br Eau Claire River Langlade Total Phosphorus W Branch Big Eau Pleine River Marathon, Taylor Degraded Biological Community 75 Cold 108 Upper Eau Claire Total Phosphorus Water Quality Use Restrictions 75 LFF 98 Upper Big Eau Pleine
20 T a b l e 1. To t a l p h o s p h o r u s i m p a i r e d r i v e r a n d s t r e a m s e g m e n t s Total Maximum Daily Loads for Total Phosphorus in the Wisconsin River Basin Waterbody W Branch Big Eau Pleine River Start Mile End Mile Counties Assessment Unit WBIC Pollutants Impairments Taylor Total Phosphorus Degraded Biological Community Phosphorus Criteria 2 (µg/l) Fish & Aquatic Life Designated Use (proposed DU, if different) 3 TMDL Subbasin(s) Figure Region Tributary Watershed 75 Default FAL 100 Upper Big Eau Pleine West Br Baraboo River Juneau, Vernon Total Phosphorus Low DO 75 Default FAL 20, 138, 188 Lower Baraboo West Br Big Creek 0 8 Juneau, Sauk Total Phosphorus Impairment Unknown 75 Default FAL 13, 16 Lower Baraboo Wild Creek 0 10 Marathon Total Phosphorus Water Quality Use Restrictions 75 FAL 83, 328 Upper Wisconsin River (At Castle Rock Lake) Wisconsin River (At Petenwell Lake) Yellow River Adams/Juneau Total Phosphorus Low DO 40 WWSF 59 Central Central WI Adams/Juneau Total Phosphorus Clark, Juneau, Wood Yellow River Juneau Total Phosphorus Eutrophication, Degraded Biological Community Little Eau Pleine 40 WWSF 74 Central Central WI Total Phosphorus Water Quality Use Restrictions 75 FAL Warmwater 61, 140 Central Yellow Degraded Biological Community 75 Default FAL 60, 199 Central Yellow Yellow River Juneau, Wood Total Phosphorus Impairment Unknown 75 Default FAL 61,199 Central Yellow Yellow River Wood Total Phosphorus Water Quality Use Restrictions 75 FAL Warmwater 64, 200 Central Yellow Yellow River Wood Total Phosphorus Water Quality Use Restrictions 75 FAL Warmwater 250, 307 Central Yellow Yellow River Clark, Wood Total Phosphorus Water Quality Use Restrictions 75 FAL Warmwater 275 Central Yellow Yellow River Clark Total Phosphorus Water Quality Use Restrictions 75 FAL Warmwater 275 Central Yellow Yellow River-E. Branch Marathon, Wood Yellow River-S. Branch 0 18 Clark, Wood Total Phosphorus Total Phosphorus Impairment Unknown 75 Default FAL 275 Central Yellow Degraded Biological Community 75 Default FAL 69, 71 Central Yellow Page 9
21 T a b l e 2. S e d i m e n t / t o t a l s u s p e n d e d s o l i d s i m p a i r e d r i v e r a n d s t r e a m s e g m e n t s Waterbody (1) Start Mile End Mile Counties Babb Creek Sauk Crossman Creek Juneau, Sauk Silver Creek Sauk West Br Baraboo River Juneau, Vernon Assessment Unit WBIC Pollutants Impairments Sediment/Total Suspended Solids Sediment/Total Suspended Solids Sediment/Total Suspended Solids Sediment/Total Suspended Solids Phosphorus Criteria (µg/l) Fish & Aquatic Life Designated Use (proposed DU, if different) TMDL Subbasin(s) Figure Region Tributary Watershed Degraded Habitat 75 Default FAL 10 Lower Baraboo Degraded Habitat, Turbidity 75 Default FAL 17 Lower Baraboo Low DO, Degraded Habitat 75 Default FAL (LAL) 12 Lower Baraboo Low DO 75 Default FAL 20, 138, 188 Lower Baraboo (1) As described in Section Error! Reference source not found., the sediment/tss impaired river and stream segments listed have not been assigned allocations for sediment/tss and are not explicitly addressed in this TMDL study. It is recommended that 9-Key Element Plans be developed to address the nonpoint sources that cause and contribute to degraded habitat and turbidity. It is anticipated that the allocations for phosphorus will address the low DO impairments. Page 10
22 T a b l e 3. P h o s p h o r u s i m p a i r e d l a k e s a d d r e s s e d b y T M D L Total Maximum Daily Loads for Total Phosphorus in the Wisconsin River Basin Waterbody Size (Acres) Big Eau Pleine Reservoir 4,909 Castle Rock Reservoir 12,386 Petenwell Reservoir 23,001 Counties Marathon Adams, Juneau Adams, Juneau Assessment Unit WBIC Pollutants Impairments Classification Total Low DO, Eutrophication, Reservoir Deep Phosphorus Excess Algal Growth Lowland Kawaguesaga Lake 700 Oneida Minocqua Lake 1,339 Oneida Redstone Lake 612 Sauk Lake DuBay (1) 4,045 Marathon, Portage Lake Delton 249 Columbia Lake Wisconsin (2) 7,197 Sauk, Columbia Total Phosphorus Total Phosphorus Total Phosphorus Total Phosphorus Total Phosphorus Total Phosphorus Total Phosphorus Total Phosphorus Eutrophication, Water Quality Use Restrictions Low DO, Water Quality Use Restrictions Reservoir Shallow Lowland Reservoir Shallow Lowland Phosphorus Criteria (µg/l) Fish & Aquatic Life Designated Use 30 Default FAL 40 Default FAL 40 Default FAL Impairment Unknown Two-Story 15 Default FAL Impairment Unknown Two-Story 15 Default FAL Excess Algal Growth Excess Algal Growth Eutrophication, Water Quality Use Restrictions, Excess Algal Growth Low DO, Eutrophication, Recreational Restrictions - Blue Green Algae Reservoir Deep Lowland Reservoir Shallow Lowland 30 Default FAL 100 Default FAL Reservoir 40 Default FAL Impounded Flowing Water 100 Default FAL Recreational Use Full body contact Full body contact Full body contact Full body contact Full body contact Full body contact Full body contact Full body contact Full body contact TMDL Subbasin Figure Region Tributary Watershed 87 Upper Big Eau Pleine 59 Central Central WI 74 Central Central WI 135 Headwaters Tomahawk 134 Headwaters Tomahawk 13 Lower Baraboo 81 Upper Upper WI 30 Lower Lower WI 1 Lower Lower WI 1 While the 100 µg/l TP criterion for Lake DuBay of is not sufficient to remove the impairment of excessive algal growth (monitoring data indicates that the lake averages 90 µg/l and is still impaired), the TMDL analysis shows that resulting loads from the attainment of water quality criteria for Big Eau Pleine (criteria of 30 µg/l) coupled with reductions needed to meet downstream reservoirs will result in a phosphorus concertation for Lake DuBay sufficient to address the impairment of excessive algal growth (see Appendix C for details). Lake DuBay is predicted to have a summer mean concentration of 37 µg/l under the TMDL allocations and 45 µg/l under the site-specific allocations proposed in Appendix K. 2 The current TP criterion for Lake Wisconsin is not adequate to address the listed impairments; however, the allocations found in Appendix K corresponding with a SSC of 47 µg/l, as discussed in Appendix C, addresses the impairments. Page 11

23 FIGURE 3. TOTAL PHOSPHORUS IMPAIRED WATERS: LOWER REGION Page 12

24 FIGURE 4. TOTAL PHOSPHORUS IMPAIRED WATERS: CENTRAL REGION Page 13

25 FIGURE 5. TOTAL PHOSPHORUS IMPAIRED WATERS: UPPER REGION Page 14

26 FIGURE 6. TOTAL PHOSPHORUS IMPAIRED WATERS: HEADWATERS REGION Page 15
27 Narrative Water Quality Criteria All waters of the State of Wisconsin are subject to the following narrative water quality standard, as defined in s. NR (1), Wis. Adm. Code: To preserve and enhance the quality of waters, standards are established to govern water management decisions. Practices attributable to municipal, industrial, commercial, domestic, agricultural, land development or other activities shall be controlled so that all waters including the mixing zone and the effluent channel meet the following conditions at all times and under all flow conditions: (a) Substances that will cause objectionable deposits on the shore or in the bed of a body of water, shall not be present in such amounts as to interfere with public rights in waters of the state, (b) Floating or submerged debris, oil, scum or other material shall not be present in such amounts as to interfere with public rights in waters of the states, (c) Materials producing color, odor, taste or unsightliness shall not be present in such amounts as to interfere with public rights in waters of the state. Excessive phosphorus loading causes algal blooms in the Wisconsin River Basin, which may be characterized as floating scum, producing a green color, a strong odor and an unsightly condition. Sometimes these algal blooms contain toxins which limit recreational uses of the water bodies. Because of the low dissolved oxygen and degraded habitat impairments caused by TP, many designated fish and aquatic life uses are not supported in the waters of the Wisconsin River Basin. Numeric Water Quality Criteria To address the effects of excessive phosphorus, WDNR established numeric criteria for total phosphorus in surface waters in 2010 (s. NR , Wis. Adm. Code). These numeric criteria (Table 4. Wisconsin numeric phosphorus criteria) are based on relationships between phosphorus and designated uses of surface waters, which are summarized in the Wisconsin Phosphorus Water Quality Standards Criteria: Technical Support Document (December 2010). T a b l e 4. W i s c o n s i n n u m e r i c p h o s p h o r u s c r i t e r i a Flowing Waters 4 Reservoirs Rivers Streams Stratified Reservoirs, Hydraulic residence time 14 days Non-stratified Reservoirs, Hydraulic residence time 14 days 100 µg/l 75 µg/l 30 µg/l 40 µg/l Stratified, two-story fishery lakes Stratified seepage lakes Lakes Stratified drainage lakes Non-stratified lakes µg/l = microgram per liter 15 µg/l 20 µg/l 30 µg/l 40 µg/l Administrative code also specifies that a site-specific criterion may be adopted in place of the generally applicable criteria where site-specific data and analysis using scientifically defensible methods and sound scientific rationale demonstrate a different criterion is protective of the designated use of the specific surface water segment or waterbody (s. NR (7), Wis. Adm. Code). In the process of developing this TMDL, WDNR evaluated relationships between TP and recreational uses of impaired waters. These analyses indicate 4 Rivers and streams impounded by dams with hydraulic residence time < 14 days are classified as impounded flowing waters and given applicable river/stream criteria. Page 16
28 that site-specific criteria (SSC) may be appropriate for Petenwell, Castle Rock, and Lake Wisconsin (Table 5, see details of analysis in Appendix C). The potential for an SSC was also evaluated for Lake Du Bay but is not recommended at this time (see Appendix C). Because these recommended SSCs have not yet been promulgated and a TMDL must be based on promulgated narrative or numeric criteria, this TMDL contains two sets of TP allocations: one set for the current criteria located in Appendix J and another set for the recommended SSC located in Appendix K. Sections 5.6, 6.3, 6.4, and 7.6 provide additional discussion concerning the allocations and proposed implementation of the SSC-based allocations should the SSC become promulgated. T a b l e 5. R e c o m m e n d e d s i t e - s p e c i f i c p h o s p h o r u s c r i t e r i a Waterbody Name Waterbody Type Default TP Criterion Potential Site-Specific TP Criterion Petenwell Reservoir Non-stratified Reservoir 40 µg/l 53 µg/l Castle Rock Reservoir Non-stratified Reservoir 40 µg/l 55 µg/l Lake Wisconsin Impounded Flowing Water 100 µg/l 47 µg/l Revisions to other administrative codes supporting P criteria implementation went into effect concurrently with changes to ch. NR 102, Wis. Adm. Code. Chapter NR 217, Wis. Adm. Code, was revised to include procedures for translating numeric phosphorus criteria into water quality-based effluent limits (WQBELs) and incorporating those limits into Wisconsin Pollutant Discharge Elimination System (WPDES) permits. Chapter NR 151, Wis. Adm. Code revisions that went into effect concurrently with the changes to ch. NR 102, Wis. Adm. Code included new phosphorus index (P-Index) performance standards addressing phosphorus from agricultural lands. Designated Uses All waters of the state have the following designated uses: fish and aquatic life; recreation; wildlife; and public health and welfare. Additionally, there are five subcategories of the fish and aquatic life use, which reflect differences in the potential aquatic communities present in water bodies. These aquatic life communities may be adversely impacted by phosphorus and sediment. Section NR (3), Wis. Adm. Code, defines these use subcategories as follows: Fish and Other Aquatic Life Uses The department shall classify all surface waters into one of the fish and other aquatic life subcategories described in this subsection. Only those use subcategories identified in paragraphs (a) to (c) shall be considered suitable for the protection and propagation of a balanced fish and other aquatic life community as provided in the federal water pollution control act amendments of 1972, P.L ; 33 USC 1251 et. seq. TP criteria do not differ among these subcategories. a) Cold water communities. This subcategory includes surface waters capable of supporting a community of cold water fish and aquatic life or serving as a spawning area for cold water fish species. This subcategory includes, but is not restricted to, surface waters identified as trout water by the department of natural resources (Wisconsin Trout Streams, publication (80)). b) Warm water sport fish communities. This subcategory includes surface waters capable of supporting a community of warm water sport fish or serving as a spawning area for warm water sport fish. c) Warm water forage fish communities. This subcategory includes surface waters capable of supporting an abundant diverse community of forage fish and other aquatic life. Page 17
 Limited aquatic life. (Marginal surface waters).")
29 d) Limited forage fish communities. (Intermediate surface waters). This subcategory includes surface waters of limited capacity and naturally poor water quality or habitat. These surface waters are capable of supporting only a limited community of forage fish and other aquatic life. e) Limited aquatic life. (Marginal surface waters). This subcategory includes surface waters of severely limited capacity and naturally poor water quality or habitat. These surface waters are capable of supporting only a limited community of aquatic life. Most of the impaired water bodies in the Wisconsin River Basin are classified as warm water sport fish communities or warm water forage fish communities, and a few are classified as cold water communities. Table 1, Table 2, and Table 3 contain these designations for each impaired water body Recreational Uses All surface waters shall be suitable for supporting recreational use. A sanitary survey or evaluation, or both to assure protection from fecal contamination, is the chief criterion for determining the suitability of a water for recreational use. Recreational use of surface waters may also be impaired by excessive algae blooms, consistent with the narrative standard in s. NR (1), Wis. Adm. Code (see Section 1.4). Algae blooms can affect recreational use of surface waters by causing an unsightly appearance and disagreeable odor, and by producing substances that are toxic to humans and animals. Because numeric criteria for algae blooms do not exist, Wisconsin s Consolidated Assessment and Listing Methodology (WisCALM, describes methods for assessing this type of recreational water quality impairment. Recreational algal impairment thresholds apply to lakes, reservoirs, and large rivers. Chlorophyll-a concentration is used to assess algal impairment. Chlorophyll-a in deep lakes and reservoirs shall not exceed 20 µg/l more than 5% of the July 15 Sept 15 period. Chlorophyll-a in shallow lakes and reservoirs and large rivers shall not exceed 20 µg/l more than 30% of the July 15 Sept 15 period. 2 WATERSHED CHARACTERISTICS Wisconsin s namesake river, the Wisconsin River. is an important recreational, industrial, and natural resource to the State of Wisconsin. From its headwaters in Lac Vieux Desert in Vilas County to the outlet of Lake Wisconsin at Prairie du Sac Dam in Columbia County, the Wisconsin River travels 335 river miles flowing through diverse landscapes. The Wisconsin River watershed extends approximately 42 square miles into the state of Michigan. Tribal lands are also present in the Wisconsin River watershed. Phosphorus loading from these land areas have been identified, but no reductions are required due to their not being part of the state s jurisdiction. Also, in most cases these lands are not developed and consist of forest and wetland land cover and there are no point source discharges present. The extent of tribal lands is depicted in Table 6 and Figure 8. Agriculture is the predominant land use in many parts of the basin. The extent of agricultural areas in the basin is illustrated in Figure 7. The dominant type of agriculture varies from mixed dairy and cash cropping (continuous corn/corn soybean rotations) in the lower and upper basins, to potatoes, vegetables and cranberries in the central FIGURE 7. AGRICULTURAL AREAS Page 18
30 basin, and limited agriculture in the headwaters basin. Detailed maps of agricultural land use and land management throughout the project area are included in Section 3.2 of Appendix D. T a b l e 6. T r i b a l l a n d s F Tribe TMDL Subbasin Area (acres) Lac du Flambeau Ho-Chunk Nation Ho-Chunk Nation Ho-Chunk Nation Ho-Chunk Nation Ho-Chunk Nation Ho-Chunk Nation Ho-Chunk Nation Ho-Chunk Nation Ho-Chunk Nation Ho-Chunk Nation Ho-Chunk Nation Ho-Chunk Nation Ho-Chunk Nation Ho-Chunk Nation Ho-Chunk Nation Ho-Chunk Nation Ho-Chunk Nation Ho-Chunk Nation Ho-Chunk Nation Ho-Chunk Nation Ho-Chunk Nation Ho-Chunk Nation Ho-Chunk Nation FIGURE 8. TRIBAL LANDS Page 19

31 The State of the Lower Wisconsin River Basin Report (WDNR, 2002), The State of the Central Wisconsin River Basin Report (WDNR, 2002) and The Headwaters State of the Basin Report (WDNR, 2002) provide additional details on characteristics of the basin s watershed, including geography, geology, soils, meteorology, groundwater, and ecological and cultural resources. Ecological Landscapes The TMDL watershed spans six distinct ecological landscapes (WDNR 2012). The Western Coulee and Ridges in the southwest, the Central Sand Plains and Central Sand Hills in the central and southeast portion of the project area, the North Central Forest and Northern Highlands in the northern portion of the project area, and Forest Transition in the tension zone between the agricultural and forested landscapes (Figure 9). Each of these regions is described in more detail in the subsections below Western Coulees and Ridges. The southwest portion of the project area, including portions of Columbia, Monroe, Richland, Sauk, and Vernon counties, lies within the Western Coulees and Ridges ecological landscape. More commonly referred to as the driftless area, this area is characterized by the absence of glacial material or drift left during the most recent glaciation and is comprised of steep sided valleys and ridges with loess capped plateaus, deeply dissected by high-gradient streams. This area is mostly underlain by Paleozoic sandstones and dolomites of Cambrian and Ordovician age and covered by windblown loess of varying thicknesses. In contrast to the more recently glaciated areas of the state, this area has few lakes and a greater density of streams. Land cover in this area is predominantly comprised of forest and agriculture, with lesser amounts of grassland; wetlands are rare and occur mostly in river valleys. Primary forest cover is oak-hickory, while maplebasswood forests are common in areas not burned frequently before Euro- American settlement. With a mean growing season of 145 days, a mean annual temperature of 43.7 F, and mean annual precipitation of 32.6 inches, the climate of this ecoregion is favorable for agriculture. However, steep slopes limit intensive agricultural uses to broad ridge tops and parts of valleys above floodplains. Livestock and dairy farming is common in this area and have had a major impact on stream quality. The Cities of Baraboo and Reedsburg are located within this region of the TMDL project area Central Sand Plains The Central Sand Plains gets its name from the large, flat expanse of lacustrine and outwash sand deposited during the most recent glaciation. The Central Sand Plains are underlain by Late Cambrian sandstone containing strata of dolomite and shale. The mean growing season in the Central Sand Plains is 135 days, the mean annual temperature is 43.8 F, and the mean annual precipitation is 32.8 inches. The shorter growing season, occasional freezing temperatures during summer, sandy soils, and abundance of wetlands limits agriculture in this ecological landscape west of the Wisconsin River. Agriculture is more prevalent east of the Wisconsin River, with an emphasis on cool FIGURE 9. ECOLOGICAL LANDSCAPES Page 20
32 season crops such as potatoes, vegetable crops, and early maturing corn. Center pivot irrigation is common here because of the sandy soils and shallow aquifer Central Sand Hills Along the southeast and central-east edge of the project area is a narrow sliver of the ecological landscape Central Sand Hills, including portions of Columbia, Dane, Adams, Portage, Waushara and Waupaca counties. The Central Sand Hills are covered in glacial deposits including a mix of moraines, drumlins, till plains, outwash features, and lake plains originating from the most recent glaciation. Glacial sediment in this area is typically 50 to 100 feet thick and underlain by Cambrian sandstone bedrock. Soils are primarily sands in the northwestern portion and sandy loam tills in the southeast. The climate of Central Sand Hills is similar to the Central Sand Plains and Western Coulees and Ridges and is thus suitable for agricultural use. This ecological landscape area supports a mix of agriculture - primarily cropland, dairy operations, and woodland. Most of the original vegetation has been cleared with forested areas remaining only on steeper end moraines and poorly drained depressions. Many wetlands have been drained and used for agriculture here. Irregular till plains, end moraines, kettles, and drumlins are common, and wetlands are found throughout the region, especially along end morainal ridges. There are fewer lakes here than in ecoregions to the north, but considerably more than in the driftless area to the west Forest Transition The Forest Transition ecological landscape supports both northern forests and agricultural areas. Within the TMDL project area, this includes all of Marathon County and portions of Wood, Portage, Langlade, Lincoln, Clark and Taylor Counties. The central portion of the Forest Transition lies primarily on glacial till plain underlain Precambrian volcanic or metamorphic bedrock, or Cambrian sandstones with inclusions of dolomite and shale. Soils are predominantly non-calcareous, moderately well-drained sandy loams derived from glacial till, but there is considerable diversity in the range of soil attributes. The area includes sandy soils formed in outwash as well as organic soils and loam and silt loam soils on moraines. The average growing season is 133 days, average annual temperature is 41.9 F and annual average precipitation is 32.6 inches. Land cover is predominantly forest and agriculture with lesser amounts of grassland/pasture and wetlands. There is an adequate growing season and enough precipitation to support agricultural activity. Corn, small grains, and pastures are common land uses in many parts of this ecological landscape. However, growing conditions in the Forest Transition are not as favorable for row crop agriculture as in southern Wisconsin. Within this area, Wood, Portage, and Marathon counties have greater than half their population living in metropolitan areas, mostly on or near the Wisconsin River North Central Forest Forests cover approximately 75% of the North Central Forest ecological landscape. Mesic northern hardwood forest dominant, made up of sugar maple, basswood, and red maple, with some stands containing scattered hemlock, yellow birch, and/or eastern white pine pockets. The aspen-birch forest type group is also common. Forested and non-forested wetland communities are common and widespread. The landscape is characterized by 5 to 100-foot-thick glacial deposits, including end and ground moraines, kettle depressions and pitted outwash, underlain by igneous and metamorphic bedrock. Organic soils (peats and mucks) are common in poorly drained lowlands. Within the project area, this landscape includes portions of Forest, Lincoln, Langlade, Oneida, Vilas and Price Counties. Page 21
33 The mean growing season is 115 days, and the mean annual precipitation is 32.3 inches. The mean annual temperature is 40.3 F and summer temperatures can be cold or freezing at night in low-lying areas of the region, thereby limiting agricultural land use Northern Highlands The ecological landscape of Wisconsin River Basin Headwaters is primarily the Northern Highlands. This area is characterized by a globally significant concentration of glacial lakes and small connecting streams, rare aquatic species and extensive wetlands. Land cover is predominantly forest - including the state s greatest acreage of dry-mesic eastern white pine-red pine forests, wetlands, and lakes. There is a small amount of grassland and urban area, and limited agriculture. The Northern Highlands are underlain by igneous and metamorphic rock, generally covered by deposits of glacial drift from 5 feet to over 100 feet in depth. Most soils are sands and gravels, some with a loamy mantle. The climate is typical of northern Wisconsin, with a mean growing season of 122 days, mean annual temperature of 39.5 F, and mean annual precipitation of 31.6 inches. The tourism-oriented cities of Minocqua, Tomahawk and Eagle River are all located here. Page 22 Hydrology and Water Resources The Wisconsin River itself is only one component of the complex hydrologic network of water resources within the project area. The following sections of the report describe the various categories of waterways addressed by the TMDL, and their numeric phosphorus criteria Wisconsin River Main Stem The Wisconsin River originates at Lac Vieux Desert and from there to the Rhinelander Dam a numeric phosphorus criterion of 75 µg/l applies to the free-flowing portions of the river. Water quality is excellent, and portions of the upper river are classified as Outstanding and Exceptional Resource Waters in ch. NR 102, Wis. Adm. Code. Downstream of the Rhinelander Dam, a numeric phosphorus criterion of 100 µg/l applies. For much of its length, the free-flowing portions of the Wisconsin River are well below the phosphorus criteria Wisconsin River Tributary Streams The numeric phosphorus criteria of all major tributary streams in the TMDL project area except two, is 75 µg/l. The two exceptions are the Baraboo and Lemonweir Rivers, which like the Wisconsin River main stem, have numeric phosphorus criteria of 100 µg/l. Due to differences in watershed characteristics and land use, tributary streams west of the main stem generally have higher phosphorus concentrations and deliver higher pollutant loads into the Wisconsin River than those east of the main stem Lakes and Reservoirs As described in an earlier section of the report, the Wisconsin River system consists of 25 hydroelectric dams on the Wisconsin River. Upstream of these dams are impoundments that are highly valued economic, social, recreation, and ecological resources. In addition, there are 21 storage impoundments on the river and its tributaries to regulate flow for hydropower generation. These storage impoundments range from smaller raised natural lakes in the headwaters region to large reservoirs over 6,000 acres. The sensitivity of these impoundments to elevated phosphorus concentrations depends on their hydraulic residence time. Residence time is defined as the length of time that water remains within the reservoir before continuing downstream. Waterbodies with longer residence times are more sensitive to excessive phosphorus concentrations due to the longer time available for water to warm and grow algae. In Wisconsin, reservoirs with a summer residence time of 14 days or greater have a numeric phosphorus criterion of 30 or 40 µg/l. Reservoirs with a residence time of less than 14 days have the numeric phosphorus criterion that applies to the primary stream or river
34 entering the impounded water, i.e., 75 or 100 µg/l. The following subsections of this report describe the lakes and reservoirs addressed by this TMDL PETENWELL AND CASTLE ROCK RESERVOIRS Petenwell and Castle Rock are located at the downstream section of the central portion of the Wisconsin River main stem; they are the second and fifth largest inland lakes in the state of Wisconsin, respectively. These reservoirs were developed for hydroelectric power generation. Because both are unstratified reservoirs with a residence time greater than 14 days, both have numeric water quality criteria for total phosphorus of 40 µg/l, though as stated in Section Error! Reference source not found., the department is recommending SSC for both reservoirs. Petenwell is 23,173 acres with a maximum depth of 44 feet. Castle Rock is 12,981 acres with a maximum depth of 36 feet. A comprehensive management plan was developed for these reservoirs in 1996 (WDNR, 1996), which provides a summary of their impaired beneficial uses and recommends measures to mitigate the problems. Based on information in the management plan, impaired beneficial uses to Petenwell and Castle Rock include: impaired recreation, impaired aesthetics, undesirable blue-green algae blooms, some toxic algae, dioxin, mercury and PCB contaminated fish and sediments; degradation of desirable phytoplankton, zooplankton, bottom-dwelling organisms (benthos) and fish and wildlife communities because of poor water quality and lack of established rooted aquatic plants; low dissolved oxygen; and fish (carp) kills on the Petenwell Reservoir. This TMDL will address impairments related to excessive phosphorus and sediment, however it will not address dioxin, mercury and PCB contaminated fish and sediments THE BIG EAU PLEINE RESERVOIR The Big Eau Pleine Reservoir is a 6,348-acre storage reservoir on the Big Eau Pleine River, a tributary stream that discharges into the Wisconsin River at Lake DuBay in Marathon County. It has a maximum depth of 46 feet. Fish include musky, smallmouth bass, northern pike and walleye. The lake's water clarity is very low. Large fish kills due to low dissolved oxygen during the winter have occurred in the past and are an ongoing concern. Because the Big Eau Pleine is a stratified reservoir with a residence time of more than 14 days, its numeric water quality criteria for total phosphorus is 30 µg/l LAKE DU BAY Lake DuBay is a 4,649-acre hydroelectric reservoir on the Wisconsin River, in Marathon and Portage Counties. It has a maximum depth of 30 feet. Fish include musky, smallmouth bass, northern pike and walleye. The lake's water clarity is low. Because Lake DuBay has a residence time of less than 14 days, its numeric water quality criteria for total phosphorus is 100 µg/l LAKE WISCONSIN Lake Wisconsin is a 7,197-acre hydroelectric reservoir on the Wisconsin River in Columbia and Sauk Counties. It has a maximum depth of 24 feet. The water is brown and moderately fertile. Largemouth bass, panfish, catfish and walleye are most common in the fishery. Other species contributing to the catch are musky, northern pike and lake sturgeon. Because Lake Wisconsin has a residence time of less than 14 days, its numeric water quality criteria for total phosphorus is 100 µg/l LAKE REDSTONE Lake Redstone is a 605-acre reservoir on Big Creek in Sauk County. It was created in the 1970 s for real estate interests. It has a maximum depth of 36 feet. The lake reflects the extensive agricultural watershed it drains with heavy, late summer algal blooms. Fish include musky, panfish, largemouth bass, northern pike and walleye. Because Lake Redstone is a stratified reservoir with a residence time of more than 14 days, its numeric water quality criteria for total phosphorus is 30 µg/l. Page 23
35 KAWAGUESAGA AND MINOCQUA LAKES Kawaguesaga and Minocqua Lakes are the lower most lakes in a complex chain of lakes in Oneida County. Water levels of both lakes are controlled by the dam at the outlet of Kawaguesaga Lake (Tomahawk River). These are raised natural lakes where the dam only increases lake levels by about 4 feet. Kawaguesaga Lake is 700 acres with a maximum depth of 44 feet. Minocqua Lake is 1,339 acres with a maximum depth of 61 feet. Fish include musky, panfish, largemouth bass, smallmouth bass, northern pike, walleye and cisco. A key element of these lakes is that they support a cisco fishery in the lower strata of the lake. This requires that these lakes attain and maintain dissolved oxygen in the hypolimnion, the lowest layer in these stratified lakes. The numeric water quality criterion for total phosphorus is 15 µg/l LAKE DELTON Lake Delton is a 249-acre reservoir on Dell Creek, in Sauk County. It was created in the 1920 s as part of a resort development. It has an average depth of 12 feet. Fish include panfish, largemouth bass, northern pike, walleye and catfish. Because Lake Delton is an unstratified reservoir with a residence time of more than 14 days, its numeric water quality criteria for total phosphorus is 40 µg/l. 3 MONITORING Extensive water quality and flow monitoring was conducted in support of TMDL development. In fact, the Wisconsin River TMDL monitoring program is among the most comprehensive watershed monitoring efforts ever undertaken in the state. It included four years of flow and water quality monitoring in the rivers, streams and lakes of the Wisconsin River Basin. The purpose of this comprehensive, long-term, large-scale monitoring effort was to gain an understanding of water quality conditions within the basin and to provide calibration and validation datasets for use in the development of watershed and reservoir response models. The four years ( ) of Wisconsin River Basin monitoring data included main stem, tributary and reservoir monitoring sites, as described in the following sections, and illustrated in Figure 10 through Figure 14. Full technical documentation of the TMDL Water Quality monitoring effort is summarized in Appendix D. Wisconsin River Main Stem and Tributary Monitoring Stream flow, phosphorus concentration and other water quality constituents, such as nitrogen and suspended solids, were measured year-round at thirteen sites along the main stem of the river, providing information about how much phosphorus is carried from north to south by the main stem. Stream flow was measured either at 15-minute intervals or hourly, and water quality constituents were measured every two weeks. Field parameters such as temperature, dissolved oxygen, ph, transparency and conductivity were measured concurrently with other water quality constituents. Sites on the Wisconsin River at Merrill, Biron and Wisconsin Dells and the Baraboo River near Baraboo are part of Wisconsin s Long-Term Trends Rivers monitoring network and have been routinely monitored over several decades. Continuous temperature data was collected at the Nekoosa, Petenwell, and Castle Rock dams and on Tenmile Creek, Big Roche a Cri Creek, and the Yellow River. As on the main stem sites, water flow, phosphorus, other water quality constituents and field parameters were measured year-round at 19 sites on tributaries flowing into the main stem of the river, providing information about how much phosphorus each tributary watershed contributes to the main stem of the river. Results of main stem and tributary total phosphorus monitoring are illustrated on Figure 10 and Figure 11, respectively Reservoir Monitoring Chlorophyll, phosphorus, other water quality constituents, and field parameters were measured semi-monthly from April October at 20 sites on the five major reservoirs. Additionally, hourly flow data at the Petenwell and Castle Rock dams was provided by the Wisconsin River Power Company. At the reservoir sites, field Page 24
36 parameters were measured in profile, at one-meter depth intervals from the water s surface to the bottom of the lake. Thermistor strings were placed at multiple sites on Castle Rock and Petenwell to continuously monitor changes in thermal mixing of the reservoirs over the course of the summer. Algae samples were collected at multiple sites to identify the major algal species present and to estimate the number of algae present. The location and results of reservoir total phosphorus monitoring are illustrated in Figure 12 through Figure 14. Additional Phosphorus Evaluation Sites Phosphorus concentrations were measured monthly at 98 additional sites between May and October 2012 to provide an additional validation dataset independent from the main stem, tributary and reservoir monitoring sites just described. A subset of these sites received additional follow-up monitoring in 2013 and 2014 to determine phosphorus criteria attainment status. In addition, multiple water bodies were monitored through the Citizen Lake Monitoring Network, Wisconsin Valley Improvement Company Trophic Status Monitoring and other lake and stream monitoring projects. Sediment Monitoring The phosphorus concentration and phosphorus release rates in reservoir sediment, under various conditions, was measured in multiple locations in Castle Rock, Petenwell and Big Eau Pleine Reservoirs and Lake DuBay. Appendix E contains complete documentation regarding methods and results of sediment monitoring measurements. Page 25


37 FIGURE 10. MAIN STEM MONITORING: MEDIAN TOTAL PHOSPHORUS Page 26


38 FIGURE 11. TRIBUTARY MONITORING: MEDIAN TOTAL PHOSPHORUS Page 27


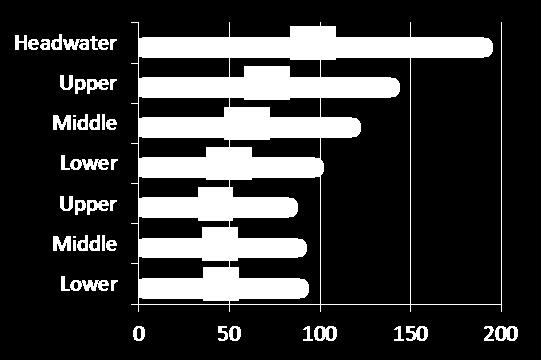
39 Big Eau Pleine Reservoir Petenwell Reservoir Lake DuBay Geomean TP (µg/l) June 1 - Sept Castle Rock Reservoir Lake Wisconsin Geomean TP (µg/l) June 1 - Sept 15 Upper Middle Lower Geomean TP (µg/l) June 1 - Sept 15 FIGURE 12. RESERVOIR MONITORING: GEOMEAN TOTAL PHOSPHORUS Page 28
")
 2010-2013 July 15 - Sept 15 FIGURE 13.")
40 Big Eau Pleine Reservoir Lake DuBay Geomean Chla (µg/l) July 15 - Sept 15 Petenwell Reservoir Castle Rock Reservoir Lake Wisconsin Geomean Chla (µg/l) July 15 - Sept 15 Upper Middle Lower Geomean Chla (µg/l) July 15 - Sept 15 FIGURE 13. RESERVOIR MONITORING: GEOMEAN CHLOROPHYLL-A Page 29


41 Big Eau Pleine Reservoir Lake DuBay % of Days Lake Exceeds Chla Standard July - Sept 15 Petenwell Reservoir Castle Rock Reservoir Lake Wisconsin % of Days Lake Exceeds Chla Standard July - Sept 15 % of Days Lake Exceeds Chla Standard July - Sept 15 FIGURE 14. RESERVOIR MONITORING: GEOMEAN CHLOROPHYLL-A, EXCEEDANCE FREQUENCY Page 30
42 4 SOURCE ASSESSMENT Total Maximum Daily Loads for Total Phosphorus in the Wisconsin River Basin Sources of phosphorus loading in the Wisconsin River TMDL project area include discharges from regulated municipal and industrial wastewater discharges, agricultural runoff, urban runoff (both regulated and nonregulated), and natural runoff (e.g., forests and wetlands). To develop and calibrate the models used in this analysis, information about current or existing nonpoint, urban, and wastewater discharges were used. To develop the TMDL, baseline conditions were determined and generally reflect current regulatory conditions. Phosphorus Sources There are two general types of water pollution sources: point source and nonpoint source. The Clean Water Act defines a point source of pollution as any discrete conveyance that discharges polluted material, such as a pipe or ditch that discharges treated effluent from a municipal and industrial WWTFs into a river. Nonpoint sources of pollution include sources that do not meet the definition of a point source, such as runoff from agricultural lands and background sources such as forest and wetlands. This section provides a general description of point and nonpoint sources of phosphorus and provides further discussion of how loads from each source were quantified through the TMDL development Point Sources Point sources of phosphorus are regulated under the Wisconsin Pollutant Discharge Elimination System (WPDES) program. Point sources are regulated either through an individual permit or a general permit. Point sources include: PUBLICLY OWNED TREATMENT WORKS The term Publicly Owned Treatment Works (POTWs) refers to a sewage treatment plant that is owned and operated by a government entity, typically a city, town, or other local government. POTWs receive domestic and industrial wastewater via sewer systems; treat the wastewater to reduce or remove solid and chemical contaminants; and typically discharge treated effluent to surface waters. Raw sewage contains elevated levels of biological oxygen demand, bacteria, suspended solids and phosphorus. These levels are reduced during treatment to meet WPDES permit limits but are often still present in the discharge. Discharges from POTWs are regulated through individual permits INDUSTRIAL FACILITIES As part of their manufacturing process, many industrial facilities generate wastewater that may contain elevated levels of biological oxygen demand, bacteria, suspended solids and phosphorus. This wastewater may be discharged to a POTW or be treated by the industry to meet WPDES permit limits and discharged directly into a nearby surface water. Conversely, wastewater from other industrial processes may only contain trace levels of these substances and can meet WPDES permit limits without treatment prior to discharge. The most common examples of discharges of this nature are non-contact cooling water (NCCW) and permeate from reverse osmosis systems. Discharges from industrial facilities may be regulated either through individual or general permits depending on the nature of the discharge. In some instances, industrial facilities discharge NCCW which contains elevated levels of phosphorus. Some facilities, including municipal water supply systems, add phosphates (orthophosphate or phosphate-based additives) for corrosion control and to reduce lead/copper from leaching into the water. Many NCCW facilities rely on municipal water for cooling so phosphorus added by the municipality gets passed through the NCCW discharge. The standard additive for corrosion resistance is orthophosphate; however, multiple municipal facilities utilize sodium silicate. Page 31
43 REGULATED STORMWATER As described here, stormwater refers to runoff that is generated from surfaces that have been affected by human development (e.g., parking lots, roads, lawns, exposed soils). These surfaces typically accumulate solid particles (dust, small rocks, plant matter, etc.) that are carried into waterbodies with stormwater. Some of these solid particles, such as soil or plant matter, also contain phosphorus. Other sources of elevated phosphorus in stormwater can include lawn fertilizers and pet waste. Even though stormwater is driven by precipitation and fits the description of nonpoint source pollution, certain stormwater discharges to surface water are regulated under the WPDES program and are therefore considered point sources. Stormwater drainage systems (ditches, curbs, gutters, storm sewers, etc.) that are publicly-owned and do not connect with a wastewater collection system are termed Municipal Separate Storm Sewer Systems (MS4s). Most MS4s that are located in a federally designated Urbanized Area and serve populations of 10,000 or more are required to have a WPDES permit to discharge stormwater into surface waters. WPDES permits are also required for stormwater discharge from some construction sites and industrial sites. A Transportation Separate Storm Sewer System (TS4) permit has been developed and was signed on June 30, 2018 covering Wisconsin Department of Transportation administered facilities within permitted MS4s. Regulated stormwater also extends, through either general or individual permits, to the impervious surfaces of industrial facilities and land development activities. Development activities are usually covered through general permits that cover both the construction activities and post-construction stormwater management. Construction activities often disturb the soil and without sufficient erosion control and sedimentation practices can be source of both sediment and phosphorus. Once stabilized, developed sites can often be a continued source of phosphorus as runoff from rain and melting snow washes away pollutants from rooftops, driveways, lawns, streets, parking lots, and storage yards. Unlike sanitary sewers which collect wastewater from homes and businesses and convey it to a wastewater treatment plant, most stormwater does not go to a wastewater treatment plant but rather relies on treatment and management practices such as rain gardens, swales, infiltration practices, wet ponds, street sweeping and bioretention systems REGULATED CONCENTRATED ANIMAL FEEDING OPERATIONS A Concentrated Animal Feeding Operation (CAFO) is an agricultural operation that raises 1,000 or more farmed animals in confined areas. Wastewater that is generated by CAFOs is high in suspended solids and phosphorus from animal sewage and other animal production operations. Because of the potential water quality impacts from CAFOs, animal feeding operations with 1,000 animal units or more are required to have a WPDES CAFO permit. These permits are designed to ensure that operations use proper planning, construction, and manure management to protect water quality from adverse impacts. WPDES permits for CAFO facilities cover the production area, ancillary storage areas, and storage areas. CAFOs must comply with all WPDES permit conditions which include the livestock performance standards and prohibitions in ch. NR 151 Wis. Admin. Code, Wis. Admin. Code. Manure from CAFO operations used for agronomic purposes in the watershed through surface land spreading or injection is considered a nonpoint source Nonpoint Sources Nonpoint sources of pollution include any sources that do not meet the definition of a point source. Nonpoint source pollution is typically driven by watershed runoff, or the movement of water over the land surface and through the ground into waterbodies, though other types of nonpoint source pollution exist. Nonpoint sources were simulated and aggregated into three categories for the calculation of allocations. These categories include background sources such as forest and wetlands, agricultural sources including dairy rotations, cashcrops, and non-regulated urban which is comprised of urban land uses that are not covered with a permit. Page 32
44 The aggregation was done to correspond with the different implementation mechanisms available to each source and to differentiate between the pollutant loading characteristics of the sources. Agricultural allocations do not differentiate between different cropping rotations because of the transient nature of some rotations; however, Appendix N provides agricultural targets that can aid in implementation of load allocation reductions. The following paragraphs describe nonpoint sources of phosphorus in more detail: AGRICULTURAL RUNOFF High levels of sediment and phosphorus in agricultural runoff can occur because of several factors. Chemical fertilizer and/or animal manure contains phosphorus, a critical plant nutrient, and are often applied to cropland to support crop growth. The phosphorus in chemical fertilizer and manure often becomes bound to soil particles. Because agricultural lands typically have lower vegetative cover than natural areas, they are prone to erosion during runoff events. Erosion from cropland not only carries sediment into nearby surface waters but also carries phosphorus from fertilizer and manure that is attached to soil particles. Alternatively, on cropland with phosphorus saturated soils or recent fertilizer/manure applications, phosphorus can become dissolved in surface or subsurface runoff and wash into nearby waterbodies. The transport of dissolved phosphorus in subsurface agricultural runoff is accelerated on fields with tile drainage systems, which act as a conduit between subsurface water and adjacent drainage channels. CAFOs with over 1,000 animal units are regulated under the WPDES program. Smaller animal feeding operations that are not regulated may also contribute phosphorus and sediment to adjacent waters because of leakage of animal sewage from covered facilities and from sediment erosion or wash off of manure from outdoor feedlots, barnyards, and grazing areas NON-REGULATED URBAN RUNOFF Developed areas are significant sources of phosphorus and sediment. Loading magnitudes typically increase with greater intensity of development. For example, runoff from areas with a high proportion of impervious surfaces tends to have high sediment and phosphorus concentrations because any dust, plant debris, pet/wildlife waste, or other material deposited on the surface is carried into nearby waters without being filtered through soil. Roads, driveways, rooftops, parking lots, and other paved areas in cities, suburban, and rural areas therefore all act as phosphorus and sediment sources. Other unpaved areas with disturbed soils (gravel or dirt roads, trails, paths, construction sites, etc.) also contribute high levels of sediment and attached phosphorus to surface waters. Vegetated spaces such as lawns, golf courses, and parks typically have lower phosphorus and sediment loading than impervious areas since soil particles are held in place by plant roots and precipitation can infiltrate the soil. However, loading from these areas is generally still higher than undisturbed natural lands because of lower canopy densities and a minimal plant litter layer. Phosphorus loads can be particularly high from vegetated developed lands when plant fertilizers are applied. Septic systems may be an additional source of phosphorus in developed areas. Septic systems are used to dispose domestic sewage in regions that lack a centralized sanitary sewer system. Septic systems are underground systems that function by receiving domestic sewage in a holding tank that allows solids to settle out of suspension and for an initial breakdown of organic material. Liquid sewage exits the tank into a drain field. The drain field is typically two to five feet below the soil surface in the unsaturated zone and is comprised of multiple rows of perforated pipes. As the liquid sewage percolates through the soil, phosphorus is reduced as it binds to soil particles before reaching groundwater. A fully functioning septic system should result in the retention of nearly all the phosphorus discharged in liquid sewage. However, excess phosphorus loading to waterbodies from septic systems can occur when sewage pools on the land surface and is transported in runoff during precipitation events; when sewage is not adequately treated by soil before reaching groundwater; and when liquid sewage short-circuits groundwater and is instead routed to a nearby waterbody with minimal soil contact time. These issues can be significant with aging or improperly sited septic systems or with extreme rainfall events. Page 33
45 The WPDES program regulates stormwater discharges from permitted MS4s, construction sites, and industrial sites. The Wisconsin River Basin contains many additional acres of urban, suburban, and developed rural areas that are not covered by WPDES stormwater permits. Runoff and pollutant loading from these areas is referred to as non-regulated urban or non-permitted urban throughout this report BACKGROUND SOURCES Phosphorus is a naturally occurring compound that is present in rocks, plant material, soils, and wildlife waste. Phosphorus loading is therefore expected from undisturbed forests, wetlands, and other natural areas. However, these areas contribute significantly lower loads per unit area than agricultural and developed lands since runoff volumes and phosphorus concentrations are reduced with a more extensive plant canopy, leaf litter layer, and soil infiltration and percolation. These same factors also reduce soil erosion and sediment loading from undeveloped vegetated lands. An additional background source of phosphorus and sediment loading to waterbodies is atmospheric deposition. Dust and plant material in the atmosphere can be deposited in waterbodies from the wind during dry periods or carried by precipitation. In developed watersheds, this typically represents a small fraction of phosphorus and sediment loading STREAM CHANNELS AND LAKESHORES Under natural conditions, stream channels exist in dynamic equilibrium, with balanced erosion and deposition. Channel morphology (width, depth, slope, etc.) is in a stable state that is only altered with an extreme flow event or major disturbance to the landscape. In watersheds with urban or agricultural development, the equilibrium between channel erosion and deposition has been disrupted due to altered streamflow and sediment loading patterns or artificial channel modifications. Because of these changes, the stream channel adjusts through transitional phases that can persist for years to centuries before again reaching a stable form. Channel downcutting and widening are two channel evolution phases that result in bed and bank erosion and contribute sediment and attached phosphorus to downstream waters. Conversely, when excess sediment enters a stream from the watershed or upstream reaches, the aggradation phase occurs, with sediment settling out of the water and the channel becoming increasingly shallow. Like stream channels, lakeshores typically exist in a similar state of equilibrium under natural conditions, with significant erosion only occurring with extreme water level changes or major disturbances to the landscape. Accelerated lakeshore erosion can occur when human activity removes trees and other deep-rooted vegetation from the nearshore area, when water levels are artificially manipulated, and/or with high wave action from boaters LAKE AND RESERVOIR INTERNAL SOURCES An additional category of nonpoint source loading in lakes and reservoirs is the release of phosphorus from sources that are internal to the lake. When phosphorus enters a lake from external sources (e.g., runoff or point source discharges), it cycles between inorganic and organic forms in the water column and bottom sediment. The season net release of phosphorus from bottom sediments into the water column can be significant in lakes where several years of high external phosphorus loading have left a legacy of stored phosphorus. Release of phosphorus from bottom sediments can occur through a variety of processes, including aerobic and anaerobic decomposition of organic sediments, release of iron-bound phosphorus under anoxic conditions, simple diffusion due to sediment-water column concentration differences, or resuspension of phosphorus-laden sediment through wind and other disturbances. It is important to note that bottom sediments should not be considered an independent source of phosphorus to a lake. A fundamental coupling exists between loading of phosphorus from external sources and loading from bottom sediment. The magnitude of phosphorus loading from bottom sediment is largely determined by the amount held in storage in the lake due to historical external phosphorus loading. Page 34
46 Spatial Framework Total Maximum Daily Loads for Total Phosphorus in the Wisconsin River Basin The Wisconsin River TMDL project area was subdivided (Figure 15 through Figure 18) for the purpose of assessing pollutant load generation and receiving water loading capacity, and for the development of load allocations. Specifically, the TMDL project area was subdivided by first identifying hydrologic break points in the basin according to the criteria listed in Table 7, and then delineating the upstream reach and subbasin area draining to each point. T a b l e 7. C r i t e r i a f o r s i t i n g h y d r o l o g i c b r e a k p o i n t s Locations where water quantity and quality were measured during the model period for use in model calibration. Locations where there are major hydrologic transitions, such as the confluence of two large streams Locations where there is a change in the numeric water quality criterion, such as where a stream or river flows into an impoundment, or a stream flows into a river. Locations where local water quality does not meet numeric water quality criteria (i.e., impaired reaches). Locations where there are significant changes in land use or land cover. At point source outfalls except where streamflow does not significantly change between the outfall location and the next downstream breakpoint. A total of 337 breakpoints were identified and the corresponding TMDL subbasins and TMDL reaches were delineated using each breakpoint as a pour point. The resulting average subbasin size is 26 mi 2. This is smaller than the average HUC-12 watershed (32 mi 2 ), which is the scale at which TMDL nonpoint implementation strategies are typically planned. Within each subbasin is a single reach which can be either a stream or an impoundment. The loads generated from each subbasin are delivered to the reach and propagate downstream through the drainage system. Page 35
47 FIGURE 15. TMDL SUBBASINS: LOWER REGION Page 36

48 FIGURE 16. TMDL SUBBASINS: CENTRAL REGION Page 37

49 FIGURE 17. TMDL SUBBASINS: UPPER REGION Page 38

50 FIGURE 18. TMDL SUBBASINS: HEADWATERS REGION Page 39
51 Analysis Framework Water Quality Model Selection Because the Wisconsin River Basin is a large and diverse system, several different models, each with a special purpose, were used for calculating baseline pollutant loads (Table 8). T a b l e 8. D e s c r i p t i o n s o f m o d e l s u s e d t o d e t e r m i n e b a s e l i n e p o l l u t a n t l o a d s Model Primary Inputs Purpose FLUXMASTER Measured daily streamflow and Estimating site-specific monthly TP/TSS loads for TSS and TP concentration samples. model calibration. WinSLAMM SWAT Routing submodel Measured daily precipitation, soils, and land use. Measured daily climate variables, land use, soils, and topography. Monthly land-based TSS/TP loads estimated by SWAT and WinSLAMM. Generation of urban daily TP/TSS loads to feed into SWAT. Estimate daily nonpoint source TP/TSS loads, integrate point source and urban loads, and calibrated to FLUXMASTER loads. Account for monthly in-stream storage and resuspension of TP, while also correcting biases in SWAT-calibrated TSS and TP loads FLUXMASTER FLUXMASTER is an empirical model that was used to estimate site-specific pollutant loads. To fit a FLUXMASTER model, concentration samples are taken intermittently (e.g., bi-weekly) and for those days when a sample was taken, the concentration is paired with daily average streamflow to estimate a load on that day which are then fitted in a regression to provide daily load estimates. The predictor variables in the regression are streamflow, day of the year, and decimal year. FLUXMASTER is standard software developed and used by the United States Geological Survey (USGS) for predicting loads. These loads can then be used to calibrate a watershed loading model such as SWAT or HSPF (Hydrological Simulation Program FORTRAN) WINSLAMM Urban loads (both permitted and non-permitted) were quantified using the WinSLAMM (Source Loading and Management Model for Windows) model. The State of Wisconsin has codified the WinSLAMM model as one of the official software packages for assessing urban runoff compliance and was therefore chosen for this TMDL to remain consistent with Wisconsin rules. WinSLAMM is a mechanistic model that estimates daily runoff and pollutant loading based on precipitation, soil type, and land use. The resulting runoff and pollutant loads were later integrated into the overall watershed SWAT (Soil and Water Assessment Tool) model (urban area footprints were cut from the watershed model to avoid double counting). The WinSLAMM (Version 10.0) model was used to simulate TSS and TP loads from urban areas in the TMDL project area (Figure 19 and Table 9). WinSLAMM was selected because of its ability to model pollutant loads generated by small storm events. Also, it allows the user to define more categories of urban types (e.g., paved parking lots, roofs, etc.), and loadings from many of these categories have been well validated in the field. A full description of the urban area modeling methodology using WinSLAMM is documented in Appendix D. Page 40

52 In urban areas drained by a network of curb and gutters and storm sewers, the drainage area has been altered from its natural topography. For this reason, within permitted MS4s the urban model area draining to each TMDL reach was delineated according to outfall locations and outfall watershed mapping rather than the subbasin boundaries described in Section 4.2. Within the TMDL project area, the extent of the urban model was delineated to include the following: Total Maximum Daily Loads for Total Phosphorus in the Wisconsin River Basin Merrill Marshfield Kronenwetter Marathon Co Mosinee Rib Mountain Rothschild Schofield Wausau Weston 1) Cities and villages, excluding the following: WI Rapids Stevens Point a) Large, contiguous non-urbanized, undeveloped UWSP areas b) Undeveloped floodplain islands, and areas mapped as open water 2) Urbanized areas 5 within townships that have a permitted Municipal Separate Storm Sewer System Baraboo Portage (MS4) 3) State Department of Transportation right-of-way FIGURE 19. LOCATIONS OF PERMITTED MS4S located within an urbanized area, and county transportation right-of-way located within an urbanized area of a county that has a permitted MS4 T a b l e 9. L i s t o f p e r m i t t e d M S 4 s Permittee County Permittee County Permittee County C. of Baraboo Sauk C. of Schofield Marathon C. of Wausau Marathon C. of Marshfield Wood/Marathon V. of Kronenwetter Marathon T. of Rib Mountain Marathon C. of Merrill Lincoln Co. of Marathon Marathon C. of Stevens Point Portage C. of Portage Columbia V. of Rothschild Marathon UW-Stevens Point Portage C. of Mosinee Marathon V. of Weston Marathon C. of Wisconsin Rapids Wood SWAT The SWAT model was the primary model used to simulate and calibrate watershed pollutant loading (Sections 3 and 4 of Appendix D). The SWAT model is a physically based model that simulates stream flow, sediment loss, and nutrient exports (Neitsch et al., 2002a). Agricultural, natural, and developed areas located outside of city and village limits, such as roads and rural subdivisions, were modeled in SWAT. Urban loads estimated by WinSLAMM and point source loads were integrated into the SWAT model. The SWAT model was calibrated at several locations using site-specific loads calculated by FLUXMASTER. SWAT was selected because it maintains open-source model code and an easy-to-use interface. It has a history of successful implementation throughout Wisconsin and has successfully been used to evaluate agriculturally dominant watersheds for sediment and nutrient TMDLs (Cadmus, 2011; Cadmus, 2012). Another reason for selecting SWAT was because SWAT has tools for simulating complex agriculture operations. The agricultural landscape throughout the basin is heterogeneous, ranging from dairy farming in the north central region, potato/vegetable cropping in the Central Sands region, and corn/soybean cropping in the southern region. Furthermore, there is diversity in tillage and fertilizer usage within each farming operation type, creating a diverse landscape of agricultural management. The accurate representation of 5 "Urbanized area is defined herein as an area classified as urbanized by the 2010 Decennial Census. For the purpose of this document urbanized area and urban model area" are not the same. Page 41
53 agriculture was particularly important to the development of the Wisconsin River Basin SWAT model. Preliminary assessments of the monitoring data collected showed that agricultural regions of the basin deliver a significant fraction of the overall phosphorus and sediment loads, and therefore a significant effort was undertaken to inventory agricultural sources. The SWAT model was developed to simulate field-based agricultural phosphorus losses, such as phosphorus in manure that runs off a fertilized field or phosphorus loss resulting from particles bound to sediment during soil erosion events. However, the SWAT model does not explicitly account for other agricultural sources such as feed lots, dairy production facilities, or erosion from streambanks that have high concentrations of soil phosphorus from the deposition of past agricultural runoff. Phosphorus loss from these other agricultural sources are implicitly lumped with field-based phosphorus loss estimates during the calibration phase of model development. In other words, when field-based agricultural phosphorus loss estimates are summed at the watershed scale, and then calibrated to match in-stream TP loads, all sources are accounted for in the watershed, even though some are not explicitly defined in the SWAT model. Use of the SWAT model provided the opportunity to distinguish between land cover and land management in the model. The term land cover generally refers to maps of broad classifications of land use, such as forest, wetlands, or agriculture ; whereas, the term land management generally refers to specific practices within a land use classification (e.g., solid manure fertilization for agricultural land use classes). A more holistic representation of activities within a watershed can be achieved when land cover and land management are merged together. When together, the two provide both the spatial representation of land use (i.e., land cover ), and the temporal aspect of activities within each land cover category (i.e., land management ), so land use can therefore be described through both space and time. The innovative method used to spatially and temporally define land cover and land management within agricultural areas throughout the basin is summarized in Figure 20. Full documentation of the land cover and land management definition process and its results are detailed and mapped in Section 3.2 of Appendix D. A complete inventory was conducted that compiled all individually permitted wastewater facilities that discharge to surface waters within the basin. This inventory is required for simulating conditions for the SWAT modeling period of The inventory process involved querying existing WDNR databases, verifying with Regional WDNR staff, and developing methods to consistently account for gaps in data to accurately estimate existing discharge rates. The methodology used to compile this data is described further in Section 3.7 of Appendix D. Monitored loads from dischargers and estimated urban loads from WinSLAMM were integrated with the SWAT simulation. With all sources combined, the SWAT model was calibrated to fit site-specific loads calculated by FLUXMASTER. Details of the SWAT model calibration results are described in Section 5 of Appendix D. Page 42
 can be thought of")
54 FIGURE 20. DEFINING LAND COVER AND LAND MANAGEMENT IN AGRICULTURAL AREAS TRIBUTARY ROUTING SUB-MODEL A custom empirical model was developed to address three concerns with the SWAT model: 1 Estimates of loads from SWAT hydrologic response units (HRUs) can be thought of as the loads that are exported from fields rather than the loads that are ultimately delivered downstream. Therefore, HRU loads are nearly always larger than delivered loads, unless the SWAT model is configured such that reaches in the model act as sources (i.e. internal loading). 2 The calibrated SWAT model was not able to capture some seasonal fluctuations in TP loading, which probably results from transient storage and release of phosphorus from stream sediments. 3 The calibrated SWAT model still had residual bias after calibration. The custom empirical model was calibrated to fit streamflow, TP, and TSS loads at tributary sites using seasonality and lag coefficients that minimize the root mean square error and percent bias of delivered loads. Currently 67% of the phosphorus entering the Big Eau Pleine is retained. Because of this high rate of retention, an empirical model based on the BATHTUB modeling was used to describe phosphorus retention in the Big Eau Pleine. See Sections of Appendix D for more details regarding additional modeling efforts beyond the primary SWAT model. Page 43
55 MAIN-STEM ROUTING SUB-MODEL As described in Section , transport of total phosphorus (TP) through tributaries was estimated by SWAT model calibration, followed by application of a tributary routing sub-model. Because the SWAT model was not calibrated to main stem Wisconsin River stations downstream of Merrill, a separate method was needed to estimate transport on the main stem. This section addresses the question: what fraction of tributary TP loads are delivered to points downstream? The time scale of the analysis is the average annual load over the period when the highest frequency monitoring occurred. Because TP load estimates are tightly tied to flow records, the quality of the flow records at main stem stations was first evaluated. There are twelve stations with daily streamflow on the main stem between Merrill and Muscoda. Four of these stations are operated by the USGS and are considered to be the most accurate. The other stations are operated by hydroelectric companies, most of which report data to the Wisconsin Valley Improvement Corporation (WVIC). The data from most of these stations is of unknown quality. First, a linear regression between mean discharge and drainage area was fit for the four USGS gages (Figure 21). Then, the sum of tributaries flow for each station was calculated by summing measured flows where available and SWAT modeled flows on ungaged tributaries. Of the WVIC stations, three (Stevens Point, Wisconsin Rapids, and Nekoosa) are closely aligned to the USGS gage regression and slightly below the sum of tributaries estimates. Mean flows at the other four WVIC stations (Wausau, DuBay, Petenwell, and Castle Rock) are significantly lower than predicted by the USGS gage regression and sum of tributaries estimates. Flow at the Prairie du Sac dam, which is operated by Alliant Energy, is significantly higher than predicted by the USGS gage regression and sum of tributaries estimate. Based on this evaluation, TP load estimates at the USGS gages and the three WVIC stations where flows align with the USGS regression should be considered most accurate. Next, the measured average annual TP load at the Wisconsin Dells station (500 tons) was compared to the sum of gaged tributary loads where available, SWAT-estimated loads for ungaged areas, and direct discharges to the main stem (686 tons) ( Page 44
56 Table 10), giving a net TP retention of 27% (73% delivery). To distribute this TP retention through the main stem, delivery fractions (maximum=1) for reservoir reaches were calculated to match the pattern in measured TP load, particularly at stations with apparently unbiased flow estimates. For example, all of the retention observed between Merrill and Rothschild was assumed to happen between Wausau and Rothschild because that reach contains Lake Wausau and the TP load estimate at Rothschild is assumed to be more accurate than at Wausau. TP delivery through Lake DuBay was estimated at Stevens Point rather than at the Lake DuBay dam because flow at DuBay appears to be underestimated. TP delivery through Petenwell and Castle Rock was estimated by matching the observed TP load at Wisconsin Dells while assuming 100% delivery between Castle Rock and Wisconsin Dells and balancing the differences between measured and predicted loads at the Petenwell and Castle Rock dams. Even with 100% delivery, the sum of TP loads between Wisconsin Dells and Prairie du Sac (Lake Wisconsin) is underestimated, though this discrepancy is probably due to the overestimate of flow at Prairie du Sac. Overall, this process of distributing TP retention through the main stem Wisconsin River produces a pattern that closely matches the observed pattern and is consistent with expectations that retention should be generally proportional to water residence time (Figure 22). Page 45
57 T a b l e 10. A v e r a g e a n n u a l ( ) d i s c h a r g e, t o t a l p h o s p h o r u s ( T P ) l o a d, a n d e s t i m a t e d T P d e l i v e r y f r a c t i o n s f o r m a i n s t e m W I r i v e r m o n i t o r i n g s t a t i o n s Station ID Station Name Drainage Area (mi 2 ) TP Delivery Fraction Measured Discharge (cfs) Sum of Tributary Discharge (cfs) Measured TP Load (tons) Merrill 2,760 2, Sum of Tributary TP Load (tons) Sum of Tributary TP Load with Delivery (tons) Wausau 3, ,159 2, Rothschild 4, ,281 3, DuBay 4, ,758 4, Stevens Point 4, ,122 4, Wisconsin Rapids 5, ,416 4, Nekoosa 5, ,661 4, Petenwell 5, ,606 5, Castle Rock 7, ,469 6, Wisconsin Dells 8, ,726 6, Prairie du Sac 9, ,512 7, Muscoda 10,400 8, Model Simulation Period The chosen model simulation period was the years 2002 to The project was funded in 2009 and intensive monitoring began in 2010 and ended in 2013 which established the end of the simulation period. The beginning of the simulation period was largely determined by typical patterns of agriculture. An average crop rotation cycle is about six years to span a range of weather conditions, two crop rotation cycles results in a total of 12 years and 12 years prior to 2013 is The range of weather conditions between 2002 and 2013 was shown to be representative of the historical average. For three of the long-term trend sites within the basin (Wisconsin River at Merrill, Wisconsin Rapids, and Wisconsin Dells), the streamflow regime in the model simulation period was compared to the streamflow regime between the years of 1980 and Streamflow regimes were compared by overlaying plots of streamflow quantiles for the simulation period and the historical period, and visually affirming that the distributions of streamflows overlapped. Page 46
58 FIGURE 21. DISCHARGE ON THE WI RIVER BETWEEN MERRILL AND PRAIRIE DU SAC Note: The sum of tributary flows is a combination of measured flows where available, and SWAT modeled flows on ungaged tributaries. The dashed line is a linear regression on the USGS gages only. Page 47
59 FIGURE 22. TP LOAD ON THE WI RIVER BETWEEN MERRILL AND PRAIRIE DU SAC Note: The sum of tributary loads is a combination of measured loads where available, and SWAT modeled loads on ungaged tributaries. Delivered tributary loads were calculated by applying the delivery fractions in Page 48
60 Table 10. Total Maximum Daily Loads for Total Phosphorus in the Wisconsin River Basin Calibration Results For assessing model fit, well established guidelines in the scientific literature were followed. Moriasi et al. (2007) has been cited nearly 2,775 times (August 2016, because it establishes numeric benchmarks for model performance that are adaptable to most SWAT (and other hydrologic models, empirical and mechanistic) applications. The numeric criteria were calculated using two objective functions: 1) percent bias (PBIAS), and 2) Nash-Sutcliffe efficiency (NSE). Benchmarks were met for streamflow, TSS, and TP for all sites with the exception of TSS for the Baraboo River at Reedsburg and Mill Creek 6 (Table 11 and Table 12). T a b l e 11. W a t e r s h e d m o d e l p e r f o r m a n c e b e n c h m a r k s f o r a m o n t h l y t i m e s t e p Performance Rating NSE PBIAS (%) Streamflow Sediment N, P Very good 0.75 < NSE 1.00 PBIAS < ±10 PBIAS < ±15 PBIAS < ±25 Good 0.65 < NSE 0.75 ±10 PBIAS < ±15 ±15 PBIAS < ±30 ±25 PBIAS < ±40 Satisfactory 0.50 < NSE 0.65 ±15 PBIAS < ±25 ±30 PBIAS < ±55 ±40 PBIAS < ±70 Unsatisfactory NSE 0.50 PBIAS ±25 PBIAS ±55 PBIAS Existing Conditions Model Results The average annual phosphorus load delivered by each major tributary watershed into the Wisconsin River, as calculated by the SWAT model for existing conditions, is illustrated in Figure 23 and the phosphorus yield for each subbasin is illustrated in Figure 24. The relative percentages of each phosphorus source type and total magnitude of the phosphorus load at the outlet of each tributary watershed are illustrated in the tributary watershed figures in Appendix A. The relative magnitude of the existing total phosphorus load at various points along the main stem of the Wisconsin River is illustrated in Figure 25. Model results are presented in much greater detail in Section 6 of Appendix D. 6 Systematic biases in monthly nonpoint TP estimates in the watershed model were corrected using non-linear empirical models, however the Mill Creek monitoring station had insufficient data for fitting the monthly model. Mill Creek biases were corrected after the final watershed model was complete by proportionally reducing upstream nonpoint annual average TP loads until the estimated annual average total TP load estimate from the watershed model equaled the site-specific annual average TP load estimate at the County Hwy PP monitoring station. Page 49
61 T a b l e 12. F i n a l f i t s t a t i s t i c s o f s t r e a m f l o w, t o t a l s u s p e n d e d s o l i d s ( T S S ), a n d t o t a l p h o s p h o r u s ( T P ) a f t e r b i a s c o r r e c t i o n Station Name Baraboo River at Main Street, Reedsburg, WI Streamflow TSS TP n NSE PBIAS n NSE PBIAS n NSE PBIAS Baraboo River near Baraboo, WI Big Eau Pleine River at Stratford, WI Big Rib River at Rib Falls, WI Big Roche a Cri Creek at Hwy Eau Claire River at Kelly, WI Fenwood Creek at Bradley, WI Freeman Creek at Halder, WI Lemonweir at New Lisbon Little Eau Pleine River near Rozellville, WI Mill Creek at County Hwy PP * Pine River at Center Avenue near Merrill, WI Plover River at Hwy 10/ Prairie River near Merrill, WI Spirit River at Spirit Falls Ten Mile Creek near Nekoosa West Branch of Baraboo River at Hillsboro, WI Wisconsin River at Castle Rock Dam Wisconsin River at Lake DuBay Dam * Wisconsin River at Merrill, WI Wisconsin River at Nekoosa Dam * Wisconsin River at Petenwell Dam Wisconsin River at Rothschild, WI Wisconsin River at Stevens Point Dam * Wisconsin River at Wisconsin Dells Wisconsin River at Wisconsin Rapids Wisconsin River below Prairie du Sac Dam Yellow River at Babcock Yellow River at Hwy *Rather than correcting the bias using the monthly-scale tributary or main-stem sub-models, TP load estimates at these locations were corrected on an annual average basis after completion of the watershed model. Page 50

62 FIGURE 23. TP LOAD DELIVERED BY MAJOR TRIBUTARY WATERSHEDS Page 51

63 FIGURE 24. TP YIELDS PER SUBBASIN Page 52

64 FIGURE 25. SOURCES OF TP LOADS Page 53
65 Page 54 Analysis of Baseline Phosphorus and Sediment Loading Nonpoint Source Loading Baseline flow and phosphorus loads from nonpoint sources were generated in the SWAT model. Natural or background sources of loads from forest, grassland, wetlands, and other natural areas were estimated from forest, grassland, and wetland land covers in the SWAT model. Baseline agricultural loads were calculated from the crop land cover areas including dairy, cash grain and potato and vegetable rotations in the SWAT model. Baseline loads for non-permitted urban areas were calculated from the non-background and nonagricultural land covers outside of permitted MS4 municipal boundaries as determined both in SWAT and in WinSLAMM. Specifically, developed areas within the municipal limits of cities and villages not covered by an MS4 WPDES permit were simulated with the WinSLAMM model. Developed areas located outside of city and village limits, such as roads and rural subdivisions, were modeled as developed areas in SWAT. Details regarding the modeling conditions used to determine baseline loads from background, agricultural, and nonpermitted urban loads can be found in the SWAT model report (Sections 3 and 4 of Appendix D). Baseline phosphorus loads for background, agricultural, and non-permitted urban sources are shown in Table F-1 of Appendix F Point Source Loading Methods for determining the baseline flows and loads for individual and general permittees are described in the following sections INDIVIDUAL PERMITS The phosphorus baseline loads for municipal and industrial wastewater discharges covered by an individual WPDES permit with specified limits were based on the concentration limit and design flow (annual average design flow for POTWs; highest average annual flow over five years ( ) for industrial dischargers). If a permitted limit did not exist, measured data from the facility was used in place of the concentration limit to determine the baseline load. To be representative of the ch. NR 217, Wis. Adm. Code, technology-based effluent limit (TBEL) for phosphorus, all wastewater point source baseline TP concentrations were set to an effluent limit of 1.0 mg/l unless the individual permittee s actual discharge was naturally low in phosphorus (e.g., noncontact cooling water without additives, reverse osmosis permeate), in which case the baseline load was based on actual discharge data. Some discharges are intermittent or seasonal, and specific permit conditions vary on a case-by-case determination. Typical operation of seasonal discharges is to take advantage of higher seasonal flows; however, for some discharges such as from food processors, discharge is based on production times corresponding with harvests. The TMDL was developed to account for these variations and evaluated timing of discharges when assigning allocations. During TMDL development, noncontact cooling water (NCCW) discharges were evaluated for the purposes of determining whether WLAs for phosphorus were needed to meet TMDL goals. Elevated phosphorus concentrations may be present in NCCW discharges where city water is the main source, due to the use of additives to control lead in municipal water supplies. Phosphorus WQBELs that are imposed because of this TMDL, or according to s. NR , Wis. Adm. Code, do not intend to suggest that additives in finished drinking water are not needed or should not be used. In the case of lead, additives are often needed to ensure healthy and safe drinking water. However, alternatives may need to be explored to reduce phosphorus inputs into receiving waters. For facilities with individual permits that use groundwater or a public water supply for cooling water purposes, design flows and discharge concentrations were used to determine individual WLAs. For pass
66 through systems (i.e., facilities with surface water intake structures) where phosphorus is not added, and the water is withdrawn from and discharged to the same or downstream waterbody, the baseline condition for the allocation process utilized actual discharge flows with TP concentrations set to zero to reflect that no net addition of phosphorus is occurring. This would result in an allocation of zero but allow the facility to discharge the pass-through phosphorus load. Baseline flows and loads for individual permittees are listed in Table F-2 of Appendix F and facility locations are shown in Figure 26 through Figure 29 (map numbers in the table correspond to point labels in the figures). Page 55

67 FIGURE 26. LOCATIONS OF WASTEWATER TREATMENT FACILITIES: LOWER REGION Page 56

68 FIGURE 27. LOCATIONS OF WASTEWATER TREATMENT FACILITIES: CENTRAL REGION Page 57
69 FIGURE 28. LOCATIONS OF WASTEWATER TREATMENT FACILITIES: UPPER REGION Page 58

70 FIGURE 29. LOCATIONS OF WASTEWATER TREATMENT FACILITIES: HEADWATERS REGION Page 59
71 GENERAL PERMITS WDNR authorizes the discharge of stormwater and wastewater from industrial facilities, CAFOs, and construction sites under a set of general WPDES permits. Unlike individual WPDES permits, general permits are not written to reflect site-specific conditions of a single discharger, but rather are issued to cover multiple dischargers that have similar operations and types of discharges. Each general permit can have different requirements for monitoring, inspection frequency, and plan development. Stormwater general permits cover discharges from industrial and construction sites (see Concentrated Animal Feeding Operations general permits are issued to large dairies with 1,000 to 5,720 animal units (see Wastewater general permits cover multiple categories, including: NCCW, nonmetallic mining (quarries), car washes, swimming pools, and other discharges (see for a full list of Wastewater general permits). Baseline phosphorus loads for general permittees located within an MS4 boundary were included in the MS4 baseline load. Baseline phosphorus loads for general permittees located outside of MS4 areas were included as 10% of the non-permitted urban baseline load for TP by subbasin. The assumption of 10% was based on the number and typical types of facilities present within the watersheds and best professional judgment of the TMDL Development Team MUNICPAL SEPARATE STORM SEWER SYSTEMS (MS4S) There are 15 permitted MS4s within the TMDL area (see Table 9 in Section ). Baseline MS4 TP and TSS loads were determined from the WinSLAMM modeling described in Section and detailed in Section 4.4 of Appendix D. The WinSLAMM results used in the existing conditions SWAT model were adjusted for baseline conditions to reflect the ch. NR 216 Wis. Admin. Code 20% TSS reduction requirement and corresponding 15% reduction in TP. The corresponding 15% TP reduction is calculated in WinSLAMM by applying BMPs to obtain the 20% TSS reduction. The reduction relationship between TP and TSS is not 1:1 because of the partitioning between phosphorus attached to sediment and the soluble phosphorus in the urban runoff. Because of the large spatial expanse of the Wisconsin River Basin, each modeled MS4 area utilized different rainfall files to best represent local conditions. Therefore, unique monthly flows and loads were generated for each MS4 to determine baseline conditions. Figure 30 through Figure 32 shows the locations and boundaries of each permitted MS4. Table 13 lists the area of each MS4 within SWAT subbasins and serves as a legend to Figure 30 through Figure 32 by listing an ID code that can be referenced to each map. MS4 baseline values are shown in Appendix F, Table F-3. Although included in the table, Marathon County and University of Wisconsin-Stevens Point are both covered by a WPDES MS4 permit but will not receive individual allocations. Instead, they are accounted for in the portions of each city, village, or town MS4 that they discharge to or lie within. However, these regulated MS4s that are not given specific allocations will still be expected to achieve the applicable identified reductions within their portion of their jurisdictional area. Please refer to the MS4 TMDL Implementation Guidance for details; TMDL Guidance for MS4 Permits: Planning, Implementation, and Modeling Guidance. The guidance and addendums can be found at Page 60

72 FIGURE 30. LOCATIONS OF PERMITTED MS4S: LOWER REGION Page 61

73 FIGURE 31. LOCATIONS OF PERMITTED MS4S: CENTRAL REGION Page 62

74 FIGURE 32. LOCATIONS OF PERMITTED MS4S: UPPER REGION Page 63
75 T a b l e 13. P e r m i t t e d M S 4 a r e a b y T M D L s u b b a s i n Municipality TMDL Subbasin Area (acres) Figure Major Trib. Watershed Map ID Baraboo Lower Baraboo B-20 Baraboo Lower Baraboo B-20 Baraboo 179 2,671.7 Lower Baraboo B-20 Baraboo Lower Baraboo B-20 Baraboo Lower Baraboo B-20 Kronenwetter Upper WI River Upper U-14 Kronenwetter 153 1,061.2 Upper WI River Upper U-14 Kronenwetter 263 2,412.5 Upper WI River Upper U-14 Marathon County NA NA Upper WI River Upper NA Marshfield 84 2,358.7 Upper Little Eau Pleine LEP-6 Marshfield Upper Little Eau Pleine LEP-6 Marshfield 147 4,004.0 Central Mill M-7 Marshfield 275 1,709.0 Central Yellow Y-8 Marshfield Central Yellow Y-8 Merrill 158 2,343.4 Upper WI River Upper U-15 Merrill Upper Prairie PR-3 Merrill 321 1,621.4 Upper WI River Upper U-15 Mosinee 81 1,184.7 Upper WI River Upper U-16 Mosinee 153 1,512.7 Upper WI River Upper U-16 Mosinee 262 1,149.8 Upper WI River Upper U-16 Portage Lower WI River Lower L-17 Rib Mountain 154 2,311.8 Upper WI River Upper U-17 Rib Mountain Upper WI River Upper U-17 Rothschild Upper WI River Upper U-18 Rothschild 263 3,246.0 Upper WI River Upper U-18 Schofield Upper WI River Upper U-19 Schofield Upper Eau Claire EC-3 Stevens Point Central WI River Central C -16 Stevens Point 148 1,466.4 Central WI River Central C -16 Stevens Point 149 1,359.4 Central Plover P-2 Stevens Point 210 4,310.0 Central WI River Central C -16 Stevens Point 260 1,904.9 Central Plover P-2 Wausau 154 4,114.1 Upper WI River Upper U-20 Wausau 156 3,792.9 Upper WI River Upper U-20 Wausau Upper WI River Upper U-20 Wausau Upper Eau Claire EC-4 Wausau 291 1,321.4 Upper Rib R-5 Wausau Upper Rib R-5 Weston Upper WI River Upper U-21 Weston 154 2,367.5 Upper WI River Upper U-21 Weston 155 3,135.7 Upper Eau Claire EC-5 Page 64
76 Municipality TMDL Subbasin Area (acres) Figure Major Trib. Watershed Map ID Weston Upper WI River Upper U-21 Weston Upper Eau Claire EC-5 Weston Upper Eau Claire EC-5 Wisconsin Rapids 144 1,260.2 Central WI River Central C-18 Wisconsin Rapids Central WI River Central C-18 Wisconsin Rapids 205 3,496.0 Central WI River Central C-18 Wisconsin Rapids 206 1,050.9 Central WI River Central C-18 Wisconsin Rapids Central WI River Central C-18 Wisconsin Rapids 257 1,381.3 Central Fourmile F-1 UW-Stevens Point 210 ND Central WI River Central C-17 Detailed maps of the permitted MS4 areas included in the TMDL are provided in Appendix G CONCENTRATED ANIMAL FEEDING OPERATIONS Concentrated Animal Feeding Operations (CAFOs) are operations defined and regulated under the WPDES program. There are 26 regulated CAFOs in the Basin (Table 14 and Figure 34 through Figure 36). WPDES permits for CAFO facilities cover the production area, ancillary storage areas, storage areas, and land application areas. Any runoff from CAFO land application activities is considered a nonpoint source and is covered in the TMDL through the load allocation. CAFOs must comply with all WPDES permit conditions which include the livestock performance standards and prohibitions in ch. NR 151, Wis. Admin. Code. Specific WPDES permit conditions for the production area specify that CAFOs may not discharge manure or process wastewater pollutants to navigable waters from the production area, including approved manure stacking sites, unless all the following apply: Precipitation causes an overflow of manure or process wastewater from a containment or storage structure. The containment or storage structure is properly designed, constructed and maintained to contain all manure and process wastewater from the operation, including the runoff and the direct precipitation from a 25-year, 24-hour rainfall event for this location. The production area is operated in accordance with the inspection, maintenance and record keeping requirements in s. NR , Wis. Admin. Code. The discharge complies with surface water quality standards. For ancillary service and storage area, CAFOs may discharge contaminated stormwater to waters of the state provided the discharges comply with groundwater and surface water quality standards. The permittee shall take preventive maintenance actions and conduct periodic visual inspections to minimize the discharge of pollutants from these areas to surface waters. For CAFO outdoor vegetated areas, the permittee shall also implement the following practices: Manage stocking densities, implement management systems and manage feed sources to ensure that sufficient vegetative cover is maintained over the entire area at all times. Prohibit direct access of livestock or poultry to surface waters or wetlands located in or adjacent to the area unless approved by the Department. Manure from CAFO operations used for agronomic purposes through surface land spreading or injection is considered a nonpoint source for purposes of a TMDL. Manure spreading is included implicitly in the SWAT model. Page 65
77 T a b l e 14. L i s t o f C A F O s TMDL Major Tributary Map Facility Name Permit ID Reach Figure Watershed Number* Burr Oak Heifers LLC Central Little Roche a Cri LR-3 Central Sands Dairy LLC Central WI River Central C-19 Chapman Brothers Farms Lower Lemonweir LMN-8 Destiny Farms LLC Central Yellow Y-9 Dietsche Dairy LLC Central Yellow Y-10 Double P Dairy LLC Upper Rib R-6 Elusive Hill Dairy Central Yellow Y-9 Fischer Clark Dairy Central Plover P-3 Golden Sands Dairy LLC Central Tenmile TM-1 Heeg Farm Upper Big Eau Pleine BEP-8 Hillsprairie Dairy/Mitchell F Upper Baraboo B-21 Kingdom Haven Dairy Upper Rib R-7 Kinnamon Ridge Dairy LLC Lower Baraboo B-22 Lynn Enterprises Upper Big Eau Pleine BEP-10 Maple Ridge Dairy Upper Big Eau Pleine BEP-9 Miltrim Dairy Upper Rib R-8 Nagel Dairy Farm LLC Upper Eau Claire EC-6 New Chester Dairy LLC Lower WI River Lower LW-16 Night Hawk Dairy LLC Upper Little Eau Pleine LEP-7 Norm-E-Lane Central Yellow Y-10 O'Harrow's Family Farm LLC Lower Baraboo B-23 Rausch Family Farms Upper Rib R-9 Richfield Dairy Central Little Roche a Cri LR-4 Spring Breeze Dairy LLC Upper Eau Claire EC-7 Tri Star Dairy, Inc Central Mill M-8 Van Der Geest Dairy Cattle, Inc Upper WI River Upper U-23 *map numbers correspond to point labels in Figure 34 through Figure 36. Page 66
78 Seasonality Total Maximum Daily Loads for Total Phosphorus in the Wisconsin River Basin Nonpoint source pollution loads are not evenly distributed over time. There are certain times of the year when TSS and TP yields can be 1 2 orders of magnitude greater than others (Figure 33 and Appendix D.6 for observed and simulated loads over time at each calibration site). Agricultural nonpoint loads tend to be the lowest in winter months during snow cover. Runoff tends to be highest in early spring (usually beginning in March) when snow begins melting, and with runoff, simulated TSS and TP yields are greater. This pattern is particularly evident in March and April. For many dairy operations, the SWAT model simulates solid manure applications once monthly between January and April, and simulated TP yields tend to be the greatest when snow mixed with manure begins to melt. Summer months also yield higher TSS and TP than winter months due to more intense rain events and greater precipitation overall, however plant cover and reduced fertilization result in less pollutant yield than in spring months. Simulated TP yields in October are slightly higher due to some agricultural operations in the model programmed to fertilize at that time. FIGURE 33. BOXPLOTS SHOWING INTRA-ANNUAL POLLUTANT VARIABILITY Some of the TP that is loaded to surface waters outside of the growing season, particularly during March and April, is retained and affects those waters during the growing season. Therefore, the reductions required to meet the TP loading capacity must be distributed throughout the year, in approximate proportion to the seasonal pattern of the baseline loading, in order to meet the assumptions of the methods used to calculate loading capacity (see Section 5 for details). Page 67
79 FIGURE 34 LOCATIONS OF CAFOS: LOWER REGION Page 68

80 FIGURE 35. LOCATIONS OF CAFOS: CENTRAL REGION Page 69

81 FIGURE 36. LOCATIONS OF CAFOS: UPPER REGION Page 70
82 5 POLLUTANT LOADING CAPACITY Total Maximum Daily Loads for Total Phosphorus in the Wisconsin River Basin Pollutant loading capacity is defined as the amount of a pollutant that a water body can assimilate and still meet water quality standards. By definition, a TMDL is a daily loading capacity; however, loading capacities can also be calculated for time periods other than daily, if the effects of a pollutant manifest themselves over longer periods. This section describes how the pollutant loading capacities for river and stream reaches as well as the basin reservoirs were determined. Linking Pollutant Loading to Concentration Wisconsin s stream/river total phosphorus criteria are assessed as growing-season (May - October) median (GSM) concentrations. Although the SWAT model was run with a daily time step, predicted daily TP concentrations are not as accurate as monthly or annual flow-weighted mean (FWM) values. To establish annual TP loads that will meet these criteria, a method is required to translate GSM concentrations to flowweighted mean concentrations. FWM is higher than GSM in streams where TP concentration increases with discharge and where there is little seasonal variation. In contrast, GSM may be higher than FWM in streams where TP exhibits a strong seasonal pattern that peaks in summer and is independent of discharge. We assume that the FWM/GSM ratio for a given tributary will remain constant as TP concentrations change because the underlying hydrologic drivers of the ratio will not change very much. The FWM/GSM ratio for a tributary can be used to estimate the TP loading that will meet TP criteria they do not change the criteria themselves. The FWM/GSM ratio was estimated for each tributary monitoring station from monitoring data. For each station, the FWM was calculated from measured daily flow and daily loads estimated by the Fluxmaster model (Section and Section of Appendix D). GSMs were estimated from monitoring data adjusted to control for the influence of antecedent precipitation on TP concentration (WDNR PhosMER model). PhosMER was chosen to estimate GSM rather than Fluxmaster because WDNR intends to use it to assess future TP monitoring data where flow may not be monitored. Ratios for ungaged tributaries were either calculated from SWAT-derived FWM and PhosMER-derived GSM or from a nearby gaged tributary station with similar watershed characteristics (Figure 24). Subbasins that drain directly to the main stem Wisconsin River were assigned the ratio for the Wisconsin River at Merrill because ratios at all downstream stations were very similar. FWM/GSM ratios at tributary monitoring stations ranged from 0.86 (Little Eau Pleine River) to 2.44 (Freeman Creek) with a median of 1.27 (Table 15). The lowest ratios are in parts of the basin (including the main stem Wisconsin River) that contain many impoundments that likely dampen hydrologic response. The highest ratios are in parts of the basin with clay soils and flashy hydrology. There was no relationship between FWM/GSM ratios and the distribution of TP sources, but even if there were, the assumption that the ratio will remain constant as concentrations decrease would still be valid because load allocations to each source are proportional to baseline loads. In addition, because allocations for most of the basin are driven by downstream reservoirs, load reductions for most tributaries are beyond what is needed to meet the stream loading capacities derived from the FWM/GSM ratios. Because the FWM concentration is calculated from year-round data, this method for linking loading to concentration assumes that TP loading reductions will occur year-round. Some of the TP that enters surface waters in a given month is retained in stream and lake bottom sediments, and later remobilized through a variety of biogeochemical and hydrologic processes. Therefore, even though TP assessments only use data from the growing season (May-Oct) in streams and summer (Jun-Sep) in lakes, TP load reductions will be required outside of this period. For point sources, the validity of this assumption is supported by the yearround application of permit limits. For nonpoint sources, it relies on the assumption that practices that reduce TP loading will be implemented and effective year-round, and that the seasonal pattern in the resulting load reductions will be approximately proportional to the seasonal pattern of the baseline loading. Page 71

83 FIGURE 37. FLOW-WEIGHTED MEAN, GROWING-SEASON MEDIAN RATIO Page 72
84 T a b l e 15. W I r i v e r t r i b u t a r y m o n i t o r i n g s t a t i o n s u s e d t o c o n v e r t f r o m a n n u a l f l o w - w e i g h t e d m e a n ( F W M ) t o g r o w i n g - s e a s o n m e d i a n ( G S M ) t o t a l p h o s p h o r u s c o n c e n t r a t i o n Subbasin Station ID Station Name FWM GSM FWM / GSM Little Eau Pleine River at Smokey Hill Rd Yellow River at STH Johnson Creek at CTH C Wisconsin River - Below Merrill Dam Yellow River downstream STH Tenmile Creek at Rangeline Rd Big Roche a Cri Creek at STH Lemonweir River at New Lisbon Baraboo River at CTH X Duck Creek at Duck Creek Road Big Eau Pleine River at STH Fenwood Creek at Hwy Plover River - Hwy Mill Creek at CTH PP bridge Big Rib River - Access Lodi-Spring Creek at Cty J Eau Claire River at Ross Ave At Kelly Pine River at Center Rd Freeman Creek at Sugar Bush Rd Critical Conditions Wisconsin s phosphorus criteria are assessed during the growing season (May-Oct) in streams and the summer (Jun-Sep) in lakes. These periods may be considered critical response conditions because it is when the biological response to phosphorus is strongest. However, the critical phosphorus loading conditions occur from March to June. As described in Section 5.1, this means that practices that reduce TP loading will need to be implemented and effective year-round, leading to a seasonal pattern in load reductions that is approximately proportional to the seasonal pattern of the baseline loading. Rivers and Streams Phosphorus loading capacity was calculated for headwater stream reaches as Qmean TPcrit / (FWM/GSM), where Qmean is the mean annual flow, TPcrit is the total phosphorus criterion (75 µg/l for headwater streams), and FWM/GSM is the conversion factor described in Section 5.1. Phosphorus loading capacity was calculated for non-headwater stream reaches using the headwater equation and then subtracting the loading capacity of all upstream reaches. Loading capacities for each stream reach are reported in Appendix J using the current criteria and Appendix K using the proposed SSC for Lakes Petenwell, Castle Rock, and Wisconsin. Page 73
85 Lakes and Reservoirs Phosphorus loading capacity for each impaired lake and reservoir was calculated with one of two models described in detail in Appendix H and Appendix I. Phosphorus loading capacity for Castle Rock and Petenwell Reservoirs was calculated with a custom model based on a paper by Jensen et al. (2006). The Jensen model is an empirical mass balance model that uses daily inflows of water and TP and reservoir water temperature as inputs. The change in TP concentration in the reservoir is modeled as a difference between input and output, the sedimentation of TP is deducted, and the release of TP from the sediment is added. Separate Jensen models were developed for Petenwell Reservoir, the main body of Castle Rock Reservoir, and the Yellow River arm of Castle Rock Reservoir. The models simulate daily TP concentrations over the monitoring period. Once calibrated (see Appendix H for details), the TP loading capacity for each reservoir (Table 16) was calculated by reducing the inflow TP concentration by a fixed percentage on every day of the year until the summer (June-Sept) mean TP concentration met the criterion (40 µg/l). Loading capacity for Big Eau Pleine Reservoir, Lake DuBay, and Lake Wisconsin was calculated with the BATHTUB model (Walker, 1999). Like the Jensen model, BATHTUB is an empirical mass balance model that uses inflows of water and P as inputs. Unlike the Jensen model, BATHTUB uses average annual inputs and therefore estimates steady state reservoir conditions. Separate BATHTUB models were developed for each water body and are described in detail in the reports in Appendix I. The TP loading capacity for each water body was calculated by reducing the annual TP load until the predicted summer TP concentration met applicable criterion (Table 16). T a b l e 16. S u m m a r y o f c u r r e n t l o a d i n g a n d l o a d i n g c a p a c i t y f o r t o t a l p h o s p h o r u s ( T P ) i n W I R i v e r B a s i n i m p a i r e d l a k e s a n d r e s e r v o i r s Water Body Inflow TP Load (tons/yr) Inflow TP Loading Capacity (tons/yr) TP Load Reduction 7 TP Retention Summer TP Conc (µg/l) TP Criterion (µg/l) Petenwell Lake % 18.5% Castle Rock Lake (Main Body) Castle Rock Lake (Yellow River Arm) Big Eau Pleine Reservoir % % % % 42% Lake DuBay 344 NA NA 12% Lake Wisconsin 640 NA NA NA Lake Delton % 20% Lake Redstone % 0% Minocqua Lake % 0% Kawaguesaga Lake % 0% Percent reductions in this table are from the current load, which is different from reductions from baseline, which is how reductions are expressed in the allocation tables. 8 Percent of TP load that is retained when inflow equals loading capacity. Page 74
86 Allowable Watershed Loads Total Maximum Daily Loads for Total Phosphorus in the Wisconsin River Basin The allowable annual load for TP was determined for each TMDL reach using the critical conditions described above. Daily loads were calculated by dividing the annual load by days per year and rounding up to three significant digits. Loading capacities for each reach are reported in Appendix J using the current criteria and Appendix K using the proposed SSC for Lakes Petenwell, Castle Rock, and Wisconsin. While TMDLs must be expressed as daily loading rates, ecosystem responses to phosphorus inputs occur at longer timescales and are largely decoupled from short-term fluctuations in phosphorus loading. The approach of using longer-term averages for implementation of the TMDL is consistent with how Wisconsin s phosphorus criteria were developed. Site-Specific Criteria and Load Capacity Analysis The loading capacity for the Wisconsin River Basin has been calculated under two scenarios, one based on the current promulgated criteria and a second under a SSC scenario. The SSC scenario is based on the proposed SSC for Lakes Petenwell, Castle Rock, and Wisconsin. The current default criteria and the proposed SSC are listed in Table 5 in Section 1.5. The calculation for the loading capacity under the proposed SSC followed the same process outlined above. In both scenarios, load capacity was calculated for headwater stream reaches, and non-headwater stream reaches, and the lakes and reservoirs. The only difference in the calculations was the loading capacity under the SSC analysis utilized the proposed SSC target concentrations in calculating the loading capacity. Page 75
87 6 POLLUTANT LOAD ALLOCATIONS The objective of a TMDL is to allocate loads among pollutant sources so that appropriate control measures can be implemented and water quality standards achieved. Wasteload allocations (WLAs) are assigned to point source discharges regulated by WPDES permits and nonpoint source loads are assigned load allocations (LAs), which include both anthropogenic and natural background sources of a given pollutant. The load allocation is the portion of the waterbody s total loading capacity attributed to existing and future nonpoint sources, including natural background sources. The wasteload allocation is the portion of the waterbody s total loading capacity that is allocated to point sources (for example, municipal or industrial wastewater facilities). TMDLs must also include a margin of safety (MOS) to account for the uncertainty in predicting how well pollutant reduction will result in meeting water quality standards, and account for seasonal variations. A reserve load capacity (RC) may be included in a TMDL to account for future discharges, changes in discharges, and other sources not defined through the TMDL study. This TMDL includes two sets of pollutant load allocations, one based on the current promulgated criteria and a second under the proposed SSC for Lakes Petenwell, Castle Rock, and Wisconsin. The current criteria and the proposed SSC are listed in Table 5 in Section 1.4. Both sets of allocations are set to meet the loading capacity under each of the two scenarios. The process used in the allocation process is the same under both scenarios; just the loading capacities changed for Lakes Petenwell, Castle Rock, and Wisconsin. The proposed process for implementing the allocations, specifically the wasteload allocations associated with WPDES permits, is discussed in Section 7.6; however, it is important to note that until the proposed SSC are adopted by rule and approved by USEPA only the allocations in Appendix J can be implemented in WPDES permits. TMDL Equation A TMDL is expressed as the sum of all individual WLAs for point source loads, LAs for nonpoint source loads, and an appropriate MOS, which takes into account uncertainty: TMDL = WLA + LA + MOS + RC WLA is the sum of wasteload allocations (point sources), LA is the sum of load allocations (nonpoint sources), MOS is the margin of safety, and RC is the reserve capacity. Load Allocation Approach Load and wasteload allocations were developed for the following source types: Load allocations: Wasteload allocations: Background sources (woodland, wetland, and Individual WPDES permittees (WW, natural areas) MS4, CAFO) Agricultural sources General WPDES permittees (WW, stormwater, CAFO) Non-permitted urban areas (NPUs) The phosphorus load allocation approach involves several steps: 1. Determining baseline loadings from all sources 2. Determining the reductions needed to meet local water quality criteria 3. Determining the reserve capacity allocation 4. Determining the reductions needed to meet downstream reservoir criteria Page 76

88 5. Checking the point source concentrations and adjusting, if needed The specifics of determining the baseline loadings for each source type are described in the following sections. Allocations for background and general permits were set equal to each of their baseline loads. Before allocating loads to other source types, the background load and a load assigned to general permits were subtracted from the total allowable reach load to set aside the loads that cannot likely be reduced further; the remaining load is considered controllable. The allocation process depends on whether the baseline reach load is greater than or less than the allowable reach load and whether the reach contains a reservoir with a criterion that is different than the incoming reach criterion. Each case is presented below, and visualized in Figure 25, Figure 26, and Figure 27. Case 1: Reach baseline load above reach allowable load Using the reach allowable load, the background and general permit loads are first subtracted. The reserve capacity is set to 5% of the remaining controllable load. If a downstream reservoir requires additional reductions, the reserve capacity and the remaining source loads are reduced proportionally by the necessary amount resulting in the reserve capacity remaining 5% of the final controllable load. FIGURE 38. ALLOCATION APPROACH WHEN BASELINE LOAD IS ABOVE ALLOWABLE LOAD Case 2: Reach baseline load below reach allowable load Since the baseline reach load is less than the reach allowable load, no load reductions are required to meet local water quality criteria. The reserve capacity is set to 5% of the reach controllable load (point source, MS4, NPS, NPU, & RC) and added to the baseline reach load. If a downstream reservoir requires reductions, the reserve capacity and the remaining source loads are reduced proportionally by the necessary amount resulting in the reserve capacity remaining 5% of the final controllable load. BKG GP BASELINE REACH LOAD PS+MS4+NPS+NPU BKG GP REACH LOADING CAPACITY PS+MS4+NPS+NPU RC TMDL LOAD FOR RESERVOIR BKG GP PS+MS4+NPS+NPU RC FIGURE 39. ALLOCATION APPROACH WHEN BASELINE LOAD IS BELOW ALLOWABLE LOAD Page 77
89 Case 3: Reach contains reservoir Reductions from the baseline reach load for subbasins containing reservoirs are made to the controllable load as necessary. The reserve capacity is then set at 5% of the reduced controllable load and subtracted from the remaining controllable load. BASELINE REACH LOAD BKG GP PS+MS4+NPS+NPU TMDL LOAD FOR RESERVOIR BKG GP RC PS+MS4+NPS+NPU FIGURE 40. ALLOCATION APPROACH FOR REACH WITH A RESERVOIR In general, loads are reduced by reach from upstream to downstream based on the local reach allowable load. At the reservoirs, the incoming load is calculated and compared to the allowable reservoir load, determined from modeling as described in Section 5.4. The difference is the amount of reduction that needs to come from all upstream subbasins. In an iterative process, the controllable load of each upstream reach is incrementally reduced until the total required amount of reduction to the reservoir is achieved. Reaches with reductions for local criteria that exceed the percent reduction for the downstream reservoir are not further reduced. In reservoir reaches, a fraction of the inflowing pollutant load may be retained. The fraction of pollutant that is retained was estimated from the BATHTUB and Jensen reservoir models (see Section 5.4) and is assumed to remain constant as the inflowing load is reduced. The reach calculations then continue downstream to the outlet of the basin. The fraction of the controllable load that is allocated to each source category is equal to its fraction of the baseline load as calculated over the 12-year model simulation period. These fractions were calculated separately for each reach. This method assigns responsibility for attaining water quality targets in proportion to each source s current contribution to the excess load. A final check is done to determine if any of the permitted wastewater facilities have received an allocation that puts their effluent concentration below the local water quality criterion. If their reductions are due to downstream reservoirs, the following applies: If the facility s baseline concentration is greater than the local criterion and the initial TMDL concentration is less than the local criterion, the load is recalculated so the final TMDL concentration is equal to the local reach criterion. If the facility s baseline concentration is less than the local criterion and the initial TMDL concentration is less than the baseline concentration, the load is recalculated so the final TMDL concentration equal to their baseline concentration. The resulting differences in load reductions are then subtracted from all other reaches upstream of the same reservoir. Allocations are then rebalanced so that reserve capacity is 5% of the allocable controllable load and each source s allocation is proportional to its baseline contribution. Allocations must not exceed established regulations. CAFO wasteload allocations are set to zero because CAFOs must comply with all authorized discharge and overflow requirements described in the State of Wisconsin's NPDES CAFO General Permit. In accordance with the CAFO General Permit, overflow events from CAFOs are allowable due to precipitation related overflows from CAFO storage structures which are properly designed, constructed, operated and maintained in accordance with CAFO permits. Discharges from such overflows are allowable only if they do not cause or contribute to a violation of water quality standards. Page 78
90 Allocations were calculated separately for each source or source type in each TMDL reach on an annual basis. The phosphorus allocations by reach and source type are presented in Appendix J. Baseline loads were presented in Appendix F. To address the possibility of SSCs being developed for Lakes Petenwell, Castle Rock, and Wisconsin, allocations were also calculated based on the SSC allowable loads and are shown in Appendix K. Load Allocations Background Sources Baseline background loads (forest, grassland, and wetlands,) were determined from the SWAT model results. Allocations for background sources are equal to the baseline background load for that TMDL reach (no load reduction from baseline). Details regarding the modeling conditions used to determine baseline loads from background sources can be found in the SWAT model report (Sections 3 and 4 of Appendix D) Agricultural Sources Baseline agricultural phosphorus loads were calculated from the cropland cover areas including dairy, cash grain and potato and vegetable rotations based on existing management conditions used in the SWAT calibrated model (i.e. baseline loads were set equal to existing loads). Details regarding the modeling conditions used to determine baseline loads from agricultural lands can be found in the SWAT model report (Sections 3 and 4 of Appendix D). Agricultural sources received allocations proportional to their contribution to the total controllable baseline phosphorus load for each reach over the 12-year model period. Total annual phosphorus load allocations for agricultural sources can be found in Table J-1 of Appendix J. Total annual phosphorus load allocations for agricultural sources based on the proposed SSCs for Lakes Petenwell, Castle Rock, and Wisconsin, are shown in Table K-1 of Appendix K. The load allocations are also presented based on the percent reduction from baseline in Tables J-5 and K-5. The percent reduction is expressed in three ways; as the percent reduction needed to protect local water quality, the percent reduction necessary to meet downstream water quality criteria such as those for Lakes Petenwell, Castle Rock, and Wisconsin, and the total percent reduction. The total percent reduction represents what is needed to meet both local and downstream water quality criteria Non-Permitted Urban Sources Baseline phosphorus loads for non-permitted urban areas were calculated from the non-background and nonagricultural land covers outside of a permitted MS4 municipal boundary as determined both in SWAT and in WinSLAMM. Non-permitted urban sources received allocations proportional to their contribution to the total controllable baseline load for each reach over the 12-year model period. Details regarding the modeling conditions used to determine baseline loads from non-permitted urban areas can be found in the SWAT model report (Sections 3 and 4 of Appendix D). Total annual phosphorus load allocations for non-permitted urban areas can be found in Table J-1 of Appendix J. Total annual phosphorus load allocations for non-permitted urban areas based on the proposed SSCs for Lakes Petenwell, Castle Rock, and Wisconsin, are shown in Table K-1 of Appendix K. The load allocations are also presented based on the percent reduction from baseline in Tables J-5 and K-5. The percent reduction is expressed in three ways; as the percent reduction needed to protect local water quality, the percent reduction necessary to meet downstream water quality criteria such as those for Lakes Petenwell, Castle Rock, and Wisconsin, and the total percent reduction. The total percent reduction represents what is needed to meet both local and downstream water quality criteria. Page 79
91 Page 80 Wasteload Allocation Permitted Municipal and Industrial Wastewater Discharges The phosphorus baseline loads for municipal and industrial wastewater discharges covered by an individual WPDES permit with specified limits are discussed in Section In generally, individually permitted wastewater dischargers received allocations proportional to their baseline load. Exceptions to this rule were made to low-strength discharges which discharged at concentrations less than the local water quality criterion. The WLA contained in this TMDL will be expressed in permits as a mass limit. In many cases, discharges will also receive a concentration limit for TP, based on the TBEL requirements in Subchapter II of NR 217, Wis. Adm. Code. Annual total phosphorus wasteload allocations by permitted point source are shown in Table J-3 in Appendix J. Wasteload allocations set to address the proposed SSCs for Lakes Petenwell, Castle Rock, and Wisconsin, are shown in Table K-3 of Appendix K. Tables J-3 and K-3 both present wasteload allocations broken out by the total wasteload allocation for the facility, the wasteload allocation assigned to the facility needed to meet local water quality in the reach the facility discharges into, and the wasteload allocation required to meet downstream water quality in Lakes Petenwell, Castle Rock, and Wisconsin. WDNR has broken out the allocations in this manner to help facilitate water quality trading, since the geographic extent in which trades can occur is based on the point of standards application as outlined in the Guidance for Implementing Water Quality Trading in WPDES Permits. A copy of the guidance can be found at: or by searching for water quality trading at Section 40 CFR (d), s. NR (4), and s. NR (7), Wis. Adm. Code, specifies that unless impracticable, permit effluent limits must be expressed as weekly and monthly averages for publicly owned treatment works and as daily maximums and monthly averages for all other continuous discharges. A continuous discharge is a discharge which occurs without interruption throughout the operating hours of the facility, except for infrequent shutdowns for maintenance, process changes, or other similar activities (40 CFR 122.2). The Department has demonstrated the impracticability of expressing WQBELs for TP as specified in 40 CFR (d). The impracticability demonstration indicates that WQBELs for TP shall be expressed as a monthly average, if the TP WQBEL is equivalent to a concentration value greater than 0.3 mg/l, and as a six-month average and a monthly average limit of 3 times the six-month average, if the TP WQBEL is equivalent to a concentration value less than 0.3 mg/l. For non-continuous discharges, methods for converting WLAs into permit limits should be determined on a case-by-case basis. For example, some discharges do not occur continuously and often vary from year to year, depending on weather conditions or production processes. In these cases, it may be appropriate to express limits by season or as a total annual amount. In many cases, using shorter term limits (daily, monthly) might have the effect of unduly limiting operational flexibility and, since TMDLs are required to be protective of critical conditions, a seasonal or annual limit would be consistent with the TMDL and protective of water quality. Discharges covered by individual permits that have surface water intake structures are allowed to pass through the phosphorus that is present due to the water supply but are expected to remove any excess that is added or concentrated in their discharge to meet their wasteload allocation. There are a limited number of discharges in the basin that discharge to large wetland complexes or other non-contributing areas which may not impact downstream surface waters. As wetlands and other limited aquatic life waters do not have phosphorus criteria (see s. NR (6), Wis. Admin. Code), discharges to
92 these types of systems have a point of standards compliance downstream of their outfall and the wasteload allocation is designed to be protective of this and all downstream locations. In such instances, the Department may consider phosphorus losses prior to the point of standards compliance as part determining whether permit limitations are consistent with the TMDL wasteload allocation General Permits WDNR authorizes the discharge of stormwater and wastewater from industrial facilities, CAFOs, and construction sites under a set of general WPDES permits. Unlike individual WPDES permits, general permits are not written to reflect site-specific conditions of a single discharger, but rather are issued to cover multiple dischargers that have similar operations and types of discharges. Stormwater general permits cover discharges from industrial and construction sites (see CAFO general permits are issued to large dairies with 1,000 to 5,720 animal units (see Wastewater general permits cover multiple categories, including: NCCW, nonmetallic mining (quarries), car washes, swimming pools, and other discharges (see for a full list of Wastewater general permits). Wasteload allocations for general permittees located within an MS4 boundary were included in the MS4 WLA. WLAs for general permittees located outside of MS4 areas were allocated as 10% of the nonpermitted urban baseline load for TP. This general permit load was set aside from the loading capacity with no reduction from the baseline described in Section Many NCCW discharges in this TMDL area are covered by a general permit (WI ). Similar conditions are assumed for these facilities as for those with individual permits. That is, for facilities that use water from a public water supply, it is assumed that phosphorus will be present in the NCCW if added by the water supply. Discharges covered by general permits that have surface water intake structures are assumed to have no net addition. Similar to individual permit holders, general permittees are allowed to pass through the phosphorus that is present due to the water supply but are expected to remove any excess that is added or concentrated in their discharge. NCCW facilities covered under the general permit and located in watersheds with approved TMDLs are required to submit quarterly monitoring results for P and TSS. These monitoring results will be used to track the total mass allocation used by NCCW facilities in each watershed. If through the increased monitoring and tracking it is determined that sufficient allocation has not been set aside for NCCW facilities, facilities may be switched to individual permits with discharge requirements placed in the permit sufficient to meet TMDL allocations and/or reserve capacity may be used to increase the WLA for general permits, where necessary Permitted Municipal Separate Storm Sewer Systems As described in Section , there are 15 permitted MS4s within the basin that will receive wasteload allocations under this TMDL project. Baseline MS4 TP and TSS loads were determined from the WinSLAMM modeling described in Section and detailed in Section 4.4 of Appendix D. The WinSLAMM results used in the existing conditions SWAT model were adjusted for baseline conditions to reflect the 20% TSS reduction requirement and corresponding 15% reduction in TP. The corresponding 15% TP reduction is calculated in SLAMM by applying BMPs to obtain the 20% TSS reduction. The reduction relationship is not 1:1 because of the portioning between phosphorus attached to sediment and soluble phosphorus. The permitted area is determined by the US Census Bureau s mapped Urbanized Area, adjacent developed areas, or areas that are connected or will connect to other municipal separate storm sewer systems regulated under subch. I of NR 216, Wis. Adm. Code. Because of the large spatial expanse of the Wisconsin River Basin, each modeled MS4 area utilized a different rainfall file to best represent local conditions. Therefore, unique monthly flows and loads were generated for each MS4 to determine baseline conditions. Page 81
93 MS4 permittees received allocations proportional to their contribution to the total baseline load for each TMDL reach to which they discharge. There may be MS4s in the basin that have already implemented practices that achieve an annual average TSS reductions of greater than 20% or TP reduction of greater than 15%. While these individual modeled results have not been included in the TMDL analysis, these abovebaseline condition reductions will be credited towards meeting water quality targets established in the WPDES permits regulating these municipalities. Marathon County and University of Wisconsin-Stevens Point are both covered by a WPDES MS4 permit but will not receive individual allocations. Instead, their allocations are lumped into the portions of each city, village, or town MS4 that they discharge to or lie within. This is because at the current level of analysis, it was not possible to break-out blended and nested MS4 systems. As part of the implementation planning process, permittees are required to map out their MS4 systems. Once completed, allocations can be partitioned based on area; however, once implemented this simplifies to Marathon County and University of Wisconsin-Stevens Point receiving the same percent reduction assigned to the city, village, or town MS4 that portions of their MS4 discharge to or lie within. Refer to the MS4 TMDL Implementation Guidance for details on how the allocation is partition and the percent reduction is used to implement the TMDL allocations; TMDL Guidance for MS4 Permits: Planning, Implementation, and Modeling Guidance. The guidance and addendums can be found at: Stormwater discharge from Wisconsin Department of Transportation (WisDOT) land areas are not currently covered by a WPDES permit; however, a WPDES permit is being developed. This permit, referred to as the TS4 permit, along with the conditions of a memorandum of understanding with WDNR will be used to implement the TMDL requirements for WisDOT discharges. A section of the MS4 permit is dedicated to the implementation of the TMDL requiring WisDOT to comply with the TMDL allocation set forth in this TMDL. The specific TS4 allocation is included in the allocation for each MS4 with WisDOT area. At the time the watershed modeling was conducted for this TMDL, sufficient detail did not exist to partition out the TS4 allocation and assign an explicit allocation. Please refer to the MS4 TMDL Implementation Guidance for details on how to partition the allocation; TMDL Guidance for MS4 Permits: Planning, Implementation, and Modeling Guidance. The guidance and addendums can be found at: Annual total phosphorus wasteload allocations by MS4 and reach are shown in Table J-4 in Appendix J. Total annual phosphorus wasteload allocations by MS4 and reach based on the proposed SSCs for Lakes Petenwell, Castle Rock, and Wisconsin, are shown in Table K-4 of Appendix K. The percent reduction from baseline that would apply to each MS4 are broken out by reach in Tables J-5 and K-5. The percent reduction is expressed in three ways; as the percent reduction needed to protect local water quality, the percent reduction necessary to meet downstream water quality criteria such as those for Lakes Petenwell, Castle Rock, and Wisconsin, and the total percent reduction. The total percent reduction represents what is needed to meet both local and downstream water quality criteria. Guidance related to applying the percent reduction to implement the TMDL can be found in the MS4 TMDL Implementation Guidance: TMDL Guidance for MS4 Permits: Planning, Implementation, and Modeling Guidance. The guidance and addendums can be found at: Concentrated Animal Feeding Operations Baseline CAFO loads were set to zero as discharges from CAFO production areas must be consistent with WPDES permit requirements. Likewise, CAFOs received a wasteload allocation of zero. Land spreading loads associated with CAFO operations are included in the nonpoint source allocations. Page 82
94 Margin of Safety Total Maximum Daily Loads for Total Phosphorus in the Wisconsin River Basin A margin of safety (MOS) is included in the TMDL to account for any lack of knowledge concerning the relationship between load and wasteload allocations and water quality. The MOS can be implicit using conservative assumptions in the analysis or explicit by allocating a portion of the loading directly to a MOS. The MOS in this TMDL is implicit and is based on one conservative assumptions and one aspect of the allocation process. First, the fraction of the TP load from background (forest and wetland) sources may be over-estimated. The TP concentration assigned to groundwater in the SWAT model is really an estimate of background stream TP (Robertson et al. 2006). An unknown fraction of background stream TP is derived from land surface processes, so assigning this concentration entirely to groundwater means that background TP loads are likely overestimated. Therefore, if controllable TP loads are reduced by their allocated amounts, the net TP load may be lower than needed to meet TP criteria. Second, the loading capacity of Petenwell and Castle Rock Reservoirs requires load reductions from most tributaries beyond what is needed to meet local stream criteria. The difference between these two levels of loading capacity is an MOS for tributary water quality. Across the entire basin, approximately half of the required load reduction is attributable to a downstream reservoir (Tables J-5 and K-5). An additional explicit MOS was determined to be unnecessary because understanding of the relationship between TP loading and water quality response is excellent in the Wisconsin River Basin. First, the amount of monitoring data collected to support the TMDL development was unprecedented in Wisconsin, including the number of stations, period of record, and sampling frequency. Second, the initial bias in modeled pollutant loads was corrected with the tributary routing model. Third, the main stem routing analysis found a consistent relationship between measured main stem TP loads and the sum of measured and modeled tributary loads, further validating the tributary modeling and bias correction. And fourth, the recommended site-specific TP criteria for Petenwell and Castle Rock Flowages, and Lake Wisconsin are based on strong empirical relationships between TP and Chlorophyll-a, the designated use indicator. In summary, there are multiple lines of evidence that the loading capacity estimates are accurate and will result in the attainment of designated uses in the Wisconsin River Basin. Reserve Capacity A reserve capacity (RC) was included in the TMDL allocations to account for future discharges, changes in current discharger loading, and other sources not defined through TMDL development. Reserve capacity is intended to provide wasteload allocation for new or expanding industrial, CAFO, or municipal WPDES individual permit holders. RC may be applied to general permittees if it is determined, through analysis of discharge monitoring data, that the amount set aside for GPs is not enough to cover the actual discharge amount. The reserve capacity is not intended to be applied to MS4s. For TP, the natural background load and general permitted baseline loads were subtracted from the total allowable load for each TMDL reach, and then the RC was set as 5% of the remaining controllable load. This provides adequate reserve capacity for potential new or expanding dischargers in headwater sections of the basin. In addition, reserve capacity accumulates from contributing reaches moving down through the basin making more available for dischargers located on larger downstream rivers. This approach affords dischargers greater flexibility in where they can locate or expand, minimizes impacts on existing dischargers, and is consistent with the observed practice of larger dischargers locating on larger bodies of water. Baseline loads from municipal wastewater treatment plants were calculated using the design flow of the facility, which is based on a 20-year design life; therefore, the allocations for these point sources should account for future growth in many communities. Page 83
95 If a permittee wishes to commence a new discharge or expand an existing discharge of a pollutant covered by the TMDL and within the area covered by the TMDL, the permittee must submit a written notice of interest for reserve capacity along with a demonstration of need to WDNR. Interested dischargers will not be given a portion of the reserve capacity unless they can demonstrate a need for a new or increased wasteload allocation. Examples of point sources in need of WLA would include those that are a new discharge or those that are significantly expanding their current discharge and would be unable to meet current WLAs despite optimal operation and maintenance of their treatment facility. A demonstration of need should include an evaluation of conservation measures, recycling measures, and other pollution minimization measures. New dischargers must evaluate current available treatment technologies and expanding dischargers should evaluate optimization of their existing treatment system and evaluation of alternative treatment technologies. In addition to evaluation of treatment options, an expanding discharger must demonstrate that the request for reserve capacity is due to increasing productions levels or industrial, commercial, or residential growth in the community. If the department determines that a new or expanding discharger qualifies for reserve capacity, the reserve capacity, if available, will be distributed using the procedures outline below: New Discharger: For a new discharger, calculate the water quality based effluent limit (WQBEL) per ch. NR 217, Wis. Adm. Code, for phosphorus. If the discharger can meet the resulting limit with available technology than the limit is translated into a mass and this mass becomes the amount of reserve capacity allocated to the discharger. If the discharger is unable to meet the limit with available technology than more reserve capacity, up to a maximum cap, can be allocated to the discharger. The maximum cap is calculated based on the facility s flow and the highest concentration for a similar type facility and treatment system. Determination of the wasteload allocation available to a new discharge will depend on the type and condition of the immediate receiving water. Limitations for new discharges to Outstanding Resource Waters shall be based on s. NR (3), Wis. Adm. Code. Limitations for new discharges to Exceptional Resource Waters which are not needed to prevent or correct either an existing surface or groundwater contamination situation, or a public health problem shall be based on s. NR (4)(b), Wis. Adm. Code. For all other situations involving new discharges, the following procedures apply to determine the appropriate mass allocation: a) Determine the mass of reserve capacity that is available in the given reach. b) Calculate the water quality based effluent limit (WQBEL) per s. NR (2)(a) and the associated mass limit per s. NR (3), Wis. Adm. Code. Calculation should be based on current upstream water quality and for purposes of this calculation any other discharges within the given reach may be ignored. c) Calculate the mass load associated with the baseline condition for the class of the new discharger. Then apply the TMDL reductions, consistent with the applicable reach, to the baseline condition to determine the resultant mass. Baseline conditions, consisting of concentration and flows, are set for different classes of dischargers and are summarized in Section d) Set the wasteload allocation equal to the most restrictive of the values determined by the above methods. For a new discharge directly to a lake or reservoir, use the following procedure to determine the appropriate mass allocation: Page 84
96 a) Determine the amount of reserve capacity that is available for the lake or reservoir. This can include unassigned reserve capacity from contributory reaches located upstream of the lake or reservoir. b) Calculate the WQBEL per s (3) and associated mass limit per s. NR (3), Wis. Adm. Code. c) Set the wasteload allocation equal to the more restrictive of the values determined by the above methods. Expanding Discharger: For an expanding discharger, reserve capacity will be allocated to cover the increased mass attributed to the facility expansion, measured as the increase in flow over the flow assumed in the TMDL baseline (see Section ), minus any reductions that can be realized through optimization or economically viable treatment technologies. If a new or expanding discharger requires more mass than what was allocated through reserve capacity the difference between the mass discharged and their allocation can be made up through an offset such as water quality trading. If there is not sufficient reserve capacity available, the discharge must be offset or the TMDL can be re-evaluated to determine if more assimilative capacity has become available since the original analysis. Reserve capacity should be taken equally from all reaches upstream and in which the discharger is located. As additional demands are placed on available reserve capacity, it may become necessary to shift the location that previously assigned reserve capacity was taken, provided the total loading capacity for each reach is maintained. WDNR will maintain a database system to track assigned reserve capacity. Once reserve capacity reaches levels that it is no longer usable, the TMDL will need to be re-evaluated to see if additional assimilative capacity has become available since the original TMDL analysis due to changes in flow or implementation of the reductions prescribed in the TMDL. Reserve capacity is not required for new or expanding permitted MS4s. For new or expanding permitted MS4s, the mass associated with the load allocation for the nonpermitted, undeveloped, or agricultural land, that is now part of the permitted MS4, is transferred to the wasteload allocation with a percent reduction in pollutant load assigned to the new or expanding permitted MS4 area consistent with the reductions stipulated in the TMDL for the reachshed. Refer to TMDL Guidance for MS4 Permits: Planning, Implementation, and Modeling Guidance and corresponding addendums for process details. The MS4 guidance and addendums can be found at For CAFOs, the TMDL assigns the production area a wasteload allocation of zero; however, reserve capacity is available to cover a new or expanding continuous or intermittent surface water discharge resulting from a manure treatment system. If reserve capacity is not available, the mass resulting from a treatment system discharge must be offset through water quality trading. This offset can be generated through reductions in pollutant loads associated with modifications in manure applications to fields resulting from the treatment system or changes in the CAFO s operation. Fields receiving manure from the CAFO are covered by the nonpoint load allocation. WDNR will use the information provided by the permittee to determine if reserve capacity is available and then issue, reissue, or modify a WPDES permit to implement a new WLA based on application of reserve capacity. The new WLA will be used as the basis for effluent limits in the WPDES permit. EPA will be notified if a new or increased WLA is developed. Pursuant to 40 CFR (g) and s. NR (1)(c), Wis. Adm. Code, a WPDES permit does not convey any property rights of any sort nor any exclusive privilege. All proposed reserve capacity assignments are subject to WDNR review and approval and must be consistent with applicable regulations. Reserve capacity decisions and related permit determinations are subject to public notice and participation procedures as well Page 85
97 as opportunities for challenge at the time of permit modification, revocation and reissuance, or reissuance under Chapter 283, Wis. Stats. Seasonal Variation The method for linking TP criteria to loading capacity is based on their existing relationship and the assumption that the frequency distribution and seasonal pattern of a reduced TP load will be similar to the current conditions. For nonpoint sources, this means that changes in land management will need to be effective throughout the year. While this may not be true for any single practice, it is anticipated that a broad suite of practices will be used, and that the collective effects of these practices at the watershed scale will meet this assumption. Discharges from point sources have much less seasonal variation, and it is expected that any required reductions will be approximately uniformly distributed seasonally. Page 86
98 7 TMDL IMPLEMENTATION Implementation Planning Total Maximum Daily Loads for Total Phosphorus in the Wisconsin River Basin The next step following approval of the TMDL is to develop an implementation plan that specifically describes how the TMDL goals can be achieved, over time. WDNR has hired a TMDL Project Manager to deal specifically with implementation of the TMDL. Implementation planning will build on past planning and implementation of practices to control or reduce nutrient and sediment pollutants in the Wisconsin River Basin. The implementation planning process will develop strategies to most effectively utilize existing federal, state, and county-based programs to achieve wasteload and load allocations outlined in the TMDL. This TMDL will be implemented through enforcement of existing regulations, financial incentives, and various local, state, and federal water pollution control programs. The plan will build upon knowledge gained in recent planning efforts, some of which are discussed in more detail below. Effective implementation of the load allocations in the TMDL requires addressing both environmental conditions and the choices people make that impact the environment. Because nonpoint source pollution control relies heavily on the voluntary actions of citizens, applying best practices to those problems will require establishing trusting relationships with the public and at the right scale so that water quality goals are achievable and measurable. The pollution problems that remain require new solution strategies that encourage and support collaboration, citizenship, transparency, and accountability at all levels of government (LimnoTech 2013). As part of this effort, WDNR has developed a framework for communicating agricultural load allocation by translating watershed models to field-scale models that are well understood by the agricultural community, ultimately putting the TMDL tools in the hands of producers to enhance their ability to estimate the downstream benefits of best management practices on their own fields (see Appendix N for TP targets for agricultural producers, and methods that can be used to aid with planning water quality trading agreements that result in meeting these TP targets). Required by the Clean Water Act, reasonable assurances provide a level of confidence that the wasteload allocations and load allocations in TMDLs will be implemented. This TMDL will be implemented through enforcement of existing regulations, financial incentives, and various local, state, and federal water pollution control programs. The following subsections describe some of the activities, programs, requirements, and institutional arrangements that will provide reasonable assurance that this TMDL will be implemented and that the water quality goals will be achieved. Reasonable Assurances for Point Sources WDNR regulates point sources through the WPDES permit program. Individual permits are issued to municipal and industrial wastewater discharges. General permits are issued to some classes of industries or activities that are similar in nature, such as NCCW and certain stormwater discharges. Once the TMDL WLAs have been state and federally approved, reissued permits must contain conditions consistent with the wasteload allocations. Individual permits issued to municipal and industrial wastewater discharges will include discharge limits consistent with the approved wasteload allocations. Dischargers with general WPDES permits will be evaluated to determine if additional requirements are necessary to ensure that discharges remain consistent with TMDL goals. This could include issuing individual WPDES permits to facilities that currently hold general permits. WDNR regulates stormwater discharges from certain MS4s, industries, and construction sites under WPDES permits issued pursuant to ch. NR 216, Wis. Adm. Code. WDNR also established developed urban area, construction site, and post-construction performance standards under ch. NR 151, Wis. Adm. Code, which are implemented through stormwater MS4 and construction site permits. Once the TMDL WLAs have been state and federally approved, WDNR will incorporate permit conditions into stormwater permits consistent with the TMDL WLAs. Existing programs that detect and eliminate illicit discharges will continue to be implemented by municipalities. WPDES permit conditions already require monitoring and elimination of discovered discharges. Page 87
99 WDNR will monitor and enforce CAFO permit requirements so that CAFOs are operated and maintained to prevent discharges as required by their WPDES permit. Reasonable Assurances for Nonpoint Sources To attain the TMDL reduction goals, management measures must be implemented and maintained over time to control phosphorus and sediment loadings from nonpoint sources of pollution. Wisconsin s Nonpoint Source Pollution Abatement Program (NPS Program), described in the state s Nonpoint Source Program Management Plan (WDNR, 2015), outlines a variety of financial, technical, educational, and enforcement programs, which support implementation of management measures to address nonpoint source pollution. WDNR and the Wisconsin Department of Agriculture, Trade, and Consumer Protection (DATCP) coordinate statewide implementation of the NPS Program. The NPS Program includes core activities and programs, which are a high priority and the focus of WDNR and DATCP s efforts to address NPS pollution; these programs include those described in the following sections Statewide Agricultural Performance Standards & Prohibitions WDNR is a leader in the development of regulatory authority to prevent and control nonpoint source pollution. Chapter NR 151, Wis. Adm. Code, establishes runoff management performance standards and prohibitions for agricultural and non-agricultural facilities and practices. These standards are intended to be minimum standards of performance necessary to achieve water quality standards, as described in Chapter Implementing the performance standards and prohibitions on a statewide basis is a high priority for the NPS Program and requires having adequate WDNR staff and financial resources in order to meet the NR 151 implementation and enforcement procedures (NR and ). In particular, the implementation and enforcement of agricultural performance standards and manure management prohibitions, listed below, throughout the TMDL area will be critical to achieve the necessary nonpoint source load reductions. Such effort will require having adequate amounts of cost share funding to cover the cost for meeting TMDL NPS reductions. Tillage setback: A setback of 5 feet from the top of a channel of a waterbody for the purpose of maintaining stream bank integrity and avoiding soil deposits into state waters. Tillage setbacks greater than 5 feet but no more than 20 feet may be required if necessary to meet the standard. Harvesting of self-sustaining vegetation within the tillage setback is allowed. Phosphorus Index (PI): A limit on the amount of phosphorus that may run off croplands and pastures as measured by a phosphorus index with a maximum of 6, averaged over an eight-year accounting period, and a PI cap of 12 for any individual year. Process wastewater handling: a prohibition against significant discharge of process wastewater from milk houses, feedlots, and other similar sources. Meeting TMDLs: A standard that requires crop and livestock producers to reduce discharges if necessary to meet a load allocation specified in an approved Total Maximum Daily Load (TMDL) by implementing targeted performance standards specified for the TMDL area using best management practices specified in ch. ATCP 50, Wis. Adm. Code. If a more stringent or additional performance standard is necessary to meet water quality standards, it must be promulgated by rule before compliance is required. Before promulgating targeted performance standards to implement a TMDL, the department must determine, using modeling or monitoring, that a specific waterbody or area will not attain water quality standards or groundwater standards after substantial implementation of the existing ch. NR 151, Wis. Admin. Code performance standards and prohibitions. Sheet, rill and wind erosion: All cropped fields shall meet the tolerable (T) soil erosion rate established for that soil. This provision also applies to pastures. Page 88
100 Manure storage facilities: All new, substantially altered, or abandoned manure storage facilities shall be constructed, maintained or abandoned in accordance with accepted standards, which includes a margin of safety. Failing and leaking existing facilities posing an imminent threat to public health or fish and aquatic life or violate groundwater standards shall be upgraded or replaced. Clean water diversions: Runoff from agricultural buildings and fields shall be diverted away from contacting feedlots, manure storage areas and barnyards located within water quality management areas (300 feet from a stream or 1,000 feet from a lake or areas susceptible to groundwater contamination). Nutrient management: Agricultural operations applying nutrients to agricultural fields shall do so according to a nutrient management plan (Each nutrient management plan must be designed to limit or reduce the discharge of nutrients to waters of the state for the purpose of complying with state water quality standards and groundwater standards. In addition, for croplands in watersheds that contain impaired surface waters, a plan must be designed to manage soil nutrient concentrations so as to maintain or reduce delivery of nutrients contributing to the impairment of impaired surface waters. ATCP c additional requirements for all nutrient management plans. This standard does not apply to applications of industrial waste, municipal sludge or septage regulated under other WDNR programs provided the material is not commingled with manure prior to application. Manure management prohibitions: o o o o no overflow of manure storage facilities no unconfined manure piles in a water quality management area no direct runoff from feedlots or stored manure into state waters no unlimited livestock access to waters of the state in locations where high concentrations of animals prevent the maintenance of adequate or self-sustaining sod cover WDNR, DATCP, and the county Land Conservation Departments (LCDs) will work with landowners to implement agricultural and non-agricultural performance standards and manure management prohibitions to address sediment and nutrient loadings in the TMDL area. Some landowners voluntarily install BMPs to help improve water quality and comply with the performance standards. Cost-sharing funds, provided via state or federal funds, may or may not be available for many of these BMPs. Wisconsin statutes, and the NR 151 implementation and enforcement procedures of s. NR and Wis. Admin. Code, require that farmers must be offered at least 70% cost-sharing funds for BMP installation before they can be required to comply with the agricultural performance standards and prohibitions. If cost-share money is offered, those in violation of the standards are obligated to comply with the rule. The amount of cost sharing funds available for use by LCD s, DATCP and WDNR will require implementing the performance standards and prohibitions throughout the TMDL area over time. DATCP s Farmland Preservation Program requires that any agricultural land enrolled in the program must be determined to be in compliance with the performance standards by no later than 2020 to continue receive tax credits associated with the program County Agricultural Performance Standards & Prohibitions Towns and counties may adopt ordinances to require permits for manure storage structures and regulate the spreading of the manure and wastes from these facilities. The DATCP oversees these local regulations under state statute Chapter 92. DATCP's administrative rule ATCP 50 spells out standards for manure storage ordinances, which may include the annual submission of a nutrient management plan that complies with s. ATCP (3) Wis. Admin Code. Local governments must submit these ordinances to DATCP for review, but DATCP approval is not required. All counties with significant agricultural activity have adopted manure storage ordinances (Figure 41). The requirements associated with these ordinances varies by county. Page 89

101 Counties and towns may also require additional conservation practices on farm, however an offer of costsharing must be provided. DATCP and WDNR must approve any local regulations that exceed state agricultural performance standards WDNR Cost Sharing Grant Programs The counties and other local units of government in the TMDL area may apply for grants from WDNR to control NPS pollution and, over time, meet the TMDL load allocation. The WDNR supports NPS pollution abatement by administering and providing costsharing grants to fund BMPs through various grant programs, including, but not limited to: The Targeted Runoff Management (TRM) Grant Program The Notice of Discharge (NOD) Grant Program The Urban Nonpoint Source & Storm Water Management Grant Program The Lake Planning Grant Program The Lake Protection Grant Program The River Planning & Protection Grant Program Many of the counties and municipalities in the TMDL area have a track record of participating in these NPS-related grant programs Targeted Runoff Management (TRM) Grant Program FIGURE 41. COUNTIES WITH MANURE STORAGE ORDINANCES TRM GRANT PROGRAM OVERVIEW Targeted Runoff Management (TRM) grants are provided by the WDNR to control nonpoint source pollution from both urban and agricultural sites. A combination of state General Purpose Revenue, state Bond Revenue, and federal Section 319 Grant funds is used to support TRM grants. The grants are available to local units of government (typically counties) and targeted at highpriority resource problems. TRM grants can fund the design and construction of agricultural and urban BMPs. Some examples of eligible BMPs include livestock waste management practices, some cropland protection, and streambank protection projects. These and other practices eligible for funding are listed in s. NR , Wis. Adm. Code. Revisions to ch. NR 153, Wis. Adm. Code, ( which governs the program, took effect on January 1, 2011, and modified the grant criteria and procedures, increasing the state s ability to support performance standards implementation and TMDL implementation. Since the calendar year 2012 grant cycle, projects may be awarded in four categories: Page 90
102 Small Scale Large Scale TMDL Implements a TMDL Agricultural or urban focus Implements a TMDL Agricultural focus only Non-TMDL Implements NR 151 performance standards Agricultural or urban focus Implements NR 151 performance standards Agricultural focus only Section (4c), Wis. Stats., defines additional priorities for Targeted Runoff Management Projects as follows: Projects must be targeted to an area based on any of the following: o Need for compliance with established performance standards. o Existence of impaired waters. o Existence of outstanding or exceptional resource waters. o Existence of threats to public health. o Existence of an animal feeding operation receiving a Notice of Discharge. o Other water quality concerns of national or statewide importance. Projects are consistent with priorities identified by WDNR on a watershed or other geographic basis. Projects are consistent with approved county land and water resource management plans. The maximum cost-share rate available to TRM grant recipients is up to 70% of eligible costs (maximum of 90% in cases of economic hardship), with the total of state funding not to exceed established grant caps. TRM grants may not be used to fund projects to control pollution regulated under Wisconsin law as a point source. Grant application materials are available on the WDNR web site at: TRM GRANT PROJECTS IN THE TMDL PROJECT AREA Since 2005, 29 TRM grants have funded the construction and implementation of agricultural best management in the TMDL project area. Over $3.7 million dollars in TRM grant awards have gone towards funding over $5.3 million in agricultural management practices, including construction of manure facilities storage, barnyard runoff control practices and implementation of other ch. NR 151, Wis. Admin. Code runoff management standards. A complete list of TRM grant projects funded since 2005 are listed in Table L-1, Agricultural Runoff Management Grant Projects in WI River TMDL project area. Urban Runoff management grant projects in the basin during this same timeframe are listed in Table L-2. One recent notable TRM grant awarded in the project area was the $805, award received by Marathon County for Fenwood Creek Watersheds, the most significant P loading HUC-12 within the Big Eau Pleine Watershed; the Big Eau Pleine itself is the highest loading tributary upstream of Petenwell Reservoir. This grant award spans Jan. 1, 2016 to Dec. 31, 2018 and includes funding for both cropping ($25,373) and structural BMP s ($739,935), as well as local assistance ($39,825). As a condition of the grant, Marathon County has developed a 9-key element watershed plan for Fenwood Creek (HUC-12) watershed to meet or make progress towards the Wisconsin River TMDL water quality reduction goal requirements for this watershed. Page 91
103 7.3.5 Notice of Discharge (NOD) Grants Program NOD PROGRAM OVERVIEW Notice of Discharge (NOD) Project Grants, also governed by ch. NR 153, Wis. Adm. Code, are provided by WDNR and DATCP to local units of government (typically counties). A combination of state General Purpose Revenue, state Bond Revenue, and federal Section 319 Grant funds are used to support NOD grants. The purpose of these grants is to provide cost sharing to farmers who are required to install agricultural best management practices to comply with Notice of Discharge requirements. Notices of Discharge are issued by the WDNR under ch. NR 243 Wis. Adm. Code (Animal Feeding Operations - code/nr/nr243.pdf), to small and medium animal feeding operations that pose environmental threats to state water resources. The project funds can be used to address an outstanding NOD or an NOD developed concurrently with the grant award. Both state agencies work cooperatively to administer funds set aside to make NOD grant awards. Although the criteria for using agency funds vary between the two agencies, WDNR and DATCP have jointly developed a single grant application that can be used to apply for funding from either agency. The two agencies jointly review the project applications and coordinate funding to assure the most cost-effective use of the available state funds. Funding decisions must consider the different statutory and other administrative requirements each agency operates under. Grant application materials are available on the WDNR web site at: NOD GRANT PROJECTS IN THE TMDL PROJECT AREA Since 2005, 14 NOD grants have funded the construction and implementation of agricultural best management in the TMDL project area. Over $2.1 million dollars in NOD grant awards have gone towards funding over $3.0 million in agricultural management practices, including construction manure facilities storage, barnyard runoff control practices and implementation of other ch. NR 151, Wis. Admin. Code runoff management standards. A complete list of NOD grant projects funded since 2005 are included in Table L-1 of Appendix L, Agricultural Runoff Management Grant Projects in WI River TMDL project area. Currently there are six livestock facilities located within the project area have been determined to be in violation of state agricultural performance standard and/or manure management prohibition requirements. As a result, these facilities have received NOD grants to install and implement BMP s to meet NR 151 agricultural performance standard and manure management prohibitions Lake Management Planning Grants The WDNR provides grants to eligible parties to collect and analyze information needed to protect and restore lakes and their watersheds and develop lake management plans. Section , Wis. Stats., and ch. NR 190, Wis. Adm. Code, provide the framework and guidance for WDNR s Lake Management Planning Grant Program. Grant awards may fund up to 66% of the cost of a lake planning project. Grant awards cannot exceed $25,000 per grant for large-scale projects. Eligible planning projects include: Gathering and analysis of physical, chemical, and biological information on lakes. Describing present and potential land uses within lake watersheds and on shorelines. Reviewing jurisdictional boundaries and evaluating ordinances that relate to zoning, sanitation, or pollution control or surface use. Page 92
104 Assessments of fish, aquatic life, wildlife, and their habitats. Gathering and analyzing information from lake property owners, community residents, and lake users. Developing, evaluating, publishing, and distributing alternative courses of action and recommendations in a lake management plan. Grants can also be used to investigate pollution sources, including nonpoint sources, followed by incorporation into the lake management plan of strategies to address those sources. Investigation can involve many types of assessment, including determining if the water quality of the lake is impaired. A plan approved by WDNR for a lake impaired by NPS pollution should incorporate the U.S. EPA s Nine Key Elements for watershed-based plans. Grant application materials are available on the WDNR web site at: Lake and River Protection Grants LAKE PROTECTION GRANT PROGRAM OVERVIEW The WDNR provides grants to eligible parties for lake protection grants. Sections and , Wis. Stats., and ch. NR 191, Wis. Adm. Code, provide the framework and guidance for the Lake Protection Grant Program. Grant awards may fund up to 75 percent of project costs (maximum grant amount $200,000). Eligible projects include: Purchase of land or conservation easements that will significantly contribute to the protection or improvement of the natural ecosystem and water quality of a lake. Restoration of wetlands and shorelands (including Healthy Lakes best practices) that will protect a lake's water quality or its natural ecosystem (these grants are limited to $100,000). Special wetland incentive grants of up to $10,000 are eligible for 100 percent state funding if the project is identified in the sponsor's comprehensive land use plan. Development of local regulations or ordinances to protect lakes and the education activities necessary for them to be implemented (these grants are limited to $50,000) Lake management plan implementation projects recommended in a plan and approved by WDNR. These projects may include watershed management BMPs, in-lake restoration activities, diagnostic feasibility studies, or any other projects that will protect or improve lakes. Sponsors must submit a copy of their lake management plan and the recommendation(s) it wants to fund for WDNR approval at least two months in advance of the February 1 deadline. Plans must have been officially adopted by the sponsor and made available for public comment prior to submittal. The WDNR will review the plan and advise the sponsor on the project's eligibility and development of a lake protection grant application for its implementation. Grant application materials are available on the WDNR web site at: RIVER GRANT PROGRAM OVERVIEW The WDNR provides grants to eligible parties for river protection grants. Chapter 195, Wis. Adm. Code, provides the framework and guidance for the River Protection Grant Program. This program provides assistance for planning and management to local organizations that are interested in helping to manage and protect rivers, particularly where resources and organizational capabilities may be limited. River Planning Grants up to $10,000 are available for: Page 93
105 Developing the capacity of river management organizations, Collecting information on riverine ecosystems, River system assessment and planning, Increasing local understanding of the causes of river problems River Management Grants up to $50,000 are available for: Land/easement acquisition, Development of local regulations or ordinances that will protect or improve the water quality of a river or its natural ecosystem, Installation of practices to control nonpoint sources of pollution, River restoration projects including dam removal, restoration of in-stream or shoreland habitat, An activity that is approved by the WDNR and that is needed to implement a recommendation made because of a river plan to protect or improve the water quality of a river or its natural ecosystem, Education, planning and design activities necessary for the implementation of a management project. The state share of both grants is 75% of the total project costs, not to exceed the maximum grant amount. Grant application materials are available on the WDNR web site at: LAKE & RIVER PLANNING & PROTECTION GRANTS IN THE TMDL PROJECT AREA Since 2005, over $2.0 million in lake and river planning projects and nearly $3.0 million in lake protection grants have funded over $7.8 million in lake and river planning and projects in the TMDL project area. A complete list of Lake and River Planning and Protection grant projects funded and undertaken in the basin since 2005 are listed in Tables G-3 and G4, Lake and River Planning and Protection Grants Projects in WI River TMDL project area DATCP Soil and Water Resource Management Program DATCP oversees and supports county conservation programs that implement the state performance standards and prohibitions and conservation practices. DATCP s Soil and Water Resource Management (SWRM) Program requires counties to develop Land and Water Resource Management (LWRM) Plans to identify conservation needs. Each county Land and Water Conservation Department in the TMDL area developed an approved plan for addressing soil and water conservation concerns in its respective county. County LWRM plans advance land and water conservation and prevent NPS pollution by: Inventorying water quality and soil erosion conditions in the county. Identifying relevant state and local regulations, and any inconsistencies between them. Setting water quality goals in consultation with the WDNR. Identifying key water quality and soil erosion problems, and practices to address those problems. Identifying priority farm areas using a range of criteria (e.g., impaired waters, manure management, high nutrient applications). Identifying strategies to promote voluntary compliance with statewide performance standards and prohibitions, including information, cost-sharing, and technical assistance. Page 94
106 Identifying enforcement procedures, including notice and appeal procedures. Including a multi-year work plan to achieve soil and water conservation objectives. Counties must receive DATCP s approval of their plans to receive state cost-sharing grants for BMP installation and these plans must be updated at least every 10 years. The schedule for County LWRM plan updates for counties within the TMDL area is provided in Table 17. DATCP is also responsible for providing local assistance grant funding for county conservation staff implementing NPS control programs included in the LWRM plans. This includes local staff support for DATCP and WDNR programs. In CY 2016 alone, DATCP awarded $1,118,912 in grants to counties in the TMDL area for local assistance and BMP implementation. T a b l e 17. C o u n t y L a n d a n d W a t e r P l a n u p d a t e s c h e d u l e County Next LWRM Plan Update County Next LWRM Plan Update County Next LWRM Plan Update County Next LWRM Plan Update Adams 2025 Juneau 2018 Portage 2019 Vernon 2019 Clark 2019 Langlade 2019 Price 2019 Vilas 2025 Columbia 2020 Lincoln 2026 Richland 2022 Waushara 2019 Dane 2018 Marathon 2020 Sauk 2028 Wood 2019 Forest 2016 Monroe 2018 Shawano 2026 Jackson 2017 Oneida 2019 Taylor 2018 The Wisconsin River TMDL provides County Land and Water Conservation Departments with the data necessary to more effectively identify and prioritize pollutant sources so that strategies can be developed and applied to reduce pollutant loads in the TMDL area over time DATCP Producer Led Watershed Protection Grant Program To improve the quality of Wisconsin s waterways, DATCP developed and launched the first Producer Led Watershed Protection Grants Program in The new grant program included in the Wisconsin state budget, was designed to give financial support to farmers willing to lead conservation efforts in their own watersheds. In the first-round of 2016 grants, $242,550 was awarded to 14 groups of innovative farmers to work with resource conservation agencies and organizations to address soil and water issues tailored to their local conditions. Included in this first round of awards was a $20,000 award to the Farmers of Mill Creek for Water quality improvement and public outreach in Mill Creek. Specifically, through this project, the Farmers of Mill Creek Watershed Council will work with Portage County UW-Extension to perform cover crop research regarding effects on soil moisture and temperature, as well as research on agricultural drains to improve water management. The group will also offer incentives for planting cover crops and focus on outreach to farmers through educational field days. Mill Creek is the fourth highest TP loading tributary watershed upstream of Petenwell Reservoir. Page 95
107 Federal Programs Numerous federal programs are also being implemented in the TMDL area and are expected to be an important source of funds for future projects designed to control phosphorus and sediment loadings in the Wisconsin River TMDL Basin. A few of the federal programs include: Environmental Quality Incentive Program (EQIP). EQIP is a federal cost-share program administered by the Natural Resources Conservation Service (NRCS) that provides farmers with technical and financial assistance. Farmers receive flat rate payments for installing and implementing runoff management practices. Projects include terraces, waterways, diversions, and contour strips to manage agricultural waste, promote stream buffers, and control erosion on agricultural lands. Conservation Reserve Program (CRP). CRP is a voluntary program available to agricultural producers to help them safeguard environmentally sensitive land. Producers enrolled in CRP plant long-term, resource conserving covers to improve the quality of water, control soil erosion, and enhance wildlife habitat. In return, the Farm Service Agency (FSA) provides participants with rental payments and cost-share assistance. Conservation Reserve Enhancement Program (CREP). CREP provides annual rental payments up to 15 years for taking cropland adjacent to surface water and sinkholes out of production. A strip of land adjacent to the stream must be planted and maintained in vegetative cover consisting of certain mixtures of tree, shrub, forbs, and/or grass species. Cost-sharing incentives and technical assistance are provided for planting and maintenance of the vegetative strips. Landowners also receive an upfront, lump sum payment for enrolling in the program, with the amount of payment dependent on whether they enroll in the program for 15 years or permanently. Regional Conservation Partnership Program (RCPP) promotes coordination between NRCS and its partners to deliver conservation assistance to producers and landowners. NRCS provides assistance to producers through partnership agreements and through program contracts or easement agreements RCPP combines the authorities of four former conservation programs the Agricultural Water Enhancement Program, the Chesapeake Bay Watershed Program, the Cooperative Conservation Partnership Initiative and the Great Lakes Basin Program. Assistance is delivered in accordance with the rules of EQIP, CSP, ACEP and HFRP; and in certain areas the Watershed Operations and Flood Prevention Program FEDERAL GRANTS IN THE WI RIVER TMDL PROJECT AREA In early 2015, Sauk and Juneau Counties which comprise the majority of the Baraboo River Watershed, one of the highest TP loading tributary watersheds in the project area, received an RCPP grant focused on improving water quality within the Baraboo River Watershed through the promotion and installation of soil and water conservation practices. The primary resource concern addressed through the Baraboo River Watershed RCPP is Water Quality Degradation, specifically high phosphorus and sediment levels being contributed to surface waters within the watershed. After receiving this grant, Sauk Co. used the EVAAL model to prioritize the farms most vulnerable to erosion for BMP implementation Water Quality Trading & Adaptive Management Water Quality Trading (WQT) and Adaptive Management (AM) may be used by eligible municipal and industrial wastewater dischargers to demonstrate compliance with TMDL WLAs. Both compliance options provide a unique watershed-based opportunity to reduce pollutant loading to streams, rivers, and lakes through point and nonpoint source collaboration. AM and WQT may also provide a new source of funding for local assistance and implementation of management measures to address nonpoint source pollution and improve water quality. The WDNR web site provides more details about water quality trading at: and adaptive management at: Page 96
108 Wasteload allocations have also been broken down into the amount needed for the reach to meet local water quality requirements and the amount needed to meet downstream water quality criteria for Lakes Petenwell, Castle Rock, and Wisconsin Phosphorus Multi Discharger Variance (MDV) The statewide multi-discharger variance (MDV) for phosphorus (s , Wis. Stat.) extends the timeline for wastewater dischargers that must comply with low-level phosphorus limits. In exchange, point sources commit to step-wise reductions of phosphorus in their effluent as well as helping to address nonpoint sources of phosphorus from farm fields, cities or natural areas to implement projects designed to improve water quality. Wisconsin's phosphorus MDV was approved by EPA on February 6, MDV implementation guidance ( is available to provide details about MDV eligibility and programmatic requirements. If a facility meets the eligibility requirements and requests and gets approval for the MDV, the WPDES permit will be modified or reissued with the following requirements: 1. Reductions of effluent phosphorus: Point sources are required to reduce their phosphorus load each permit term of MDV coverage. 2. Implement a watershed project: Point sources must implement one of the following watershed project options to help reduce nonpoint source of phosphorus pollution: a. Implement a watershed project directly; b. Work with a third party to implement a watershed project; or c. Make payments to a county (or counties) to be used for nonpoint source pollution control activities Healthy Soil, Healthy Water Partnership WDNR staff had a behind the scenes role in establishing a partnership between water quality advocates and producers in the Wisconsin River Basin. The approach used was to identify and develop relationships with individuals in the agricultural community representative of the various types of agriculture in the basin, who are also well connected and respected among their peers; in many cases these were individuals with leadership roles in their respective agricultural organizations. Among these individuals were further identified likely innovators and/or early adopters of conservation practices. Through relationships with these individuals, areas of overlap between producer interests and water quality goals were investigated. Understanding these areas of overlap helped to find common ground and develop a strategy for promoting phosphorus reductions from agricultural operations that focused on healthy soil which includes cover crops and no-till practices. The first effort towards this end was a Healthy Soil, Healthy Water workshop for producers in the basin to learn and share stories about no-till and cover crop practices. The workshop featured a nationally known soil health expert as well as local producers who have already implemented no-till and cover crops practices, who shared their experiences about what works and what doesn t in their specific location. Over 65 producers participated in the workshop. A unique feature of this approach was that participation in the workshop was achieved by extending a personal invitation to producers in the region from someone each producer already knew. Once the group agreed on a set of shared goals and commitments, it worked to highlight practices and share information with peers through informal conversations and more formal events such as farm tours, workshops, etc. The Healthy Soil, Healthy Water partnership s next step is to invite agronomists and the producers they work with to participate in a workshop as a group, so producers and agronomists that work with similar operation types and in similar physical settings can learn together about the local and operation-specific information Page 97
109 they need to implement no till and cover crops, and provide each other with post-workshop peer support and reinforcement. Post-Implementation Monitoring A post-implementation monitoring effort will determine the effectiveness of the implementation activities associated with the TMDL. WDNR will monitor the tributaries of the Wisconsin River Basin based on the rate of management practices installed and tracked through the implementation of the TMDL, including sites where WDNR, DATCP, and NRCS grants are aimed at mitigating phosphorus and sediment loading. Monitoring will occur as staff and fiscal resources allow until it is deemed that stream quality has responded to the point where it is meeting its codified designated uses and applicable water quality standards. In addition, the streams of the TMDL area may be monitored on a rotational basis as part of WDNR s statewide water quality monitoring strategy to assess current conditions and trends in overall stream quality. That monitoring consists of collecting data to support a myriad of metrics contained in WDNR s baseline protocol for wadeable streams, such as the IBI, the HBI, a habitat assessment tool, and several water quality parameters determined on a site by site basis. WDNR will work in partnership with local citizen monitoring groups to support monitoring efforts which often provide a wealth of data to supplement WDNR data. All other quality-assured available data in the basin will be considered when looking at the effectiveness of the implementation activities associated with the TMDL. Statewide Tracking Database Tracking the implementation of nonpoint source (NPS) pollution reduction practices on the landscape is an important but often challenging component of TMDL implementation tracking and assessment. These challenges become even greater in the context of point source permit programs that require NPS partnerships such as adaptive management, water quality trading and the multi-discharger variance. A database system for efficiently and effectively tracking implementation of nonpoint source pollution implementation practices is currently under development by the WDNR. The system will include a web-based portal, allowing externals to easily and efficiently submit information via a GIS-based application for submitting, visualizing and tracking spatial data. Implementation of Current TMDL Allocations and SSC Based Allocations As discussed throughout the report, two sets of allocations are included in this TMDL. The allocations in Appendix J are based on the current promulgated water quality criteria and the allocations in Appendix K are based on the proposed SSC for Lakes Petenwell, Castle Rock, and Wisconsin. Implementation of the allocations contained in Appendix K can only occur after the SSC have been adopted by rule per s. NR (7), Wis. Adm. Code, and approved by USEPA. It is crucial to note that the SSC allocations contained in Appendix K only apply to the proposed SSC presented in Table 5 in Section 1.5. If SCC values other than those proposed in Table 5, Section 1.5, are adopted by rule and approved by USEPA, then the allocations in Appendix K cannot be used and a new set of allocations will need to be calculated and documented in a revised version of the TMDL. This revised TMDL would need to go through the public approval process outlined in ch. NR , Wis. Adm. Code, and be re-submitted for USEPA for review and approval. The SSC allocations presented in Appendix K must be approved under two separate actions: 1) state and USEPA approval of the TMDL, and 2) state promulgation and USEPA approval of the SSC listed in Table 5 in Section 1.5. After all of this has occurred, WDNR will notify USEPA and stakeholders that adoption of the SSC has occurred and submit the necessary documentation to USEPA to confirm that the SSC-based wasteload Page 98
110 allocations will be implemented in future WPDES permits. From that point forward, SSC WLAs would be implemented in WPDES permits via permit modification or reissuance. Implementation of the load allocations contained in Appendix J and K are both implemented through ch. NR 151, Wis. Adm. Code. Implementation of the load allocations contained in Appendix J and K that exceed the current performance standards in subchs. III and IV of ch. NR 151, Wis. Adm. Code, is voluntary unless adopted through ch. NR , Wis. Adm. Code. The Wisconsin River Basin TMDL expresses wasteload allocations for TP as maximum annual loads (pounds per year) and maximum daily loads (pounds per day), which equal the maximum annual loads divided by the number of days in the year. As described in the TMDL Implementation Guidance for Wastewater Permits (available on-line at total phosphorus WQBELs for wastewater discharges covered by the WRB TMDL should be derived in a similar manner as methods used for Lower Fox River TMDL discharges. That is, consistent with the impracticability demonstration, TP limits should be expressed as a monthly average when wasteload allocations equate to a TP effluent concentration greater than 0.3 mg/l, and as a six-month average and monthly average equal to 3 times the six-month average when WLAs equate to a TP effluent concentration equal to or less than 0.3 mg/l. The Wisconsin River TMDL establishes TP wasteload allocations to reduce the loading in the entire watershed including WLAs to meet water quality standards for tributaries to the Wisconsin River. Therefore, WLA-based WQBELs are protective of immediate receiving waters and limit calculators will not need to include TP WQBELs derived according to s. NR , Wis. Adm. Code. Since wasteload allocations are expressed as annual loads (lbs/yr), permits with TMDL-derived monthly average permit limits should require the permittee to calculate and report rolling 12-month sums of total monthly loads for TP. Rolling 12-month sums can be compared directly to the annual wasteload allocation. The above guidance for expressing TMDL wasteload allocations as permit limits is based on USEPA s statistical method for deriving water quality-based effluent limits as presented in 5.4 and 5.5 of the Technical Support Document for Water Quality-based Toxics Control (EPA/505/ ; Page 99
111 8 PUBLIC PARTICIPATION USEPA expects full and meaningful public participation in the TMDL development process, and TMDL regulations require that each State/Tribe must provide opportunities for public review consistent with its own continuing planning process (40 CFR 130.7(c)(1)(ii)). EPA is required to publish a notice seeking public comment when it establishes a TMDL (40 CFR 130.7(d)(2)). WDNR believes that public outreach and meaningful stakeholder engagement throughout the TMDL development, TMDL implementation planning, and TMDL implementation process results in better outcomes and overall TMDL success. With this in mind, the WDNR has provided many ways for stakeholders to learn about the Wisconsin River TMDL and provide input in the TMDL development process, as described in the following subsections. Wisconsin River Symposium For five years spanning 2011 to 2015, the WDNR in collaboration with UW-Stevens Point Center for Watershed Science and other partners, organized and hosted an annual Wisconsin River symposium, a full day event centrally located within the basin at the University of Wisconsin-Stevens Point. Each symposium provided updates on Wisconsin TMDL development, including monitoring and modeling. The annual symposium also provided a venue for stakeholders to learn about issues, events and opportunities for involvement in the TMDL project area, as well as a forum for discussion about issues among stakeholders. The WDNR provided the majority of funding for each symposium, as well as substantial staff time towards planning and presenting at the event. Each year, the symposium was announced via , and via postcards mailed directly to known stakeholders including municipal wastewater and industrial facilities, county land and water conservation department staff, state agency staff, tribal representatives, engineering consultants, business owners, citizen watershed groups and individual citizens. Symposium information, including registration, was posted online, and shared through phone calls and word of mouth. Approximately 150 people attended the symposium each year. Agendas and presentations from each year s symposium can be found online at: Invited Presentations at Stakeholder Sponsored Meeting Wisconsin River TMDL Project team members are frequently invited to make public presentations about the TMDL at the regular meetings of various organizations. Between 2012 and 2016, Wisconsin River TMDL project team members provided presentations at meetings of the following organizations: Petenwell and Castle Rock Stewards, Lake Wausau Associations, Lake Wisconsin Citizens Group, Big Eau Pleine Citizen Organization Conference, National Conference for Air and Stream Improvement (NCASI), Wisconsin River Discharger Group (WRDG), Wisconsin Paper Council, Wisconsin Government Affairs Seminar, American Society of Civil Engineers, Wisconsin Lakes Convention, Wisconsin River Industrial Discharger Group (WRIDA), Famers of Mill Creek Watershed Council, Wood County CEED Committee, North Central Wisconsin Stormwater Coalition, North Central Wisconsin Regional Planning Commission, Wisconsin Potato and Vegetable Growers (WPVGA) Annual Conference. In addition, TMDL project team members have had faceto-face meetings/discussion about the TMDL with most of the groups previously listed in this paragraph, as well as the following additional groups: Professional Dairy Producers of Wisconsin, Wisconsin Farm Bureau Federation; Wisconsin Farmers Union; Dairy Business Association (DBA); Wisconsin Agricultural Center for Excellence; Dairy Grazing Apprenticeship; Women Food and Agriculture Network; Coloma Farms/DATCP Board President; and Land Conservation, CPZ and/or NRCS staff in all the following Counties: Adams, Columbia, Juneau, Lincoln, Marathon, Portage, Sauk, and Wood. Page 100
112 Technical Meetings & Webinars Total Maximum Daily Loads for Total Phosphorus in the Wisconsin River Basin At various points during TMDL development WDNR provided opportunities for technical stakeholders to come together, virtually or in person, to discuss and ask questions about TMDL data, modeling approaches, and various technical issues. In November 2013, the TMDL Development Team organized and hosted two full-day meetings (11/6 and 11/13) with technical stakeholders to present, discuss, and accept feedback on the technical details of the proposed TMDL modeling scope and approach. A detailed technical scope of work was made available externally for review one month prior to these meetings (10/4). During the meetings, WDNR modeling staff and technical partners made detailed presentations about each component of the technical modeling scope, as well as monitoring results. Sixty-seven (67) technical stakeholders attended and participated in the meetings. The aforementioned technical scope, technical presentations, and meeting agendas are available online at and Additional webinars presented by the Wisconsin River TMDL team, include the list below: On April 20, 2016 WDNR hosted a technical presentation by EPA contractor LimnoTech Inc. on the development and results of CE-QUAL-W2 model of Castle Rock and Petenwell Reservoirs. On September 7, 2016 WDNR in partnership with UW-Extension hosted and presented a technical TMDL webinar on the topic of model integration and allocation methodology. Nearly seventy (70) individuals watched the webinar live and many more watched the recording, which is available online On November 17, 2016 WDNR hosted and presented a technical TMDL webinar on reservoir modeling updates. Thirty (30) individuals watched the webinar live and many more later watched the recording, which is available online Draft TMDL Model Review In addition to the previously mentioned technical meetings and webinars, WDNR staff in collaboration with TMDL technical stakeholders, developed a process for external review of draft TMDL models by interested technical stakeholders, throughout the TMDL development process. This process provided external stakeholders with the ability to access draft models and basic accompanying documentation at set points during the TMDL process. Each time draft models were shared, a formal opportunity to ask questions about the model was provided, via conference call or Skype meeting. WDNR then responded in writing to all comments and questions received within 21 days each time models were made available. The availability of draft models for review was announced via the Wisconsin River TMDL GovDelivery subscription list; GovDelivery announcements contained a link that allowed recipients to download draft models. Table 18 summarizes the dates and information shared as part of this process. Page 101
113 T a b l e 18. D r a f t T M D L p r o d u c t s a c c e s s i b l e f o r e x t e r n a l r e v i e w d u r i n g d e v e l o p m e n t Draft Product SWAT Model Subbasins Topographic Slope Wetlands/ Internally Drained Areas Product Type Date Accessible for Review Recipients No. of Unique Opens Date of WDNR Response to Comments Climate Groundwater Baseflow phosphorus Land Cover/Management Urban model reach-shed delineation SWAT Model Development Wastewater Facility Summary Scripts used to develop SWAT model input layers Wastewater Baseline Urban Model Lake Wisconsin Bathtub Lake DuBay Bathtub Calibrated SWAT Model Model Analysis & Preparation of CE-QUAL-W2 modeling of Caste Rock and Petenwell Reservoirs Spatial Data Report Excel Table Data Proc. Scripts Excel Table Draft Model Draft Model Draft Model Draft Model Technical Memo 01/16/ /25/ /13/ /23/ /02/ /13//2015 CE-QUAL-W2 lake response models of Petenwell and Castle Rock Reservoirs Lake DuBay Bathtub Model Draft Model Draft Model 04/21/ Calibrated SWAT Model Summary Results Model Results 05/04/ Other Stakeholder Meetings & Webinars WDNR together with UW-Extension also organized and hosted meetings and presented webinars for general stakeholder audiences. In January 2015, WDNR, together with UW-Extension hosted a workshop to discuss the important role of agricultural stakeholders and partnerships in efforts to improve water quality in the Wisconsin River basin. Fifty-two (52) stakeholders attended and participated in the meeting. On September 11, 2013 WDNR in partnership with UW-Extension hosted and presented a Wisconsin River TMDL overview Page 102
114 webinar. In July 2013 WDNR produced and posted online a webinar covering the land use and land management inventory and model input layers development used to develop the TMDL SWAT model. Both of these webinars are available online on at the web address included in the previous section. Wisconsin River TMDL GovDelivery Subscription List On August 27, 2014 WDNR launched a Wisconsin River TMDL GovDelivery subscription list (Table 19). The Wisconsin River GovDelivery list is used to communicate project updates, announce opportunities for technical review and input, events, and distribute the project newsletter. At its inception, the GovDelivery list invitation was sent to 288 individuals on existing Wisconsin River TMDL lists. A link was added to the Wisconsin River TMDL website that allowed anyone to subscribe or unsubscribe at any time. By February of the following year (2015), the number of subscribers had more than doubled, reaching 622. By the end of 2015 the number of subscribers had exceeded 1,000. As of this writing, there are over 1,900 subscribers. The increase in the number of receipts through GovDelivery reflects the growing interest in the project as it progressed. T a b l e 19. W i s c o n s i n R i v e r T M D L G o v D e l i v e r y l i s t b u l l e t i n s Bulletin Subject Sent Date No. Recipients Welcome to Wisconsin River TMDL Subscription Service 08/27/ Wisconsin River TMDL Quarterly Newsletter 11/13/ Opportunities for Wisconsin River TMDL Technical Stakeholder Input 12/17/ Schedule for Upcoming Release of Draft TMDL Models 01/08/ Save the Date WI River Symposium is March 19! 01/09/ Wisconsin River TMDL Draft Models Now Accessible 01/16/ Register for WI River Symposium & Submit Draft Model Comments 02/03/ Wisconsin River Basin Quarterly Newsletter, Issue 2 02/09/ Response to Comments on Draft WR TMDL Models 02/25/ WI River TMDL Quarterly Newsletter - May /11/ Schedule for Upcoming Release of Draft TMDL Model Data 08/05/ Update on Upcoming Release of Draft TMDL Model Data 08/11/ Wisconsin River TMDL Draft Data/Models Now Accessible 08/13/ WI River TMDL Quarterly Newsletter - August /19/ WR TMDL "E-chat" - RSVP due TODAY 08/24/ Response to Comments on Wisconsin River TMDL Draft Data/Models 09/23/ Upcoming Release of Draft WR TMDL Models 09/29/ Wisconsin River TMDL Draft Models Now Accessible 10/02/ WR TMDL "E-chat" - RSVP due TODAY 10/12/ WI River TMDL Quarterly Newsletter, Nov /19/2015 Response to Comments on Draft Calibrated WR TMDL SWAT Model 11/13/2015 April 20 Presentation of Castle Rock & Petenwell Response Models 04/01/ Draft WI River TMDL Models Now Available 04/21/ WI River TMDL draft SWAT Model Summary Results 05/02/ Response to Comments on Draft Calibrated Reservoir Models 06/01/ Register Now for WI River TMDL Model Integration & Allocation Methods Webinar 08/30/ Upcoming WI River TMDL Webinar Clarifications 09/01/ WI River TMDL Model Update Nov 17 Webinar 10/27/ Press Release and GOV Delivery Notification of Webinar on draft TMDL Report and Allocations 02/07/2018 1,979 Webinar on Draft TMDL Report and Allocations 02/21/2018 Page 103
115 Draft TMDL Allocations and Draft TMDL Review The WDNR conducted a webinar on February 2, 2018 to provide the public with an overview of the TMDL analysis and explain how to access the report and allocations. The webinar was also recorded and made available on the WDNR website, (search Wisconsin River Basin TMDL) The webinar kicked off a series of informational meetings to provide an even more detailed explanation of the TMDL analysis, allocations and any needed reductions, implementation and compliance options, and to provide opportunities for additional stakeholder input. Presentation material was the same at all locations and times. Total attendance for the five meetings was 111. March 5, 2018, 1-4 p.m., at the Quality Inn located in Rhinelander March 6, 2018, 10 a.m.-noon and 4-6 p.m., at the Portage County Courthouse Annex Building March 14, 2018, 10 a.m.-noon and 4-6 p.m., at the Portage Public Library The copy of the presentation slides can be found on the WDNR website, Stakeholder input from these listening sessions as well as written comments received during the February 21 through April 23, 2018 comment period were incorporated into the final draft of the TMDL plan. The WDNR received 63 comments. A summary of the comments and responses can be found in Appendix P. Public Informational Hearing Per s. NR Wis. Admin. Code, a public informational hearing and minimum 30-day comment period were conducted. The public hearing occurred on August 22, 2018 and was accompanied by the official 30- day comment period. Comments were accepted from August 20 to close of business on September 19, The notice was sent out as an official WDNR press release hitting all news outlets, distributed through the Wisconsin River Basin TMDL Govdelivery distribution list, distributed through the WDNR permit distribution list, and posted on the WDNR website and public hearings calendar. A copy of the official public notice is included below. The public hearing was attended by 36 stakeholders. Four verbal comments were submitted into the record and are summarized below. Written comments received during the comment period are included in Appendix Q. These comments are grouped by category with written responses in Appendix R. The most significant changes that occurred as the result of public informational hearing involved a re-examination of the values provided in Appendix N and a subsequent re-calculation of the values to address bias and correct programming errors. Additional explanation is included in Appendix N. During the public informational hearing, four stakeholders provided verbal comments. Three of the verbal comments were accompanied by written submittals and are summarized in Appendix R. Below is a summary of the verbal comments: Mr. Rich Boden representing the Village of Plover and the Wisconsin River Discharger Group: As summarized in the written comments; Mr. Boden expressed concern over the lack of implementation tools available for nonpoint sources. The implementation tools and funding available for nonpoint sources is inadequate to meet water quality standards. Mr. Boden also expressed concern over the lack of a phased implementation for point sources; again, the point sources have short compliance periods while nonpoint has no regulatory driver. Note: See written comments 4, 5, 25, 34, 35, 36, 37, 42, 43, 44, 45, 46, and 52 in Appendix R. Page 104
116 Mr. Andy Kurtz representing the Village of Marathon City: As summarized in written comments, Mr. Kurtz expressed concern over the lack of cost sharing and funding support for nonpoint sources. For the Big Rib River, point sources represent less than 1% of the load while nonpoint sources represent over 99% of the load. While the MDV helps provide nonpoint funding; it is still lacking and there is not sufficient flexibility in the point source implementation and variance programs. The barriers in water quality trading, including high trade ratios, the credit threshold, serve as an impediment to generating phosphorus credits. Interim credits are only available and do not provide sufficient relief for point sources. Note: See written comments 3 and 54 in Appendix R. Mr. Mark Saemish representing the City of Elroy Wastewater: Believes that the TMDL is putting the cart before the horse and that the TMDL is not good enough because we have been under the gun to get it done. Specifically, we should be looking at this like Dane County s dredging of sediment to address legacy phosphorus. Most of the phosphorus is legacy phosphorus and reductions to point sources will not improve water quality unless the legacy phosphorus is addressed. This is a nonpoint issue and not a point source issue. Over 1,300 facilities have applied for economic variances because of the stringent phosphorus limits imposed on point sources. The phosphorus rules and criteria were imposed by EPA; what happened to state sovereignty? Stand-up to EPA. Ms. Falon French representing River Alliance of Wisconsin: Voiced support for the TMDL; however, voiced concerns about nonpoint implementation and the lack of funding and support to implement nonpoint reductions. Ms. Falon encouraged the DNR to think creatively in utilizing and adapting phosphorus compliance tools to make compliance with wastewater permit limits easier. Voiced support for the SSC process. Note: See written comments 2, 22, 23, and 33 in Appendix R. Page 105

117 Page 106