Transforming sanitation
|
|
|
- Allan Todd
- 5 years ago
- Views:
Transcription

1 Transforming sanitation Commercialization partnership opportunities December 2017
2 Contents Opportunity summary Unmet need and macro trends Reinvented Toilet value proposition Reinvented Toilet market opportunity Time is now: How to get started 1
3 Opportunity summary 2


4 Why focus on the Reinvented Toilet? Meaningful and accessible business opportunity Tremendous potential to alleviate human suffering Opportunity to reinvigorate purpose, attract new customers and motivate employees 3
5 Reinvented Toilet represents a potential $6B+ global annual revenue opportunity $0.8B $1.0B $2.0B Technology currently in pilots and ready for commercialization Ecosystem of partners and enablers exist to plug into $0.4B $0.5B $1.1B $0.3B Extensive market intelligence conducted to inform business model 2030 projections STeP and Foundation continue to advocate and market shape to enable opportunity Source: BCG analysis 4
6 RT 2030 potential market size is meaningful compared to other global health products and consumer durables Global Retail Value in 2016 ($) 1 $40B Global Market Size by Product $36.6B $30B $27.8B $13.5B $10B $5.0B $6.1B $7.6B $8.5B $9.1B $10.9B $0.2B $1.3B $1.6B Electric Steamers Smart Toilets Electric Toothbrushes Fridges 1 RT potential market (2030) Pneumococcal vaccine Ovens Pediatric & Maternal vaccines Microwaves Dishwashers Vaccines (total) Automatic Washing Machines 1. Note Euromonitor definition of category is for domestic cooling appliances that do not include freezers, but can come with a small ice box. Category of "fridge freezers" is 2 or 3 door appliances with separate units for refrigeration and freezing and is valued at $68.7B in Note: All values USD, using 2016 fixed exchange rates. Sources: Euromonitor Passport Database (2016), Technavio Global Smart Bathroom Market report (2016), EvaluatePharma, BCG analysis 5

7 Improving sanitation has tremendous potential to alleviate human suffering 2.5B People globally lack access to basic sanitation 80% Of illnesses in developing countries linked to poor water and sanitation conditions $260B Cost globally due to lack of sanitation 6

8 Reinvented Toilet offers opportunity for societal impact, resulting in real financial returns Companies that integrate social and environmental impact as a driver of strategy, see results in value creation Reinvigorate company purpose Motivate employees; create edge to attract and retain talent Strengthen the brand and support premium pricing +11% +5.5 pp Avg. valuation premium of top vs. median social impact performers 1 Avg. gross margin premium of top vs. median social impact performers 2 1. For consumer companies 2. For consumer companies conserving water Source:Total Societal Impact BGC analysis
9 Unmet need and macro trends 8
10 Only 3% increase in access to safely managed solutions over the last 5 years 4.5B people globally lack access to safely managed sanitation 2.3B people globally still lack access to even basic sanitation services % population Safely Managed Improved and not shared - excreta safely disposed in situ or off-site 1 Basic Improved and not shared - excreta not safely disposed Limited Improved (e.g. sewer, septic, VIP latrines) and shared facilities Unimproved Use of pit latrines without a slab or platform, hanging and bucket latrines Open Defecation Disposal of human faeces in fields, or other open spaces or with solid waste 1. Transported and treated offsite Source: JMP 2017 Report Faster progress required to achieve the SDG goal of safely managed sanitation by
11 Macro trends making RT value proposition even more compelling Growing population with urbanization Aging infrastructure Water scarcity and stress Policy changes Population growth led by developing countries frequently outpacing sanitation infrastructure growth 66% of global population projected to be urban in 2050 creating need for low cost, high access sanitation solution Even in developed markets, current sewer and centralized wastewater treatment systems can be capacity strained Infrastructure repairs costly and disruptive Half of the global population could be facing water shortages by 2030 Demand could outstrip supply by 40% Government programs and initiatives focused on sanitation, esp. in developing markets "Eco-friendly" policies to support sustainable development Source: World Urbanization Prospects, 2014 Revision; United Nations World Water Development Report 2015; expert interviews 10
12 Growing population in need of sanitation solution: Many parts of developing world will continue to lack access to sewers, will need alternative solution Note: countries in gray do not have data reported Source: JMP 2017 Report; BCG analysis 2030 sewer access projections 0%-20% 21%-40% 41%-60% 61%-80% 81%-100% 11

13 Example: Pittsburgh, PA Aging infrastructure: Insufficient wastewater treatment capacity and miles of leaky pipes due to dated infrastructure Old combined sewer system poses risks During wet weather, billons of gallons of stormwater runoff and sewage flow directly into rivers Aging pipes in desperate need of repairs Constructed from early 1800's to mid-1900s Over 3,500 pipe breaks since 2014 Concerns about lead in drinking water $3B Estimated cost of needed capital improvements +50% Rate hike for customers by 2020 With EPA support, Pittsburgh launched Green First plan in 2016 to use green infrastructure (e.g. wetlands, bioswales) as part of solution Sources: PWSA Blue Ribbon Panel, Executive Summary, Nov ( Pittsburgh Post Gazette "PWSA bills to jump nearly 50 percent over three years" Nov. 2017; CBS Pittsburgh "PWSA Audit Uncovers Lack Of Leadership & Years Of Mismanagement " Nov. 2017; EPA "Helping Pittsburgh and Other Cities Expand Green Infrastructure" 12
")
14 Water stress: will further increase need for sanitation technology that does not rely on water inputs 2040 Projections Source: World Resources Institute (Aug 2015) 13
15 Policy changes: Governments across the globe have initiated campaigns to improve sanitation; some promote green infrastructure as well In USA, state & local policies encourage green practices, e.g. new San Francisco ordinance requires onsite non-potable water reuse for new buildings >250K sq ft In 2015, Nigeria launched campaign Making Nigeria OD Free by 2025, but progress is slow South Africa released updated National Sanitation Policy in 2016 reaffirming government commitment to providing access to basic sanitation services to all EU's consistent efforts to increase sewer coverage for all member states has been backed by $40B investment over 20 years with substantial success India's ambitious Swachh Bharat Mission seeks to end OD by 2019 and build >10M toilets; thus far (4 years) Government of India has allocated $1B USD China's Toilet Revolution is rapidly improving toilets in tourism sites and rural residences; China is on track to move from 48% sewer in 2015 to 80% by 2030 Source: Expert interviews; desktop research; BCG analysis 14

16 Global marketplace is more ready than ever: public and private sectors are seeking alternatives Sanitation has hit world stage Governments actively investing Sanitation should not be seen as a political tool, but should only be connected to patriotism and commitment to public health. Narendra Modi, PM of India We'll team up with ministers of education to put sanitation facilities in every school. Jim Yong Kim, President of World Bank This [sanitation] work must be a concrete part of advancing our country's revitalization strategy, and we must make great efforts to fill these shortcomings that affect the quality of life of the masses. Xi Jinping, President of China 15
17 Reinvented Toilet value proposition 16


18 Current sanitation solutions have significant limitations that jeopardize health, safety and in many cases perpetuate open defecation practices Hanging toilets Pit latrines Septic tanks Sewerage User Foul odors Poor user experience Frequent maintenance Difficult to retrofit Expensive to install, maintain Municipality Safety hazards Environmental contamination Risk of leakage Poor waste disposal Requires infrastructure Requires water Treatment not assured 17

19 Poor Fecal Sludge Management (FSM) is akin to institutional open defecation Sludge direct to the environment when no service chain 20% WC to sewer Safely emptied Leakage Illegally dumped Effectively treated Not effectively treated 2% 2% of fecal sludge safely disposed 79% On-site facility Unsafely emptied Left to overflow or abandoned of fecal sludge 98% unsafely disposed 1% Open defecation Source: WSP analysis, using BMGF funded research 1% 69% Residential environment 9% 9% 1% 9% Drainage systems Receiving waters 18
20 Reinvented toilet collapses FSM value chain into a single unit providing containment and treatment Sewerage Water closet Sewer network pumping stations Treatment plant Fecal Sludge Management for on-site systems Latrine or septic tank Primary emptying Vacuum truck Transfer Treatment plant Reinvented Toilet 19


21 Eliminate pathogens Eliminate safety concerns via handling Reduce disease burden Improve environmental safety Convey low life-cycle costs Reduce need for pit emptying Ensure a sustainable business model, including maintenance via service providers The Reinvented Toilet program is designed to address each of today s limitations Operate off grid Eliminate need for external inputs such as water and energy Make portable and easy to install Present modular, attractive interface Reduce / eliminate construction costs Provide clean and dignified product Eliminate odors and waste 20


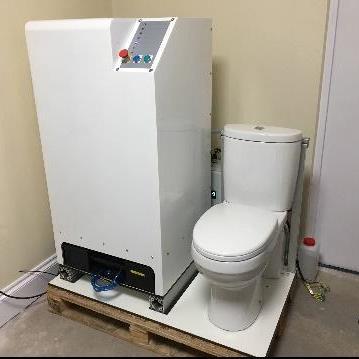
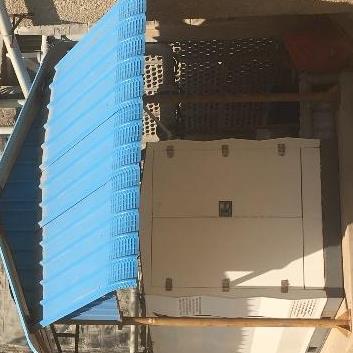
22 Two versions of Reinvented Toilet for different scales: single and multi unit Single unit (SURT) A single toilet and attached processing unit that fully treats solid waste and wastewater Capacity: ~1-2 households Example use cases: household, small commercial building Multi unit (MURT) Central processing unit that connects to multiple toilets to treat waste and recycle wastewater for flushing Capacity: Varies, up to ~500 users Example use cases: apartment building, public toilet block 21


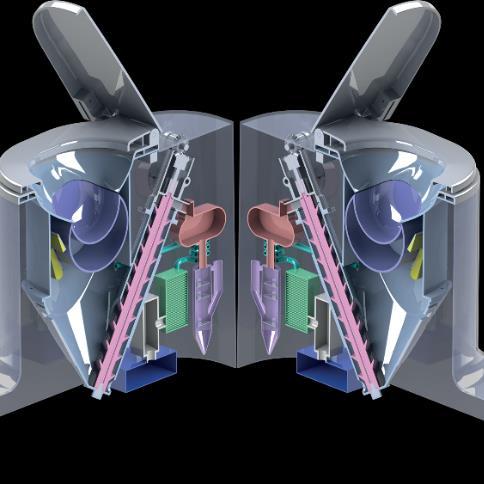

23 Our core RT processing technologies Electrochemical Wet oxidation Dry combustion Biological 22
24 BMGF is also investing in enhancing the FSM value chain with the Omni-Ingestor and Omni-Processor technologies Sewerage Water closet Sewer network pumping stations Treatment plant Fecal Sludge Management for on-site systems Latrine or septic tank Primary emptying Vacuum truck Transfer Treatment plant Omni-Ingestor Omni-Processor 23
25 Reinvented Toilet market opportunity 24
26 The 2030 global annual revenue potential for RT can vary based on different assumptions on pricing and volume Price 2030 global annual revenue potential for RT More aggressive Increasing price (4 different price points based on country income 1 ) More conservative $2.7B $2.1B $8.0B $6.1B Scenario outlined in these materials 1. As defined by World Bank Source: BCG analysis More conservative More aggressive Increasing RT uptake across segments Volume 25
27 Opportunity to triple core market by increasing RT volume based on three key market conditions 2030 annual revenue potential ($B) 3X Baseline Higher market share RT expands the market RT as sewer alternative Upside Assumes RT will capture a higher % of the addressable market (relative to traditional and eco-friendly options) Assumes introduction of RT technology will expand the number of people starting to use a toilet or changing/ replacing toilets RT can be an alternative driven by policy changes, gov'ts convinced of RT, and ecofriendly purchase driven by water scarcity, aging sewers & limited capacity systems Source: BCG analysis 26
28 Reinvented Toilet represents a potential $6.1B global annual revenue opportunity $1.0B $0.8B $2.0B $5.3B Residential construction $1.1B $0.3B $3.2B Existing (non-sewer) $0.4B $0.5B $1.5B Existing (sewer) $0.6B New $0.8B Non-Residential construction 2030 projections Source: BCG analysis $0.7B $0.1B Existing New 27
29 Potential global annual sales opportunity for RT is 2.6M SURTs and 0.5M MURTs 121k SURTs, 9k MURTs 287k SURTs, 19k MURTs 650k SURTs, 110k MURTs 400k SURTs, 10k MURTs 500k SURTs, 65k MURTs 380k SURTs, 200k MURTs 415k SURTs, 32k MURTs 2030 projections Note: k represents in 000's, Source: BCG analysis 28
30 Different market segments for RT have different buyers and goals Segment Current sanitation type New construction Unimproved Latrine Septic Sewer Residential Developer Business case and cost conscious Homeowner, NGOs, Government Accessibility, affordability and financing options critical Homeowner Seeking low cost, low maintenance solution Homeowner/ developers "Green" tech Lower water footprint Government Seeking solution to decentralized WWT 1 Public Commercial Maintenance considerations impact brand reputation and lifecycle cost analysis N/A N/A Developer/ municipality Small segment Willing to switch to safe solutions Government Seeking low cost, low maintenance solution Developers Seeking low cost, low maintenance solution Government Seeking solution to aging infrastructure and water scarcity Demo project Developers Response to policy changes "Green" tech 1. Wastewater treatment 29
31 Introduction of an RT will provide a unique platform to grow in dynamic emerging markets Real GDP growth ( CAGR, %) ~4.3B people in fast-growth markets with high RT need 12% 10% China 8% Nigeria India Indonesia 6% 4% Kenya 2% 250 M people 0% Population not covered by sewer (% of total population, 2015) Source: JMP 2017 report, World Bank Bill & Melinda Gates Foundation 30


32 Mature and emerging economies present varied shape of RT opportunity across the globe +3.2 B Emerging economies with high RT need and set for improvement NOW +1.7 B Mature economies building to an inflection +0.5B Emerging economies with high RT need but requires effort to unlock Source: BCG analysis 31
33 RT has developed and developing country revenue potential, with different economic and sanitation scenarios Mature economies building to an inflection High RT need and set for improvement now High RT need but requires effort to unlock Examples Revenue potential $ 1.7B+ $ 3.2B+ $ 0.5B+ Economic status Path to success Sanitation status Sanitation ambition and goals Ease of market entry Purchasing power United States Europe India China South Africa Kenya Nigeria Stable economic growth, high GDP per capita (US=$55K 1 ; EU= $36K 1) Position RT as future of sanitation with reduced water / septic alternative Heavily sewered with aging infrastructure; septic common in rural areas Investments in eco-friendly and sustainable solutions in Western EU and US, less common in Eastern EU Medium: established value chains, but must address regulatory constraints Medium to High: ($3500 USD per SURT); Eastern EU ($900 per SURT) Emerging with economies with steep GDP 1 growth (up to 8-10% CAGR) Ramp-up and capture the ambition of sanitation revolution and improvements India is mostly unimproved; China and RSA roughly half sewered China Toilet Revolution & India Swacch Bharat targeting rapid advances; RSA gov. continuing ongoing efforts Medium: strong government support for sanitation; maturing value chains Medium ($450-$900 USD per SURT) Low - medium GDP per capita (e.g. Kenya $3K 1, $6K 1 Nigeria) Leverage local partners to establish value chain, plus gov't & NGO support ~70% of pop. in Kenya & Nigeria lack access to at least basic sanitation Kenya aspires to sewer and Nigeria to be OD-free, but progress is slow Kenya: easier with partnership opp'ty; Nigeria: difficult business environment Low ($250-$450 USD per SURT) 1. PPP GDP: gross domestic product converted to international dollars using purchasing power parity rates Source: World Bank; JMP 2017; BCG analysis 32
34 China: Sanitation rapidly improving, but pockets of opportunity exist for RT Sewer expansion In 2015, almost half (48%) of population had sewer access On track to become 80% sewered by 2030 Early adopters If RT enters quickly, could tap into: Toilet Revolution at tourism sites Rural non-residential buildings as early adopters Mainstream Opportunity for RT to become as option for rural residents, with government backing Urban green buildings may adopt RT as water scarcity increases $1.16B 2030 RT revenue potential 86K SURT 438K MURT Need to move quickly before sanitation investments complete; rapid market entry in China is supported by existing partner and infrastructure ecosystem, even in rural areas Critical to engage with Government, at all levels; Beijing meeting in 2018 is key opportunity to raise awareness for RT In 2030: Population: 1.3B % sewer: 80% % septic: 18% % latrines: 2% Source: JMP WASH data, BCG analysis, see country deep dive for more information 33
35 India: Modi pushing for sanitation improvement; new solutions needed to fully realize goals Huge need and opportunity Total population 1.3B, with 4 mega cities India has one third of world's population living on <$2/day Only 10% have sewer access and 40% practice OD (~500M) Heavy investment via Swachh Bharat In 2014, Prime Minister Modi set goal to end OD by 2019 and build >10M toilets Galvanized countrywide focus on sanitation, including private sector support However, gaps remain Toilets are being erected quickly but funds do not cover full solution (e.g. FSM) Only 7% of waste water generated in India's cities is disposed of safely Decentralized solutions that include FSM can add significant value Need to move quickly because landscape in India changing now Source: JMP WASH data, BCG analysis, see country deep dive for more information $620M 2030 RT revenue potential 211K SURT 117K MURT In 2030: Population: 1.5B % sewer: 14% % septic: 34% % latrine: 19% % unimproved/shared: 33% 34
36 United States: Opportunity to enter in specialty markets, and fit into shifting wastewater policies Specialty markets Likely early adopters Green buildings Non-traditional homes (e.g. RV, boats, homes without flush toilet) Parks & remote sites Portable toilets Water costs are only going up... we'd be all over this. -Leading real estate developer Mainstream Potential long-term upside Septic users (mostly rural) Sewered cities facing aging infrastructure or water scarcity It's slow, not overnight... but our nation is changing... You didn't hear decentralized much a couple years ago; now it has a role. Director of Water Resources, San Francisco Niche markets support RT entry today, while setting groundwork for long-term unlocks. Appetite for RT in mainstream exists too, but requires paradigm shift and regulatory changes to fully realize. $660M 2030 RT revenue potential 107K SURT 8K MURT In 2030: Population: 359M % with sewer: 83% % with septic: 16% Source: JMP WASH data, BCG analysis, see country deep dive for more information 35
37 Europe: Opportunity to compete with septic, especially in rural areas Different country archetypes identified EU countries vary substantially in their sanitation ecosystems (system types, customer needs, etc.) Northern, Western and Southern/Eastern archetypes with different market profiles EU has strong policy action Massive investment in sewer extension and upgrade over past 20 years Obligatory for all EU states, with significant EU funding dispersed (20bn+) Strong drive toward extensive sewerage but opportunity to compete with septic, especially in rural areas in Eastern and Southern European countries, where sewer coverage will remain low Source: JMP WASH data, BCG analysis, see country deep dives for more information Strongest opportunity in East/South Europe Significantly lower sewer coverage rates then Western/Northern EU Rural areas often primarily relying on septic systems or pit latrine (varies by member state) $1.0B 2030 RT revenue potential 287K SURT 19K MURT In 2030: Population: 512M % with sewer: 80.5% % with septic: 17% % with latrine: 2.5% 36
38 Kenya: Potential test market in Africa, given clear sanitation needs and strong NGO presence Growth and urbanization strain limited infrastructure Population expected to double from 2000 to 2030 (31M to 66M) Only 30% of population has basic sanitation and just 3% sewered Majority rural country (74%), but urbanizing quickly, leading to development spike in non-sewered satellite towns Several innovative sanitation actors involved in Kenya Government seeks to expand sewer, but progress has been slow Hence, non-profits and private players have stepped in to provide sanitation services (e.g. Sanergy, Sanivation, SafiSan, EcoCast) Partnerships with existing entrepreneurs may offer accelerated path to market entry in Kenya $19M 2030 RT revenue potential 3K MURT 12k SURT In 2030: Population: 65M % sewer: 2% % septic: 2% % latrine: 25% % unimproved/shared: 71% Source: JMP WASH data, BCG analysis, see country deep dive for more information 37
39 Nigeria: Strong potential for impact, but challenging business environment Huge gap in sanitation services Mega city Lagos has no centralized sewer Only one third of pop. has at least basic sanitation, and % is declining as services cannot keep up with growing population...unlikely to be met soon Nigeria aspires to be OD free by 2025 However, sanitation is duty of several ministries with poor coordination, so has historically had weak implementation Go-to-market requires persistence Lower quality local manufacturing, high cost to importing, and corruption risk make market entry challenging Nigeria offers sizable and meaningful opportunity, if willing and able to navigate unique market challenges $60M 2030 RT revenue potential 5K MURT 78K SURT In 2030: Population: 271M % sewer: 7% % septic: 23% % latrine: 8% % unimproved/shared: 62% Source: JMP WASH data, BCG analysis, see country deep dive for more information 38
40 South Africa: Unique opportunity for RT market that is likely municipality driven Gov't plays large role in sanitation Citizens feel they have been promised sanitation services (via Constitution and party promises), thus municipalities would be main buyers Pop. is 47% sewered and 76% has at least basic sanitation...but struggles to serve all segments Great challenge to provide services for large and growing informal settlements, esp. with tenure insecurity & vandalism Rural also high cost to serve via sewer Additional opportunity from water scarcity Given population and economic growth, by 2030 South Africa will demand 17% more water than exists Droughts have been especially severe in Western Cape Municipality-driven market, may offer opportunity to reach many users with consolidated pathways $56M 2030 RT revenue potential 36K SURT 3K MURT In 2030: Population: 359M % sewer: 55% % septic: 3% % latrine: 26% % unimproved/shared: 17% Source: JMP WASH data, BCG analysis, see country deep dive for more information 39
41 Time is now: How to get started 40
42 Mature economies building to an inflection High RT need and set for improvement now High RT need but requires effort to unlock Critical to introduce RT in segments where & when improvements are in process Cities actively seeking upgrade to sewer or WWTPs offer open window for lower cost decentralized approaches including green technology Countries actively pursuing sanitation program offer chance to take advantage of momentum, and financial and political support New construction presents greater opportunity across markets than existing, due to immediate need to install some sanitation system Non-sewered regions generally have greater motivation for new solution; once sewered, value proposition is more about sustainability 41


43 China and India moving quickly to improve sanitation India: Swachh Bharat Mission "A clean India would be the best tribute to Mahatma Gandhi on his 150 birth anniversary in 2019." - Narendra Modia, PM Goal End OD by 2019 Build >10M toilets Progress 1300 cities OD free 3.1M latrines installed China: Toilet Revolution "The toilet issue is no small thing... This work must be part of advancing our country s revitalization strategy." - Xi Jinping, President Goal 70% population with sewer by 2020 Progress Achieved goal of upgrading 25,000 public toilets and newly built 33,500 in tourism areas Imperative to act now to capitalize on momentum and capture value 42
44 How to get started: Leverage BMGF and STeP resources to set strategy, before launch and scale Set strategy Policy & advocacy Pilot launch Scale and expand Pick target geographies and segments, with focus first on early adopters to unlock broader market entry Wide range of buyer types for RT (e.g. gov't, developers, urban/rural homeowners); implies different distribution models and channels Leverage STeP and BMGF market intelligence and policy resources Identify and cultivate thought leaders and "RT champions" in relevant markets Begin pathway to create favorable regulatory conditions for market entry Consider "early adopter" high visibility, need, and/or credibility segments open to iterating on product Focus on small scale manufacturing and direct to sales distribution model Establish foundation for full value offering, including: Manufacturing Distribution Sales & marketing Financing After market support Potential to leverage existing capabilities and networks within broader sanitation category 43
45 Set strategy: Different early adopter paths aligned to vision across geo segmentations Mature economies building to an inflection Market vision: Become an alternative to sewer in the developed world High RT need and set for improvement now Market vision: Attain profitable mass market product distribution in a compressed time frame High RT need, but requires effort to unlock Market vision: Attain profitable mass market product distribution over a longer time horizon Early adopter strategy: Build momentum with early adopter segments such as pockets of remaining need (e.g. remote, current solutions failing) and eager innovators, to unlock mass opportunity Early adopter strategy: Directly enter mass market with one product, with focus on countries actively pursuing sanitation programs, seeking support from early champions Potential "quick win" for visibility: Emergency situations Early adopter strategy: Either leverage blue/green markets as "early adopters" or directly enter yellow markets, targeting opportunities where govt or aid org support is likely 44
46 Set strategy: Initial research suggests several priority early adopter segments to target for launch Geographic market Segment Overarching criteria Blue: Mature economies building to an inflection Military housing Green buildings (commercial & mixed) National and state parks Segments with current burning platform and clear procurement path, high visibility/potential to drive aspiration and ability to be a trendsetter and unlock both mature/developing markets Green: High RT need and set for improvement now Yellow: High RT need, but requires effort to unlock Tourism/religious sites Eager municipalities Rural hospitals Trains Rural schools Refugees Segments with high willingness to take the plunge, current burning platform and clear procurement path, high visibility/potential to drive aspiration and ability to influence broader mass market Beta test segments with clear potential for govt/ aid org support, to capture learnings for rollout 45
47 Policy and advocacy: Beyond R&D, we will continue to help expand the industry Enabling environment Collaborate with local governments to enhance demand for sanitation Support implementation of international product standards Marketplace readiness Foster a supportive regulatory environment Leverage relationships with development banks to facilitate access to financing 46
48 Pilot launch: High visibility, high need, high credibility segments offer opportunity to build awareness and reputation of Reinvented Toilet Geo unlock Segment unlock Rationale Military Rural markets Potential to generate key learnings about getting product to remote sites Green buildings Green consumers New construction Likely to generate trickle down to green consumers Potential to more broadly influence other builders beyond currently green-focused ones National Parks Rural markets Potential to generate key learnings about getting product to remote sites Tourist/religious sites Eager municipalities Rural hospitals Rural schools Trains Refugees Public sites High mass market potential High mass market potential Broader rural market adoption Public sites Likely to generate key learnings for serving high-traffic, public areas (e.g. deal with challenges of overuse, potential vandalism, etc.) Adoption by a municipality (for commercial areas, in high profile locations) will increase exposure and drive broader movement to adopt Product placement in hospitals likely to inspire confidence in RT, allowing for broader adoption; further, could provide learnings of rural procurement/product delivery Learnings could be applied to schools in rural yellow areas, but also more broadly to rural areas (e.g. procurement relationships, tackling supply chain challenges) Demonstration of value prop could allow for broadening to trains in "blue markets" too Likely to generate key learnings for serving high-traffic, public areas (e.g. deal with challenges of overuse, potential vandalism, etc.) 47
49 Scale & expand: Although RT is a new product, it enters an established sanitation ecosystem with potential partners along the value chain Potential to leverage capabilities or as partners, especially for early pilots Critical to invest time and energy to get right Manufacturing Distribution Sales Financing After market support Toilet manufacturers Eco-toilet manufacturers Home appliance manufacturers Sanitation solution providers Water/septic tank manufacturers Wholesale plumbing supply shops Contractor / architect trade shows Consumer hardware, durables or sanitation shops Specialty retailers (e.g. marine sanitation shops) Direct to government Expand customer base by offering financing via: Pay-as-you-go or asset financing, esp. in developing countries with low access to capital Government subsidies or as buyer Partnerships with NGOs Critical to offer in higherend segments and when buyer is not user (e.g. apartment complex) For bottom-of-pyramid segments, ability to selfinstall, service and repair is key Potential to increase revenue potential with after-market services E.g. subscription based model 48


50 Additional resources available via STeP Resource Center Visit: stepsforsanitation.org 49