Sensor networks for public (and regulatory) information
|
|
|
- Willis Snow
- 5 years ago
- Views:
Transcription
1 Sensor networks for public (and regulatory) information A. Bartonova, N. Castell, F. R. Dauge, M. F. Fredriksen, H.-Y. Liu, S. Grossberndt, W. Lahoz, J.-M. Lepioufle, P. Schneider and the CITI-SENSE team at NILU NILU Norwegian Institute for Air Research, Kjeller, Norway
2 Air pollution: WHO (2015) 26 MAY 2015 GENEVA - The World Health Assembly closed today, with Director-General Dr Margaret Chan noting that it had passed several landmark resolutions and decisions. Three new resolutions were passed today: one on air pollution, one on epilepsy and one laying out the next steps in finalizing a framework of engagement with non-state actors. Air pollution Delegates at the World Health Assembly adopted a resolution to address the health impacts of air pollution the world s largest single environmental health risk. Every year 4.3 million deaths occur from exposure to indoor air pollution and 3.7 million deaths are attributable to outdoor air pollution. This was the first time the Health Assembly had debated the topic.
3 Legislative efforts - air quality EU (Council) Directives: 80/779/EEC AQ limits SO 2 96/62/EC, 2008/50/EC on ambient air quality Sources regulations: National emission ceiling directive Traffic emissions (EURO standard) Fuel quality directive Waste incineration directive UN ECE CLRTAP 1979 Convention on Longrange Transboundary Air Pollution Protocols: 1999/2012 Acidification, Euthrophication and Ground-level Ozone 1998/2009 Persistent Organic Pollutants 1998/2012 Heavy Metals 1994 Sulphur emissions 1991 Volatile Organic Compounds 1998 Nitrogen Oxides transboundary fluxes 1985 Sulphur emissions reduction
 Standardization Comparability")
4 The resulting AQ monitoring Based on scientific consensus achieved through a broad stakeholder involvement (research, policy, corporate/collective stakeholders) Standardization Comparability Information systems


5 : technologies change


6 technologies change


7 CITI-SENSE in 9 European cities Ostrava Edinburgh Haifa Oslo Vienna Vitoria Gasteiz Belgrade Ljubljana Barcelona


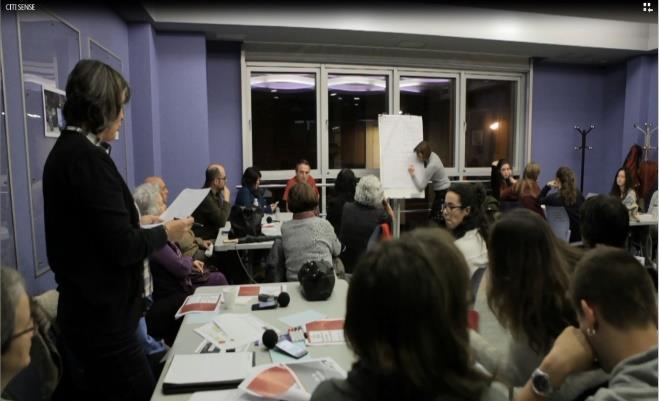
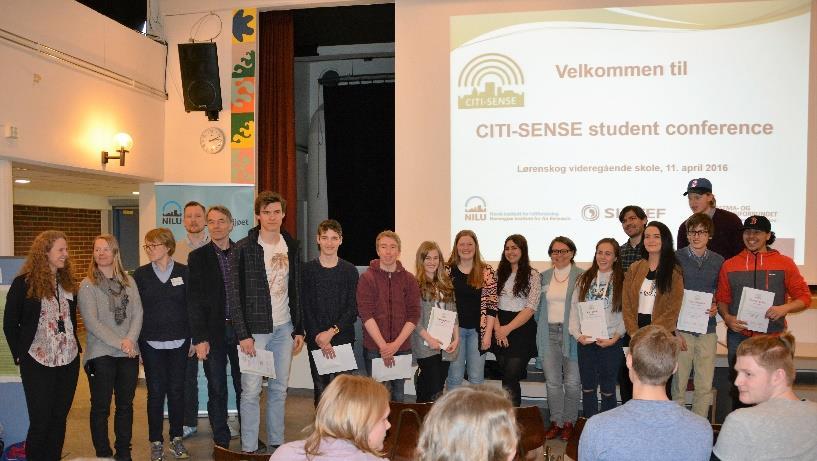
8 The people behind CITI-SENSE

9 CITI-SENSE Implementation FP7 grant no
10 3 universities 7 secondary schools 17 elementary schools 54 kindergartens 9 tennants associations 9 cities >1.200 CityAir-app-users 2036 reported perceptions, app still running! 324 air sensor units in network at >50 public places volunteers one time Additional sensor clusters EUROPE 327 LEOvolunteers 1530 answers to AQ questionnaire >300 evaluations of products 9,4 million observations (9/2015-9/2016)
11 Challenges Technology: low-cost sensor systems challenges Technology: connectivity User issues: deployment User issues: value proposition


12 Data quality: calibration in the laboratory and in the field


13 Typical deployment Static Leapcraft platform Static AQMesh platform


14 Performance assessment of hackair PM sensors Co-locating three hackair PM sensor at an air quality monitoring station (Kirkeveien, Oslo). Dense traffic area Road transport is major emission source of PM Data registered from 24/11/2017 to now

15 Large deployments require smart calibration Source: EEA Technical report in preparation, M. Viana
16 Connectivity: simplified platform https post XML OGC compliant standard https get XML OGC compliant standard Sensor Sensor Sensor provider platform Ingesting Service CITI-SENSE SEDS Spatial Environmental data server Publishing Service Data processing services Data fusion services Visualization widgets End users Sensor Sensor
17 Data processing infrastructure From raw data to processed/quality assured data Research questions: Calibration routines (individual instrument - CEN; network -?) Sensor network properties Visualisation methodologies Underlying technologies and connectivity/datasharing
18 What people want to know on AQ Notifications pollution Info current AQ AQ index poor/good AQ AQ where you are Info forecasted AQ AQ levels in own routes Info to protect your health Select cleaner routes Numeric concentrations Info past AQ Report own perception See others' perception What would you like to see on an app? 0% 20% 40% 60% 80% 100% not a priority low medium high essential FP7 grant no
.")

19 Real time air quality map Source: Schneider, P., Castell, N., Vogt, M., Dauge, F. R., Lahoz, W. A., & Bartonova, A. (2017). Mapping urban air quality in near real-time using observations from low-cost sensors and model information. Environment International, 106, doi: /j.envint

20 Air quality on a map CITI-SENSE: FP7 R&I Grant agreement nº:
21 Are low cost sensors really lowcost? Public monitoring networks: High investment cost Rigorous QA/QC (High) operating costs Benefit: comparability in time and space Sensor systems: Low investment costs for monitoring technology Unclear QA/QC High operating costs for sustained operation Benefit: local and spatial resolution high
22 Way forward: low-cost sensor system network Sensor system unit is not a miniature reference station (low public literacy in metrology) Siting: natural variability and large gradients of air quality within an urban area Strenght is in numbers: the network
23 Way forward Sensor systems network infrastructure Heterogeneous sensor system deployment ICT infrastructure for data harvesting Requires new funding mechanisms Data processing infrastructure On the fly calibration and correction Connectivity to other systems Real time products Service provided by the municipality/epa

24