WGs & MC Meeting at SOFIA (BG), December 2015
|
|
|
- Hortense McCormick
- 5 years ago
- Views:
Transcription


1 European Network on New Sensing Technologies for Air Pollution Control and Environmental Sustainability - EuNetAir COST Action TD1105 WGs & MC Meeting at SOFIA (BG), December 2015 New Sensing Technologies for Indoor Air Quality Monitoring: Trends and Challenges Action Start date: 01/07/ Action End date: 30/04/ Year 4: 1 July April 2016 Assessing the air pollution distribution in a busy street of Copenhagen in the further development of a street pollution model Aarhus University COST is supported by the EU Framework Programme Professor Ole Hertel WG Leader Department of Environmental Science, Aarhus University, Denmark oh@envs.au.dk ESF provides the COST Office through a European Commission contract
2 Aim of study at H.C. Andersens Boulevard Further develop Street Poll. Model (OSPM) Provide spatial data for testing the model Explain concentration jump at CPH street Focus on: non-street canyons, inhomogeneous emissions, NO x /NO 2
3 The Operational Street Pollution Model (OSPM) wind Background pollution Recirculated pollution Leeward Direct emission Windward
4 Most data from Street Canyons (D) A B C D E

5 Mapping performed for all Danish addresses

6 Application of AirGIS/OSPM for exposure study Exposure bicycling home & work shortest & cleanest
7 Long term effects Danish studies NO 2 per 10 µg/m 3 Mortality Total 8 % (CI: 1-14 %) Cardiovascular illness 16 % (CI: 3-31 %) Ischemic 8 % (CI: %) Stroke 9 % (CI: %) Incidents/hospital admission Cardiovascular illness Stroke, all 5 % (CI: %) per 43 % increase in NO 2 Stroke, fatal 22 % (CI: 0-50 %) per 43 % increase in NO 2 Airways disease COPD 8 % (CI: 2-14 %) per 6 µg/m 3 Asthma (elderly) 12 % (CI: 4-22 %) per 6 µg/m 3 Lung cancer NO x 5 % (CI: 1-10 %) per 12 µg/m 3 9 % (CI: %) & 37% (CI: 6-76 %) per 100 µg/m 3

8 The use of OSPM world-wide

9 Basic principle of OSPM

10 Direct contribution
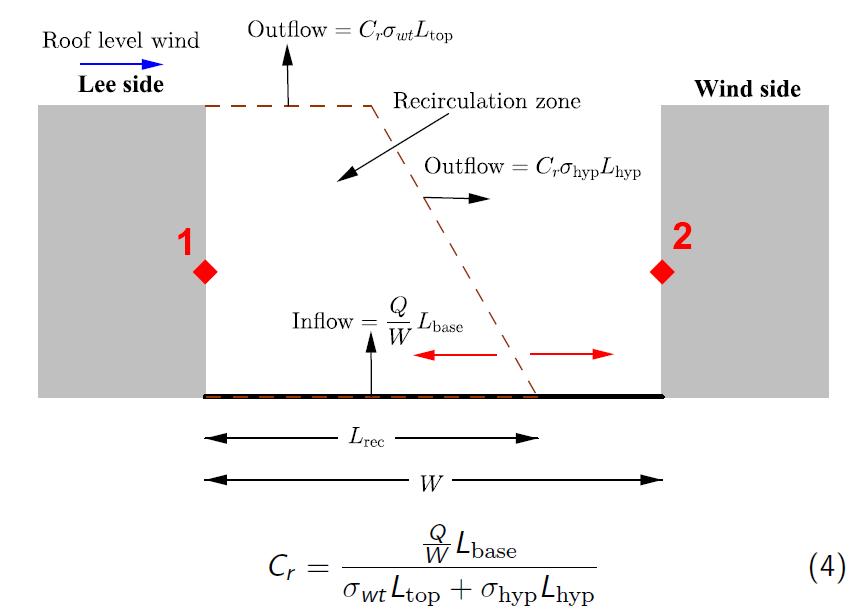
11 Recirculation zone

12 Inhomogeneous emissions

13 NOVANA Concentration Street increment City increment Regional City area Distance
14 Wind direction dependency: testing inhomogeneous emission description DK NO x NO 2
15 Wind direction dependency: Testing inhomogeneous emissions Swedish street NO x NO 2
16 Diurnal variation: Testing inhomogeneous emissions DK NO x NO 2


17 Coupled models in the THOR system Long-range transport Urban scale Weather Street level Roof level wind Background pollution Recirculating air Performs 3-days prognoses of Air Quality 4 times a day Leeward side Direct plume Windward side
18 Trend at H.C. Andersens Boulevard

19 Trend at H.C. Andersens Boulevard

20 NO2 and O3 sensors from Alphasense
21 Test of electro-chemical sensors from Alphasense at H.C. Andersens Boulevard - still in ongoing within MSc project NO 2


22 Radiello NO2 passive samplers

23 At Tivoli: 3x light poles + 2 x on Tivoli fence

24 At Mayor house: 4x light poles + 2 x on facade


25 Crossing & Mayor house


26 Town hall Tivoli Mean value of first & second campaign Correction factor: 2.1 Units: µg NO 2 /m

27 Vindretning ,00 32,00 82,00 132,00 182,00 232,00 282,00 332,00 382,00 432,00 482,00 Wind from amusement park Tivoli give low concentrations


28 Traffic lanes before and after new bus lane at H.C. Andersens Boulevard


29 Traffic lanes before and after new bus lane at H.C. Andersens Boulevard
30 Conclusions: Need spatial distribution data in urban areas Both single streets and street networks Various low-cost sensors applicable Changed traffic lanes strongly affect levels Street pollution models are strong tools but still need further refinements Ottosen, T.-B., Ketzel, M., Skov, H., Hertel, O., Brandt, J., Kakosimos, K., Analysis of the Impact of Inhomogeneous Emissions in a Semi-Parameterized Street Canyon Model. Geosci. Model Dev., 8(10), , Ottosen, T.-B., Ketzel, M., Skov, H., Hertel, O., Brandt, J., Kakosimos, K., A paramter Estimation and Identifiability Analysis Methodology Applied to a Street Canyon Air Pollution Model. Submitted for publication in Environmental Modelling & Software. Under review