Nitrate Tracking in the Lower Yakima Basin
|
|
|
- Lisa Dean
- 5 years ago
- Views:
Transcription

1 Nitrate Tracking in the Lower Yakima Basin Matt Bachmann, Ph.D. September 19 th, 2013 U.S. Department of the Interior U.S. Geological Survey
2
3 GWMA objectives reduce nitrate concentrations in groundwater below state drinking water standards address all the significant sources of nitrate and bacterial pollution in a comprehensive manner contamination threat will be reduced or stabilized within 5 years reductions of contaminants will be measured and shared with the public by 2013 will identify and describe the contributing activities to groundwater contamination based on scientific data
4 Underground aquifer locations and shapes Well locations, depths, and pumping rates Deep soil sampling [NO 3 ] profiles Known land uses and nitrogen loading rates [NO 3 ] database Model Groundwater flow path directions and velocities Irrigation types and application rates Depth of vadose zone Soil type and structure Nitrate attenuation in soil and groundwater
5 Defined recharge areas for all wells [NO 3 ] plume maps Plume velocities and directions Total N budget that is spatially and temporally discretized Identification of relative N contribution from each potential source Model Site-specific N loading rates that are protective of groundwater Expected time delay until surface changes show up in wells Identification of locations best suited to N removal Expected impacts of proposed changes to nutrient management Compliance scenarios
6 How do nutrients get from land surface to the water table? Process-Based Groundwater Vulnerability Assessment (P-GWAVA) Mechanistic, not statistical model Uses USDA model (RZWQM) for nutrient transport and reactions in the vadose zone Uses NRCS (SSURGO) soil property data to estimate model input parameters Attenuates applied nutrients before delivery to groundwater

7 P-GWAVA generates nutrient profiles based on land use and soil type
8 How do nutrient plumes move in groundwater? Existing Yakima groundwater model, converted to MT3D 1,000 x 1,000-ft cells 4.6 million active cells 5,575 cubic miles of aquifer material 48 hydrogeologic units 24 model layers Simulation Period: month time steps (504 stress periods)
9 MT3D conversion of Yakima model Simulates reactive contaminant transport in groundwater Generates groundwater concentration plumes and evolves them over time Includes irrigation rate, groundwater pumping, and streamflow impacts on subsurface flow Particle tracking results already finished
10 What is the time scale of connection between land application and drinking water well? Vadose zone transport plus groundwater transport time Requires both models Typically measured in decades, not months
11 P-GWAVA simulations in vadose zone can be calibrated to GWMA soil sampling results MT3D simulations in groundwater can be calibrated to GWMA nitrate assessment results

12 How will nutrient concentrations change over time under alternative futures? Loading rates and management practices: P-GWAVA Groundwater plumes: MT3D
13 Proposed Work Specify N loading rates at land surface Convert P-GWAVA from a site-specific to a basin-wide model Convert Yakima groundwater model to MT3D Link P-GWAVA loading rates to MT3D input rates Calibrate combined transport model to the GWMA s nitrate assessment
14 Available datasets

15 SSURGO soil type designation

16 SSURGO percent sand soil composition

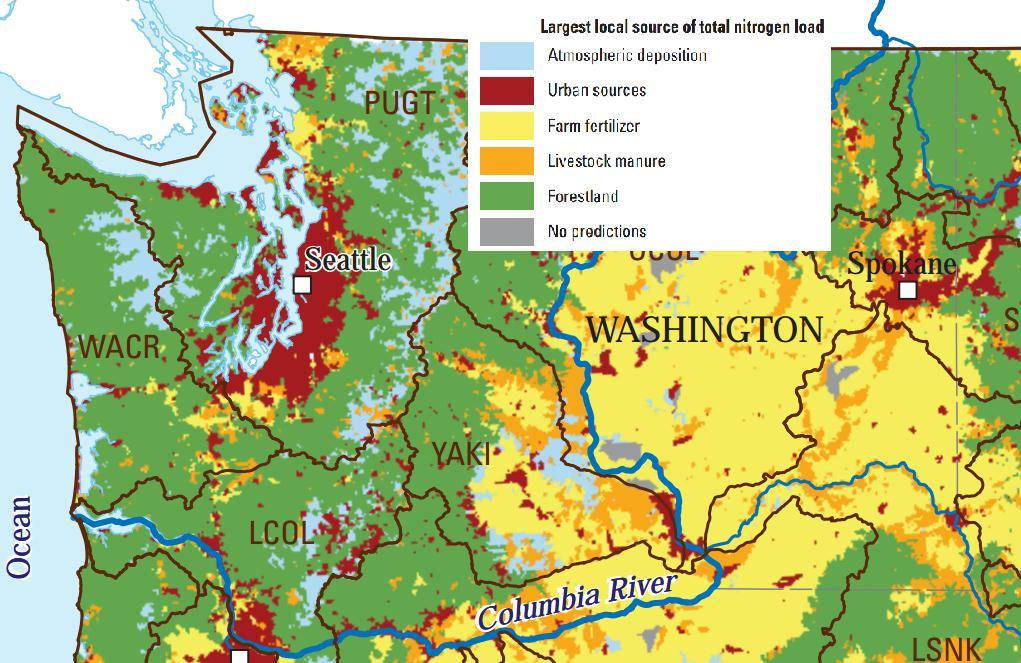
17 Livestock waste distribution Preliminary, predecisional results not approved for public release.

18 Atmospheric N deposition

19 Land use by section, WSDA

20 Land use by field, Vaccaro 2006
21 Proposed Work Specify N loading rates at land surface Convert P-GWAVA from a site-specific to a basin-wide model Convert Yakima groundwater model to MT3D Link P-GWAVA loading rates to MT3D input rates Calibrate combined transport model to the GWMA s nitrate assessment
22 How USGS might help Monitoring and Assessment - $417 unallocated Groundwater monitoring system Database construction Nutrient loading/nitrogen budget - $50k unallocated Develop mass balance approach to N loading Best Management Practices - $107k unallocated Evaluate BMPs for effectiveness Address specific nitrate sources Irrigation Water Management - $704k unallocated Develop management strategies specific to land use to reduce leaching of nitrate to groundwater
23 Project Logistics Showcase for new nutrient modeling technology Increases likelihood of USGS matching funds Project duration 18 months to three years, depending on desired outcomes Will require working closely with the GWMA Should have cooperation of basin partners Ecology EPA Dept. of Ag Dept. of Health Yakima County Yakama Nation Producers
24 GWMA objectives reduce nitrate concentrations in groundwater below state drinking water standards address all the significant sources of nitrate and bacterial pollution in a comprehensive manner contamination threat will be reduced or stabilized within 5 years reductions of contaminants will be measured and shared with the public by 2013 will identify and describe the contributing activities to groundwater contamination based on scientific data
25
26


27