United Nations Environment Programme en.lighten Initiative
|
|
|
- Stella Hutchinson
- 5 years ago
- Views:
Transcription

1 United Nations Environment Programme en.lighten Initiative Quantitative Benefits of a Transition to Energy-Efficient Products and Equipment in Myanmar Michael Scholand 15 February 2015
2 Table of Contents 1 Growth in Electricity Demand 2 Efficiency = Negawatts 3 How do we do it? 4 Summary of Key Points 2


3 Electricity use in our homes.. is really about the services provided: hot tea and cool rooms. 3


4 Electricity Supply and Demand SUPPLY (power sources) and DEMAND (what we use) 4
 More homes connected to the grid 2) More appliances in each home lighting, air conditioning, refrigerators 3) Expansion of commercial sector offices, hospitality,")
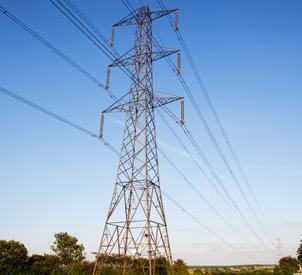
5 Simplified Electricity Network This is an illustration of the UK s National Grid.how electricity gets from the power station to the various end-use applications. As Myanmar s economy grows: 1) More homes connected to the grid 2) More appliances in each home lighting, air conditioning, refrigerators 3) Expansion of commercial sector offices, hospitality, tourism 4) Expansion of industrial sectors manufacturing, production 5

6 Myanmar Electricity Demand Forecast Bottom line: Economic growth and newly electrified households are two key factors expected to drive electricity demand. Source: 6

7 Rapid Growth in Electricity Demand Public and private funds tied up in power plant investment Less public money available for other critical services healthcare, education Less private money available for investment in other sectors Risk of delays, supply may not meet demand Black-outs / Brown-outs negative impact on business Investment in Myanmar could slow because of grid stability risks Households inconvenienced, risk of damage to appliances Energy-efficiency offers a solution.use less energy while still providing the same service 7
8 Table of Contents 1 Growth in Electricity Demand 2 Efficiency = Negawatts 3 How do we do it? 4 Summary of Key Points 8
 Incorporating design improvements into existing models 2) Using")
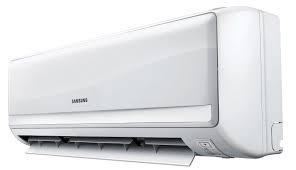
9 What is Energy-Efficiency? Efficiency provides the same service using less energy 1) Incorporating design improvements into existing models 2) Using different technologies, providing same service 1 2 Incandescent 60 Watts 800 lumens LED 8 Watts 800 lumens 9


10 Compare two refrigerators Save 37% Power Model A Capacity: 422 Litres Price: Ks. 389,000 Elec: 506 kwh/yr Elec: Ks. 20,240 /yr Total cost for 10-years Ks. 591,400 Model B Capacity: 420 Litres Price: Ks. 419,000 Elec: 318 kwh/yr Elec: Ks. 12,720 /yr Total cost for 10-years Ks. 546,200 Payback: 4 years Note: Used Ks. 40/kWh 10
 Light: 800 lumens Life: 8000 hours Price: Ks. 2000 Power: 15 Watts Elec: 16 kwh/yr Elec: Ks. 657 /yr Total cost for 10-years Ks. 10,570 Payback: 0.")
11 Compare three lightbulbs Save 75% Power Save 87% Power Incandescent Light: 800 lumens Life: 1000 hours Price: Ks. 400 Power: 60 Watts Elec: 66 kwh/yr Elec: Ks /yr Total cost for 10-years Ks. 30,280 Compact Fluorescent Lamp (CFL) Light: 800 lumens Life: 8000 hours Price: Ks Power: 15 Watts Elec: 16 kwh/yr Elec: Ks. 657 /yr Total cost for 10-years Ks. 10,570 Payback: 0.8 years Light Emitting Diode (LED) Light: 800 lumens Life: 15,000 hours Price: Ks Power: 8 Watts Elec: 9 kwh/yr Elec: Ks. 350 /yr Total cost for 10-years Ks. 11,504 Payback: 3.3 years Note: Assumed 3 hours/day; used Ks. 40/kWh 11


12 Efficiency is a Negawatt Power Station A challenge of very rapid electricity growth Efficiency can be a Negawatt power station Efficiency offers many benefits: Free up existing electric power capacity Slow rate of new electricity demand growth Lower electricity bills for consumers and business Lower electric power subsidy cost for government Reduce peak power demand So how much electricity could Myanmar save? 12
13 Global Efficient Appliances and Equipment Global Electricity Consumption in 2030 Lighting - continuing with LEDs & controls Electric motors (excl. AC & refrigerators) Air conditioners Information technology Refrigerators Transformers 36,000 TWh current policies scenario Σ >50% of global electricity Data Sources: IEA Key World Energy Statistics 2013, IEA World Energy Outlook 2013, Lawrence Berkeley National Laboratory BUENAS Model; US EIA, UNEP 13


14 Country Lighting Assessment On-Grid 14


15 Global Efficient Appliances and Equipment The potential annual savings in select Asian countries from refrigerators and AC (Bangladesh, Indonesia, Myanmar, Pakistan, Philippines, & Thailand) Save electricity by over 140 TWh more than 28% of current electricity use Reduce CO2 emissions by equivalent to 46 million passenger cars Save 14.0 billion US$ on electricity bills 83 million tonnes per year Data Sources: IEA Key World Energy Statistics 2013, IEA World Energy Outlook 2013, The Green Cooling Initiative, SAPP Annual Report 2013, UNEP 15


16 Global Efficient Appliances and Equipment Shares in savings from each product Domestic refrigerators Room air conditioners Other appliances & equipment to be assessed: Motors Transformers ICT Fans Data Sources: IEA Key World Energy Statistics 2013, IEA World Energy Outlook 2013, The Green Cooling Initiative, SAPP Annual Report 2013, UNEP 16
17 Table of Contents 1 Growth in Electricity Demand 2 Efficiency = Negawatts 3 How do we do it? 4 Summary of Key Points 17

18 Integrated Policy Approach To permanently remove inefficient products from the marketplace and to promote the uptake of high efficiency products To communicate the policy, promote the transition among all stakeholders and to finance the programmes and initiatives To monitor and enforce the efficient appliance policy, and ensure the energy performance and environmental benefits To promote principles and best practices such as extended producer responsibility and establishment of collection and recycling schemes 18


19 # products Transforming the Market 2. Enegy Labels 1. MEPS 3. Procurement, and other labels Higher energy efficiency
20 UNEP Resources to Support the Process Tools Global Efficient Lighting Policy Map Country Lighting Assessments Payback Period Calculator Guidebooks Accelerating the Transition to Efficient Lighting Toolkit National/Regional Efficient Lighting Strategy Guide Nationally Appropriate Mitigation Action (NAMA) Guide Minimum Energy Performance Standards (MEPS) Guidebook Collaborating Centres Global Efficient Lighting Centre Ambilamp Academy 20

21 Global Efficient Lighting Policy Map Progress in countries adopting the integrated approach all four components See examples from the countries that have already begun to phase out inefficient products On the en.lighten policy map, use the links to find the legislation for each country, including the details of which types of lamps are addressed, what energy and light output levels determine acceptable performance, and when the phase-out will occur 21

22 Myanmar Spreadsheet to look at cost-effectiveness of efficient lighting policy measures. Calculation Inputs (per lamp): Country: Myanmar Currency: Ks. Lamp is on for hours/day: 3.00 hours/day Electricity price: 40 Ks./kWh Annual change in price of Electricity: 1.0% percent Electricity CO2 intensity: kg CO2/kWh Discount Rate: 10.0% percent Incandescent (INC) lamp Incandescent (INC) lamp wattage: 60 Watts Incandescent (INC) lamp lifetime: 1000 Hours Incandescent (INC) lamp cost: 400 Ks./lamp Halogen (HAL) lamp Halogen (HAL) lamp wattage: 52 Watts Halogen (HAL) lamp lifetime: 2000 Hours Halogen (HAL) lamp cost: 1000 Ks./lamp Compact Fluorescent (CFL) lamp Compact Fluorescent (CFL) lamp wattage: 15 Watts Compact Fluorescent (CFL) lamp lifetime: 8000 Hours Compact Fluorescent (CFL) lamp cost: 2000 Ks./lamp Light Emitting Diode (LED) lamp Light Emitting Diode (LED) lamp wattage: 8.0 Watts Light Emitting Diode (LED) lamp lifetime: Hours Light Emitting Diode (LED) lamp cost: Ks./lamp Payback Period Calculator Inputs 22
23 Payback Period Calculator - Results Calculation Outputs (per lamp): Incandescent Halogen CFL LED Annual electricity consumption for each lamp type: kwh/year Annual electricity savings compared to incandescent lamps: kwh/year Percent electricity savings compared with incandescent lamps: % 75% 87% percent Annual electricity cost for operating the lamps (each year): 2,628 2, Ks./year Savings in Ks. of electricity costs per year 343 1,971 2,278 Ks./year Life-Cycle Cost (LCC) of one lamp operating for 13 years. LCC time period of analysis: years LCC of operating lamp for 13 years: 24,811 23,646 8,409 10,871 Ks. (2015) LCC savings compared with incandescent lamps: --- 1,165 16,402 13,940 Ks. (2015) Percent LCC savings compared with incandescent lamps: --- 5% 66% 56% percent LCC savings are (X) times larger than halogen LCC savings times greater CO2 emissions due to electricity for one lamp operating for 13 years: kg CO2/13 yrs CO2 savings compared with an incandescent lamp: kg CO2/13 yrs CO2 savings is (X) percent more than halogen CO2 savings: % 564% percent Simple Payback Period and Internal Rate of Return (IRR) Simple Payback period in years years Simple Payback period in months: months Payback period is (X) percent better than halogen payback: % not defined shorter Internal Rate of Return (IRR) for each lamp type: % 150% 34% percent 23

24 En.lighten Toolkit Developed to present a concise set of options and policy suggestions to countries and interested stakeholders Efficient lighting best practices and case studies from programmes throughout the world Technology, policy, consumer and environmental protection issues Countries can select relevant information and guidance and apply these to suit local or regional conditions Promotes the integrated policy approach for lighting 24
 covers the rest of the country comprising 13 states and regions, including off-grid.")
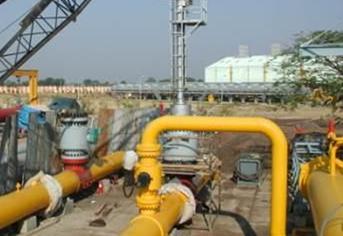
25 Myanmar - Ministry of Electric Power Yangon City Electricity Supply Board (YESB) is responsible for the supply of electricity to consumers in Yangon City. Electricity Supply Enterprise (ESE) covers the rest of the country comprising 13 states and regions, including off-grid. 25


26 Electric Power Sector Structure 26
27 Table of Contents 1 Growth in Electricity Demand 2 Efficiency = Negawatts 3 How do we do it? 4 Summary of Key Points 27
28 Key Points Myanmar is experiencing a rapid increase in electricity demand Meeting that demand consumes considerable resources and puts quality of supply at risk Energy-efficiency offers a Nega-watt power station solution Reducing consumption while providing the same service (e.g., hot tea) Slow rate of increase in demand from electrification and economic growth while lowering consumer bills Cost-effective payback periods available now, with large reductions in electricity consumption Sustainable market transformation - the Integrated Policy Approach UNEP s Global Efficient Appliances and Equipment Programme can help with lighting, air-conditioning, motors, transformers, refrigerators, information technology and fans 28
29 Thank You 29