2010 Residential Waste Stream Composition Study Results. Seattle Public Utilities and Neighborhoods Committee March 8, 2011
|
|
|
- Gary Hampton
- 5 years ago
- Views:
Transcription

1 2010 Residential Waste Stream Composition Study Results Seattle Public Utilities and Neighborhoods Committee March 8, 2011
2 Presentation Overview Overview of Seattle waste stream Waste Composition Study methodology Detailed tables and material category definitions Summary study results Single Family Houses Multi Family Houses
3 Seattle Recycling Rate 2009 Recycle Rate Sector Total Seattle 51.1% Residential Total 58.4% Single Family 68.7% Multi-Family 27.0% Commercial 54.9% Self Haul 16.7%
4 Seattle Waste Disposed ,600 Single Family 19% Commercial 42% Multi-Family 15% Self Haul 24%
5 ,000 Single Family Generated, Recycled and Disposed 200, ,000 Recycled 100,000 50,000 Disposed 0
6 250,000 Multi-Family Tons Generated, Recycled and Disposed 200, , ,000 50,000 Recycled Disposed
7 Waste Composition Study Methodology Sampling done every 4 years (1988, 1990, 1994, 1998,2002, 2006 and now 2010) Pick days of week each month throughout year, then randomly pick routes by contractor As truck enters station to dump, we pull it aside, have it dump load in pit, pull 250 pound sample Sort to 102 categories (first sort in 1988 was 52 categories) Sample 2-3 days per month for a year, 12 samples per day
8 Other Waste Composition Studies The Commercial and Self Haul waste streams were last sampled in 2008 (and also in 1988, 1992, 1996, 2000, 2004) We are moving up slightly the schedule for the next study, should be completed fall 2012

9 Residential truck, samples taken from these trucks after they collect from their route

10 Operator and Lead Sampler discussing selecting a sample from load

11 Garbage Truck Dumping Load into Pit, Sample will be taken from dumped load

12 Example of a 250 pound residential sample ready to be sorted

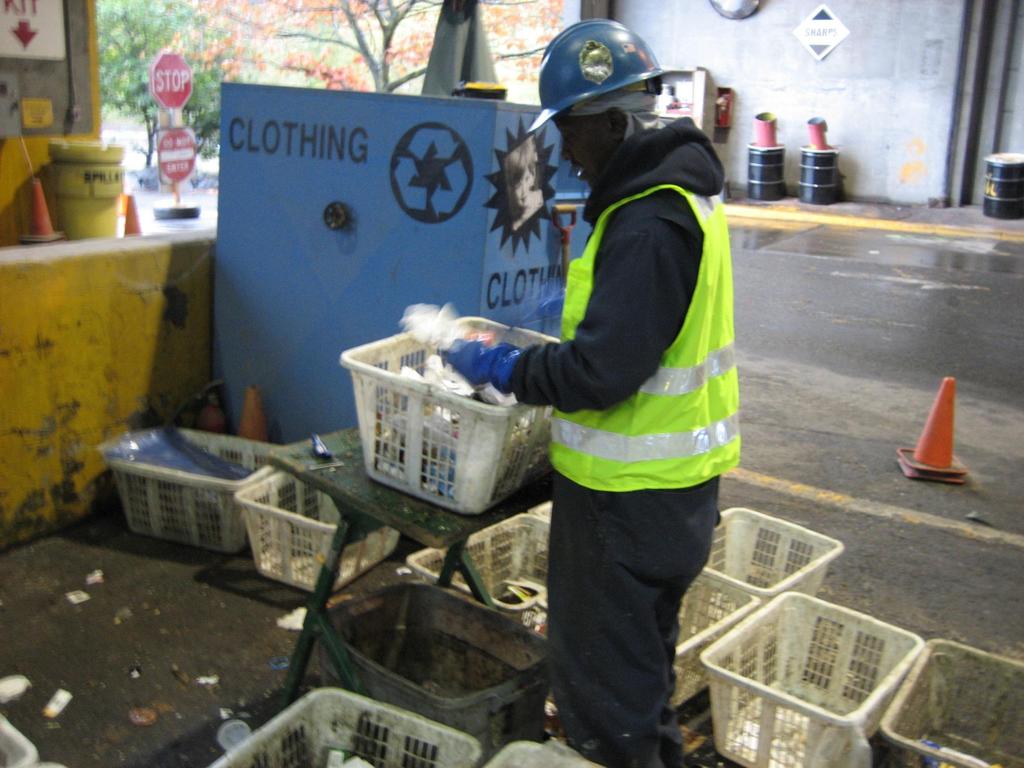
13 Sorter at work, materials sorted into baskets Each sorter specializes in a group of materials
14
15 Overall Results See handouts for the detailed single family and multi family results Definition of categories is useful, refer to these if you have a question about which category a particular item is sorted into for example: WAXED OCC/KRAFT PAPER: Old waxed/coated corrugated container boxes and Kraft paper, and brown paper bags
16 Tons Recycled or Composted Single Family Waste Generated ,000 Tons Recyclable Tons Disposed Tons Disposed Non- Recyclable Compostable Tons Disposed
17 Aluminum Beverage Single Family Waste Recycled and Disposed by Material 2009 Beverage Glass Construction Debris Container Glass Computer Office Paper Food Cans Food Miscellaneous Mixed Scrap Paper Newspaper Other Paper Other Aluminum Corrugated Kraft Other Ferrous Other Glass Other NonFerrous Other Organics Plastics Wood Yard 70,000 60,000 50,000 40,000 30,000 20,000 10, ,000 tons generated, 68.7% recycle rate 67,000 tons disposed Recycled Disposed
18 Non Recyclable Paper, Glass, Plastics, Metals 6% Appliances, Electronics, Furniture 0% Single Family Tons Disposed CDL,Fines, Organics and Misc 13% Compostable Food and Yard Waste 31% Pet Waste and Diapers 23% Other Recyclable 0% 64,315 Tons Disposed in 2010 Recyclable Paper, Food Cans, Alum, Glass, Plastic 27%
19 Multi Family Waste Generated ,500 Tons Tons Recycled/ Composted Recyclable Tons Disposed Tons Disposed Non- Recyclable Compostable Tons Disposed
20 16,000 14,000 12,000 Multi Family Waste Recycled and Disposed by Material ,500 tons generated 27% recycle rate 51,500 tons disposed Disposed Recycled 10,000 8,000 6,000 4,000 2,000 -
21 Appliances, Electronics, Furniture 2% Non Recyclable Paper, Glass, Plastics, Metals 8% Multi Family Tons Disposed CDL,Fines, Organics and Misc 15% Compostable Food and Yard Waste 33% Pet Waste and Diapers 11% Other Recyclable 0% 49,820 Tons Disposed in 2010 Recyclable Paper, Food Cans, Alum, Glass, Plastic 31%
22 How is Data Used Performance Measures Informs recycling rate Calculate % of waste disposed that is recyclable Evaluation Critical component of our evaluation of existing programs Analysis around planning for the future Comprehensive Plan and Recycling Potential Assessment
23 Next Steps We are currently working on the Solid Waste Comprehensive Plan Briefing of SPUN later this month Part of Comprehensive Plan is our Recycling Potential Assessment Looks at what is left in waste stream at very detailed level Analyzes recycling programs to estimate the diversion potential of each and the cost and benefits The Plan will include several packages of programs and the cost and resulting recycling rate
24 Questions