Drivers of temporal variations of CO 2 flux at a submerged macrophyte habitat in Lake Taihu
|
|
|
- Felicia Todd
- 5 years ago
- Views:
Transcription
1 Drivers of temporal variations of CO 2 flux at a submerged macrophyte habitat in Lake Taihu Gao Yunqiu YNCenter Weekly Video Conference
2 Outline Background Site description Data post-processing method Results Conclusions On-going work
3 Background Lakes play crucial roles in global carbon cycle (Tranvik et al, 29) and their social importance cannot be ignored as they have impacts on local climate (Cole et al, 1994). Freshwater lakes usually act as sources of atmospheric carbon with CO 2 supersaturated (Cole et al, 1994), except for some high algal activities (Balmer and Downing, 211). Lake Taihu located in Yangtze River Delta, the 3 rd largest freshwater lake in China with average depth of 1.9m. Is this eutrophic lake a source or sink of atmospheric CO 2 (Lee et al, 214).?

4 Wikipedia
")


5 Site description Bifenggang site 避风港站 (BFG, 31 o 1ʹ28"N, 12 o 24ʹ1"E) Dominated by submerged macrophytes Started on 15 December 211 Water depth: 1.7 m EC height: 8.5 m above water surface. EC gas analyzer: Campbell EC15 (Lee et al. 214)
6 Data post-processing method 2 2-D coordinate rotation Sonic temperature correction for sensible heat flux Fc (μmol m-2 s -1 ) WPL correction -2 2 Eliminating the EC data when it rains Half hourly post-processing data Day of year Time series of post-processing CO2 flux
7 Results 5 Fc (μmol m -2 s -1 ) Jan Feb Mar Apr May Jun Jul Aug Sep Oct Nov Dec Fc (μmol m -2 s -1 ) Jan Feb Mar Apr May Jun Jul Aug Sep Oct Nov Dec Month Fig.1 Monthly mean time series of CO 2 flux
8 Fc (μmol m -2 s -1 ) Spring -3 Summer : 4: 8: 12: 16: 2: 24:: 4: 8: 12: 16: 2: 24: Fc (μmol m -2 s -1 ) Autumn -3 Winter : 4: 8: 12: 16: 2: 24:: 4: 8: 12: 16: 2: 24: Time Time Fig.2 Diurnal pattern of CO 2 flux in different seasons from 212 to 215. The error bars indicate the 25th and 75th percentiles.
9 Fc (μmol m -2 s -1 ) : 4: 8: 12: 16: 2: 24: : 4: 8: 12: 16: 2: 24: 9 8 K (W m -2 ) Hc (W m -2 ) 5 : 4: 8: 12: 16: 2: 24: Time 4 : 4: 8: 12: 16: 2: 24: Time Fig.3 Diurnal pattern of Fc, K, Hc and LE from 212 to E (W m -2 )
10 Tab.1 Yearly carbon emission and yearly mean K, Hc and LE C (t m -1 y -1 ) K (W m -2 ) Hc (W m -2 ) LE (W m -2 )
 (2) Lake Tämnaren, east central Sweden, mean depth: 1.3 m, time period: 21-212.")
11 (1) Lake Pallasjärv, northern Finland, mean depth: 9 m, two streams have a peatland-dominated drainage Area, time period: 213. (Lohila et al,215) (2) Lake Tämnaren, east central Sweden, mean depth: 1.3 m, time period: (Podgrajsek et al,215) (3) Five eutrophic, shallow and polymictic lakes, Danish (Keppesen et al,215).
12 Biological A submerged macrophyte habitat CAM Drivers of CO 2 flux Dynamic Turbulent kinetic energy (TKE) Wind CAM: the Crassulacean acid metabolism
13 The most interesting feature regarding the CO 2 flux (Fc) data is the negative flux in darkness. These nocturnal uptake events usually persist through the whole. They tend to occur in the night following a daylight period of strong solar radiation (Lee et al, 214). In this way, I find all the continue sunny and cloudless days from 212 to 215 by taking incoming shortwave radiation (K) as judgment criterion. Taking a 5 days or longer time period as a case, there are 3, 5,6 and 4 cases in 212 to 215 respectively.


14 212 cases 213 cases


15


16 214 cases


17 215 cases


18
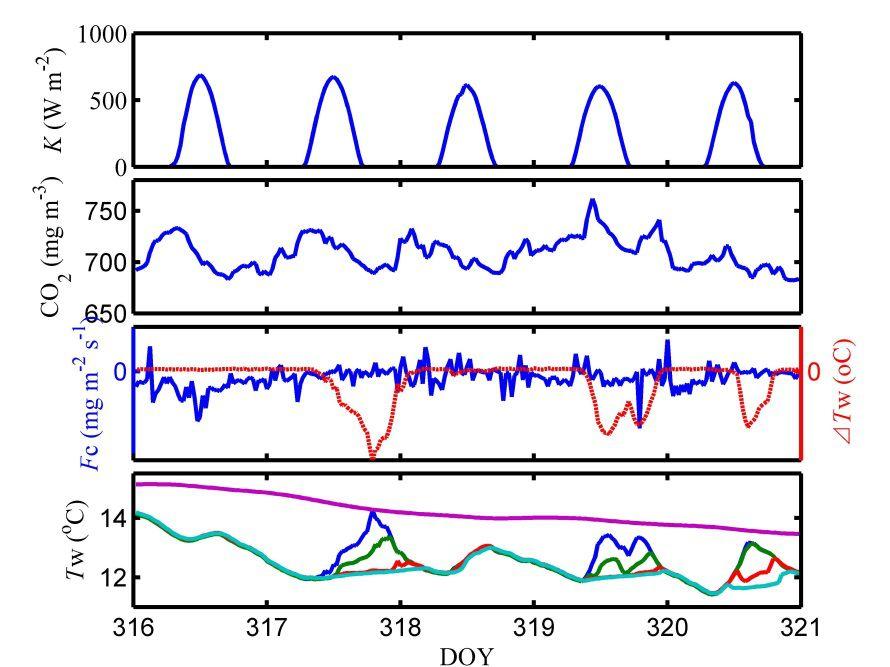
19 K (W m -2 ) CO 2 (ppm) Fc (μmol m -2 s -1 ) Tw ( o C) Day of year 212 a b c d -2 Tw (oc) K (W m -2 ) CO 2 (ppm) Fc (μmol m -2 s -1 ) Tw ( o C) Day of year 213 a b c d Tw (oc) Fig.5 Time series at BFG. (a) Incoming shortwave radiation, (b) CO 2 mixing ratio at BFG (blue line) and at MLW (green line), (c) CO 2 flux (blue solid line) and Tw means water temperature difference between 1cm and 2 cm, (d) water temperature at 2cm (blue), 5cm (green), 1cm (red), 15cm (blue) and 2cm (purple).
20 Fc (μmol m -2 s -1 ) -1-2 Depth (m) 1 a Fc (μmol m -2 s -1 ) Tw ( o C) Depth (m) a Tw ( o C) Depth (m) 1 b Day of year 212 c 1 TKE (cm 2 s -2 ) Fig.6 Time series at BFG. (a) CO 2 flux, (b) Water temperature, (c) TKE. K-ε model A model for vertical turbulent diffusion and stratification in a shallow lake with submersed macrophytes is formulated on the basis of a one-dimensional equation for production, transport, and dissipation of turbulent kinetic energy, coupled with a vertical heat transfer equation. Depth (m) 1 2 b c Day of year TKE (cm 2 s -2 )
21 u (m s -1 ) u (m s -1 ) Day of year Day of year Fc (μmol m -2 s -1 ) Fc (μmol m -2 s -1 ) u * (m s -1 ) > u * (m s -1 ) >.4 Fig.7 CO 2 flux in different friction velocity (u * ) classes.
22 Fc (μmol m -2 s -1 ) Fc (μmol m -2 s -1 ) : 4: 8: 12: 16: 2: 24: Time -5 : 4: 8: 12: 16: 2: 24: Time Fig.8 Diurnal pattern of CO 2 flux Yearly averaged nighttime flux ranges from -1 to μmol m -2 s -1 and is 3 to 4 times the midday flux (Fig. 3). In the 212 case, nighttime flux is about -1 μmol m -2 s -1 and is 5 times the midday flux, similar phenomenon displays in the 213 case.
23 Conclusions This submerged macrophyte habitat in Lake Taihu is a atmospheric CO 2 sink. Diurnal pattern of Fc is quite different with other researches. Drivers of CO 2 flux at this area can be the CAM of aquatic plants and dynamic forces like TKE and friction velocity.
24 On-going work Reading more papers about lake CO 2 flux and do literature summary. As only 2 cases were analyzed, I will continue analyzing other data and determine the drivers of CO 2 flux.

25