Announcements. Homework 8 - paper 2 topics, questions and sources due Tuesday, Nov. 13 Midterm Paper 2 - due Tuesday, Nov. 20
|
|
|
- Lauren Alexander
- 5 years ago
- Views:
Transcription
1 Thursday, November 6th. Announcements. Homework 8 - paper 2 topics, questions and sources due Tuesday, Nov. 13 Midterm Paper 2 - due Tuesday, Nov. 20 Lecture #18-1

2 Lecture #18-2


3 Recall an earlier story Lecture #18-3

4 Lecture #18-4
5 Lecture #18-5

6 Lecture #18-6
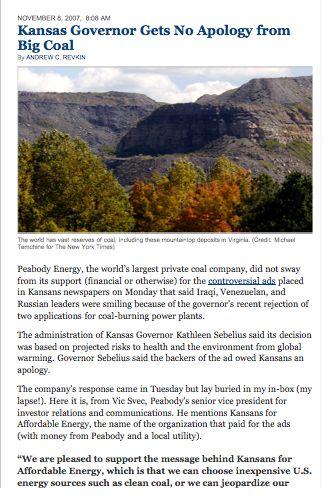
7 In class assignment. What do you think of the news? Should we be looking to large scale geo-engineering projects to solve climate issues? Was Kansas on the right track in denying the permit for a new coal-fired power plant? Have we reached a point where oil demand is outstripping supply, or is the current sharp rise in prices due to financial speculation? What larger trends are these issues indicative of? Lecture #18-7
 precession (23,000-19,000yr) These are known as Milankovitch cycles. Figure produced by Global Warming Art www.globalwarmingart.")
8 The ice age cycles are believed to come from a number of oscillating factors in Earth s orbit eccentricity (how elliptic, 100,000yr) tilt (41,000yr) precession (23,000-19,000yr) These are known as Milankovitch cycles. Figure produced by Global Warming Art Lecture #18-8

9 Milankovitch cycles determine the character of the seasons, which depends on the relative distribution of sunlight between the hemispheres over the year. New ice forms when summers are cooler and winters are less severe. This can happen, e.g. if the tilt of Earth s axis gets smaller if Earth is furthest from the sun in the summer (for a given hemisphere) The basic reason for the seasons is the tilt of Earth s axis. The direction of the tilt stays (almost fixed) over the year. When Earth s axis points towards the Sun, the Northern Hemisphere gets more than 1/2 the sunlight and it is summer in the north (& winter in the South). Lecture #18-9
10 The interplay between CO 2 and global temperatures during the ice age cycles is quite complicated and not entirely well understood. CO 2 levels both influence and respond to global temperatures. Figure produced by Global Warming Art Lecture #18-10
11 Fossil fuel emissions were 7.2 GtC/year over the period Gt = 1 Billion metric tons = klograms Figure produced by Global Warming Art Lecture #18-11

12 CO 2 levels in the atmosphere are increasing at a slower rate than CO 2 emissions. Because rising carbon dioxide levels have increased the efficiency of some natural carbon sinks, the net flux of carbon staying in the atmosphere is currently ~40% lower than fossil fuel emissions each year. Lecture #18-12

13 CO 2 is exchanged between the atmosphere, the biosphere and the geosphere in a number of ways.. Collectively these are known as the carbon cycle, although really there is not a single cycle. Lecture #18-13
14 Carbon is stored in various parts of our environment. Recall that burning fossil fuels adds about 7 Gt/year, which is a relatively small amount compared to the total amounts stored. However, note that the total stored in fossil fuels is much bigger than that in the atmosphere. This means that burning a significant fraction of total fossil fuels reserves can easily change the amount of CO 2 in the atmosphere. Lecture #18-14

15 CO 2 is more soluble in cold water. It is absorbed and sinks along with cold ocean water near the poles, and is released by rising warm water near the tropics. The overall ocean atmosphere system is nearly in equilibrium, but at present slightly more CO 2 is absorbed than released. This makes the oceans a net carbon sink for anthropogenic CO 2 emissions. Lecture #18-15


16 Significant negative RF s come from aerosol pollution. Airborne solid particles or liquid droplets Anthropogenic aerosols come from burning fossil fuels and biomass, and from other industrial processes. Their primary contribution is to increase the albedo of the atmosphere by directly reflecting sunlight and by changing the reflective properties of clouds. It is believed that global temperatures would have risen faster over the past century in the absence of aerosol polution. Lecture #18-16


17 Volcanoes are natural sources of aerosols that can have large (temporary) effects on Earth s albedo and lead to cooling temperatures that can last several years. Such a volcanic winter occurred in the summer of 1816 in North America and Europe following the eruption of Mount Tambora in the Philipines in April, This was the largest volcanic eruption since the year 181. Crops were killed by summer frosts in New England became known as the year without a summer. The dreary summer weather in Europe prompted the friendly horror story competition in which Mary Shelley wrote Frankenstein. The crop failure led to the death of many horses, spurring development of the bicycle. Lecture #18-17
18 IPCC finds that the net effect of all anthropogenic RF components is 1.6 W/m 2. How has Earth s climate responded to this radiative forcing? This is where computer-based climate modelings come in. Based on these models the IPCC has concluded.. In its cautious language, the IPCC report states that "most of the observed increase in globally averaged temperatures since the mid-20th century is very likely due to the observed increase in anthropogenic greenhouse gas concentrations. The previous (2001) IPCC report used the term likely. What does the IPCC say about the future global warming? Lecture #18-18


19 Detailed predictions of future temperatures come from sophisticated computer modeling of the atmosphere and its interactions with land and oceans. Some important ingredients in determining the outcomes are a variety of positive and negative feedback mechanisms.. Positive feedback tends to enhance an effect. Negative feedback tends to reverse it. Positive feedback tends to destabilize a system. Small changes grow bigger and bigger. Negative feedback stabilizes a system. Small changes away from an equilibrium state tend to get smaller. Lecture #18-19

20 Climate feedback mechanisms.. Positive feedback ice-albedo mechanism; ice & snowcover reflect more sunlight than the ground they cover. As the atmosphere warms, ice & snow melt and the ground becomes exposed. Earth absorbs more sunlight, leading to further warming. tropospheric water vapor; warmer air holds more water vapor. Since water vapor is a greenhouse gas, this tends to increase the greenhouse effect. ocean warming; as the atmosphere warms, so does the ocean. CO 2 dissolves more readily in cold water than in warm water. As the oceans warm, their ability to absorb CO 2 decreases, leading to higher levels of CO 2 remaining in the atmosphere. globalchange1/current/lectures/sams on/feedback_mechanisms/ Lecture #18-20
21 Negative feedback. Cloud mechanism; clouds reflect sunlight. Higher atmospheric water vapor levels lead to more clouds and hence raise Earth s albedo. Evaluating the net feedback effect of water vapor is complicated. Lower atmosphere clouds have higher albedo than higher altitude clouds. High altitude clouds contribute more to the greenhouse effect. Figuring out the net contribution requires detailed modeling of cloud formation. Lecture #18-21
22 IPCC projections also make a range of assumptions about future greenhouse gas emissions, which lead to a range of projections. What we do in the coming years will strongly effect global warming trends. Lecture #18-22
23 The 6 lines correspond to 6 different sets of assumptions about future greenhouse gas emissions specified by the IPCC in its 2001 Special Report on Emissions Scenarios. The scenarios start out with overall possibilities for how our global society may evolve. The A1 scenarios are of a more integrated world. The A1 family of scenarios is characterized by: Rapid economic growth; A global population that reaches 9 billion in 2050 and then gradually declines; The quick spread of new and efficient technologies; A convergent world - income and way of life converge between regions. There are subsets to the A1 family based on their technological emphasis: A1FI - An emphasis on fossil-fuels. A1B - A balanced emphasis on all energy sources. A1T - Emphasis on non-fossil energy sources. Lecture #18-23
24 The A2 scenarios are of a more divided world. A world of independently operating, self-reliant nations. Continuously increasing population. Regionally oriented economic development. Slower and more fragmented technological changes and improvements to per capita income. The B1 scenarios are of a world more integrated, and more ecologically friendly.!rapid economic growth as in A1, but with rapid changes towards a service and information economy. Population rising to 9 billion in 2050 and then declining as in A1.!Reductions in material intensity and the introduction of clean and resource efficient technologies. An emphasis on global solutions to economic, social and environmental stability. The B2 scenarios are of a world more divided, but more ecologically friendly. Continuously increasing population, but at a slower rate than in A2. Emphasis on local rather than global solutions to economic, social and environmental stability. Intermediate levels of economic development. Less rapid and more fragmented technological change than in B1 and A1.an in B1 and A1. Lecture #18-24
 over the next century, while the fossil fuel scenario gives a rise of 4.0C (7.2F) with a large uncertainty.")
25 We see that the most environmentally friendly scenarios, result in temperature rises of between 1.8C (3.2F) and 2.4C (4.3F) over the next century, while the fossil fuel scenario gives a rise of 4.0C (7.2F) with a large uncertainty. Note that the projections for sea level rise don t include melting ice. Lecture #18-25