Field Methods to Distinguish Between Vapor Intrusion and Indoor Sources of VOCs
|
|
|
- Maximilian Clark
- 5 years ago
- Views:
Transcription


1 Air Exchange SITE BUILDING source area Field Methods to Distinguish Between Vapor Intrusion and Indoor Sources of VOCs Thomas E. McHugh, PhD., D.A.B.T. Kyle Gorder, M.S Erik Dettenmaier, PhD 2012 DoD EMDQ Workshop
2 Report Documentation Page Form Approved OMB No Public reporting burden for the collection of information is estimated to average 1 hour per response, including the time for reviewing instructions, searching existing data sources, gathering and maintaining the data needed, and completing and reviewing the collection of information. Send comments regarding this burden estimate or any other aspect of this collection of information, including suggestions for reducing this burden, to Washington Headquarters Services, Directorate for Information Operations and Reports, 1215 Jefferson Davis Highway, Suite 1204, Arlington VA Respondents should be aware that notwithstanding any other provision of law, no person shall be subject to a penalty for failing to comply with a collection of information if it does not display a currently valid OMB control number. 1. REPORT DATE MAR REPORT TYPE 3. DATES COVERED to TITLE AND SUBTITLE Field Methods to Distinguish Between Vapor Intrusion and Indoor Sources of VOCs 5a. CONTRACT NUMBER 5b. GRANT NUMBER 5c. PROGRAM ELEMENT NUMBER 6. AUTHOR(S) 5d. PROJECT NUMBER 5e. TASK NUMBER 5f. WORK UNIT NUMBER 7. PERFORMING ORGANIZATION NAME(S) AND ADDRESS(ES) Environmental Security Technology Certification Program (ESTCP),4800 Mark Center Drive, Suite 17D08,Alexandria,VA, PERFORMING ORGANIZATION REPORT NUMBER 9. SPONSORING/MONITORING AGENCY NAME(S) AND ADDRESS(ES) 10. SPONSOR/MONITOR S ACRONYM(S) 12. DISTRIBUTION/AVAILABILITY STATEMENT Approved for public release; distribution unlimited 11. SPONSOR/MONITOR S REPORT NUMBER(S) 13. SUPPLEMENTARY NOTES Presented at the 9th Annual DoD Environmental Monitoring and Data Quality (EDMQ) Workshop Held March 2012 in La Jolla, CA. 14. ABSTRACT 15. SUBJECT TERMS 16. SECURITY CLASSIFICATION OF: 17. LIMITATION OF ABSTRACT a. REPORT unclassified b. ABSTRACT unclassified c. THIS PAGE unclassified Same as Report (SAR) 18. NUMBER OF PAGES 49 19a. NAME OF RESPONSIBLE PERSON Standard Form 298 (Rev. 8-98) Prescribed by ANSI Std Z39-18
3 Vapor Intrusion: Field Methods Significance of Background VOC Sources Stable Isotope Analysis On-Site GC/MS Analysis Air Exchange SITE BUILDING source area 2
4 Vapor Intrusion: Field Methods Significance of Background VOC Sources Stable Isotope Analysis On-Site GC/MS Analysis Air Exchange SITE BUILDING source area 3

5 Significance of Background Sources Source of Background Indoor Air Impacts Key Sources of VOCs in Indoor Air: Ambient air Vehicles, gasoline Paints, adhesives Cleaning agents Insecticides Tobacco smoke Cosmetics, etc. REFERENCES: USEPA, 1991, Building Air Quality Guide OSHA, 1999, Tech Manual for Indoor Air Inv. 4

6 Significance of Background Sources Source of Background Indoor Air Impacts Key Sources of VOCs in Indoor Air: Ambient air Vehicles, gasoline Paints, adhesives Cleaning agents Insecticides Tobacco smoke Cosmetics, etc. REFERENCES: USEPA, 1991, Building Air Quality Guide OSHA, 1999, Tech Manual for Indoor Air Inv. 5


7 Significance of Background Sources Background Sources of Indoor Air Impacts Sources of VOCs in Indoor Air 6


8 Significance of Background Sources Background Sources of Indoor Air Impacts Sources of VOCs in Indoor Air 7


9 Significance of Background Sources Background Sources of Indoor Air Impacts Sources of VOCs in Indoor Air 8
10 But We Don t Use TOXIC Chemicals Anymore bulletin from vendor, October 2010: Technical Update Topics, trends, and news in the environmental industry TCE Contamination Affects Community's Water Wells The TCE, which was banned from public use in the 1970s, was detected at levels greater than the U.S. EPA's maximum contaminant level for public drinking water. KEY POINT: Many people believe that TCE and other chlorinated solvents are no longer used in industrial operations or consumer products. 9


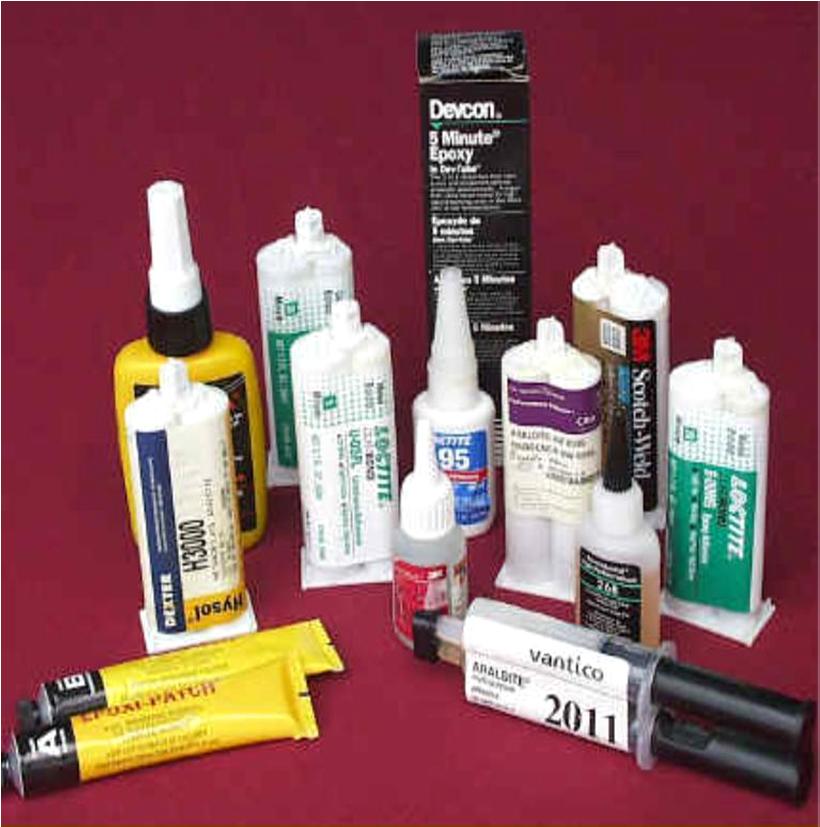
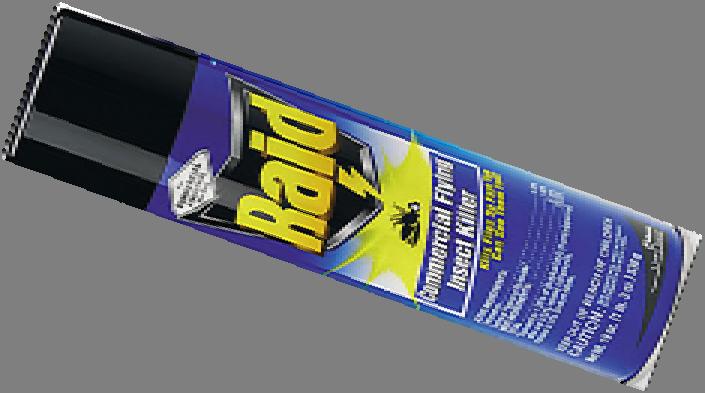
11 Significance of Background Sources Examples of Indoor Sources: CVOCs Gun Cleaner: $19.95 >90% TCE Pepper Spray: $3.99 >90% TCE Hobby Glue: $4.95 >90% PCE Plastic Ornament: $4.95 1,2-DCA KEY POINT: Chlorinated VOCs are legal and are still used in a wide variety of consumer products currently available for purchase. 10
12 Significance of Background Sources Importance of Background VOCs Bkgrd Air Clean GW Range of Reported Background Concentration (µg/m 3 ) BENZENE Ambient 1 90 th % Median 10 th % Indoor 1 90 th % Median 10 th % INDOOR AIR LIMIT PCE Ambient 1 90 th % Median 10 th % Indoor 1 90 th % Median 10 th % INDOOR LIMIT KEY POINT: Background sources of VOCs are ubiquitous in indoor and ambient air, commonly at concentrations exceeding risk-based limits for indoor air. 1) Background concentrations from Sexton et al ES&T 38(2); ) Indoor air limits from USEPA Master Screening Values Table, September

13 Vapor Intrusion Investigations: Advanced Methods GOAL METHODS Identify source of indoor air VOCs quickly and economically, without need for multiple sampling episodes. Isotopic Analyses to distinguish among various sources of VOCs On-Site Vapor Analyses using portable GC-MS Building Pressure Control ensure that VI is turned on 12
14 Vapor Intrusion: Field Methods Significance of Background VOC Sources Stable Isotope Analysis On-Site GC/MS Analysis Air Exchange SITE BUILDING source area 13
15 Vapor Intrusion: Field Methods Significance of Background Sources Stable Isotope Analysis Application to Vapor Intrusion Method Validation Field Application On-Site GC/MS Analysis Air Exchange SITE BUILDING source area 14
16 TECHNOLOGY DESCRIPTION What are Stable Isotopes? p e - p e - n p e- n n Hydrogen, 1 H Deuterium, 2 H, D Tritium, 3 H, T Isotopes have the same number of protons identical atomic number Isotopes have different number of neutrons different atomic mass Stable isotopes do not undergo radioactive decay tritium is not a stable isotope 15
17 ISOTOPE RATIOS: INDOOR SOURCES Chlorine Ratio Indoor Sources Carbon Ratio
18 CHANGES IN THE SUBSURFACE Stable Isotope Fractionation Kinetic Effect: Biodegradation causes enrichment in PCE containing 13C Cl Cl Cl C 12 C 12 Cl Cl Cl C 12 Cl X C 13 Cl Biodegradatio n of PCE: 12 C Cl bond easier to break than 13 C Cl bond. Key Point: Differences in isotope ratios between samples can indicate different sources: indoor vs. subsurface. 17
19 Compound-Specific Stable Isotope Analysis, (C, Cl) SOURCE CSIA: Fingerprinting method to distinguish between vapor intrusion and indoor sources Applicable to sites where biodegradation of subsurface VOCs has occurred, causing an isotope shift for subsurface source vs. indoor source. CSIA = Compound-Specific Stale Isotope Analysis EXAMPLE A: δ 13 C vs. δ 17 Cl Primary Source of Indoor PCE: Indoor Source δ 37 Cl δ 13 C Indoor Air Subsurface Source Range for indoor sources
20 Compound-Specific Stable Isotope Analysis, (C, Cl) SOURCE CSIA: Fingerprinting method to distinguish between vapor intrusion and indoor sources Applicable to sites where biodegradation of subsurface VOCs has occurred, causing an isotope shift for subsurface source vs. indoor source. CSIA = Compound-Specific Stale Isotope Analysis EXAMPLE A: δ 13 C vs. δ 17 Cl Primary Source of Indoor PCE: Subsurface Source δ 37 Cl δ 13 C Indoor Air Subsurface Source Range for indoor sources
21 CSIA Example Results: Indoor Air vs. Subsurface Vapor C 12 / C 13 Ratios Carbon Isotope Ratio ( ) Residence 1: TCE KEY FINDINGS: TCE in indoor air matches TCE in groundwater TCE is too heavy to be an indoor source Vapor intrusion is occurring -35 Range for Consumer Products Indoor Air Residence 1 Groundwater Near Residence 1 max min
22 CSIA Example Results: C 12 / C 13 and Cl 35 / Cl 37 Ratios FINDING: PCE in indoor air is from indoor source.


23 CSIA Example Results: C 12 / C 13 and Cl 35 / Cl 37 Ratios FINDING: PCE in indoor air is from indoor source. (E6000 glue.)
24 Vapor Intrusion: Field Methods Significance of Background Sources Stable Isotope Analysis Application to Vapor Intrusion Method Validation Field Application On-Site GC/MS Analysis Air Exchange SITE BUILDING source area 23


25 METHOD VALIDATION: SORBENT TUBE SAMPLERS Results from Laboratory Validation Study Adsorbent Tubes Air Sampling Pump Sorbent: Fractionation free performance from Carboxen 1016 Sampling Conditions: Validated for wide range of humidity, sample volume, sample mass, and non-target VOC mass Target VOCs: Validated for PCE, TCE, and benzene Report on Laboratory Method Validation: Kuder et al., 2012 (To be posted at
26 METHOD VALIDATION: APPLICATION TO VAPOR INTRUSION SITE Five residences over chlorinated solvent Site Sampling Program plume with TCE or PCE detected in indoor air Near Hill AFB, Utah One indoor air sample from each residence One to four groundwater or soil gas samples from near-by sample points Results Confirmed Vapor Intrusion: Two residences Confirmed Indoor Sources: Two residences Not Conclusive: One residences Paper on Application of CSIA to Vapor Intrusion: McHugh et al., 2011 Env. Sci. Technol. Vol. 45(14) pp
27 Vapor Intrusion: Field Methods Significance of Background Sources Stable Isotope Analysis Application to Vapor Intrusion Method Validation Field Application On-Site GC/MS Analysis Air Exchange SITE BUILDING source area 26
28 CSIA FOR VI: FIELD APPLICATION Step 1A: Characterize Isotope Ratios for Subsurface Source. Groundwater OR Soil Gas Conduct CSIA on groundwater sample from existing monitoring well Conduct CSIA on soil gas sample <100 ug/m 3 = sorbent tube 100 to 500 ug/m 3 = 6L Summa > 500 ug/m 3 = 1L Summa Chlorine Ratio Indoor Sources Carbon Ratio? KEY POINT: Can collect subsurface sample from existing sample point. 27
29 CSIA FOR VI: FIELD APPLICATION Step 1B: Compare Isotope Ratios for Subsurface Source to Measured Range for Indoor Sources Chlorine Ratio SS Chlorine Ratio SS Carbon Ratio Carbon Ratio Subsurface source NOT enriched in heavy isotopes: CSIA not likely to distinguish between indoor and subsurface sources. Subsurface source IS enriched in heavy isotopes: CSIA applicable to vapor intrusion. 28

30 CSIA FOR VI: FIELD APPLICATION Step 2: Collect indoor air samples for CSIA. Compare results to indoor source range and site-specific subsurface source. Range for indoor sources 29
31 Vapor Intrusion: Field Methods Significance of Background Sources Stable Isotope Analysis On-Site GC/MS Analysis Air Exchange SITE BUILDING source area 30
32 Vapor Intrusion: Field Methods Significance of Background Sources Stable Isotope Analysis On-Site GC/MS Analysis Overview Investigation Protocol Data Quality Considerations Air Exchange SITE BUILDING source area 31
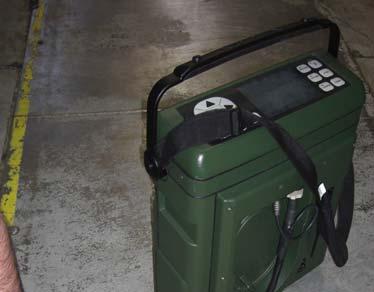
33 On-Site Vapor Analysis What? When? On-site analysis (with low detection limits) Initial results guide collection of additional samples Rapid identification of source(s) of VOCs in indoor air: Time/building access is limited Building with complex indoor sources High concern from building occupants Prior analyses are not definitive TCE Toluene PCE CTCL On-Site Analysis HAPSITE Instrument Results in Field 01:30 02:00 02:30 03:00 32

34 On-Site Vapor Analysis Options Option Performance HAPSITE Portable GC/MS ($3-5K/day) Mobile Lab GC/MS (>$5K/day) 0.2 ppbv detection limit for grab samples Less sensitive in survey model (i.e., continuous reading) 1 to 10 ppbv detection limit for grab samples Need alternate instrument for survey HAPSITE ADVANTAGES: - Does both survey and analytical modes - Compound-specific real-time survey - Portable w/ on-site data management - Less expensive than mobile lab 33

35 Instrumentation Inficon HAPSITE GC/MS Key features: Custom Methods (~6 min) sample turn time Clean chromatograms Target VOCs in SIM mode Positive identification Full scan using NIST library Low quantitation limits Chlorinated aliphatics in ppt 34
36 Vapor Intrusion: Field Methods Significance of Background Sources Stable Isotope Analysis On-Site GC/MS Analysis Overview Investigation Protocol Data Quality Considerations Air Exchange SITE BUILDING source area 35


37 ON-SITE ANALYSIS FOR VI INVESTIGATION PROTOCOL Project planning Instrument operation, calibration, QA/QC Building operating conditions Step-by-step sampling program (see flow chart) Data interpretation KEY POINT: Comprehensive written protocol for application of on-site analysis approach.
 2) Area by Area")

38 Investigation Protocol 1) Outdoor Air (Background) 2) Area by Area Sampling ??? Dissolved PCE in Shallow Groundwater 37
 Room")

39 Investigation Protocol 3) Room by Room Sampling
40 Investigation Protocol 4) Interior Source Identification Ion Intensity Around Closed Drawers Around Closed Drawers Around Closed Drawers E6000 Industrial Strength Adhesive Around Closed Drawers Inside Top Drawer E6000 Adhesive Top Drawer (Closed) Top Drawer (Closed) 0 14:00 16:00 18:00 20:00 22:00 24:00
41 Investigation Protocol 5) Interior Source Evaluation and Removal KEY QUESTION: Is emission rate from identified source sufficient to account for VOC concentration in indoor air.
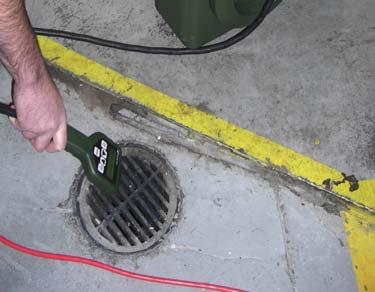
42 Investigation Protocol 6) Vapor Entry Point Identification

43 Investigation Protocol 7) Confirmation Sampling KEY POINT: Samples for off-site analysis collected only after indoor sources have been identified and removed.
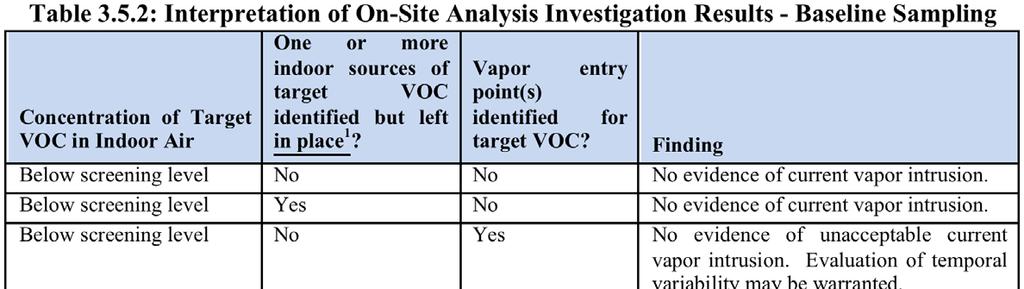
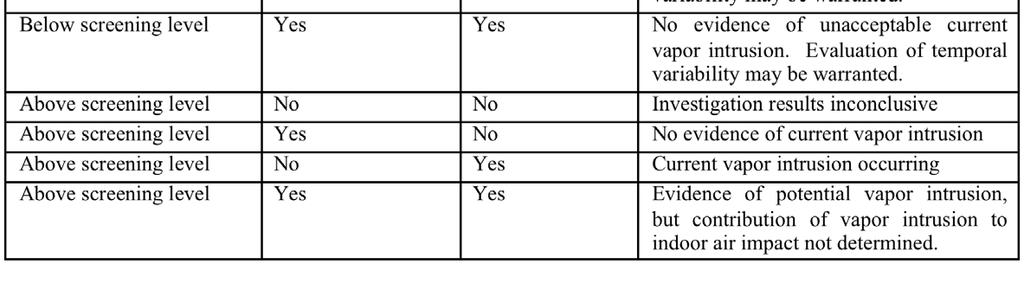
44 Investigation Protocol 8) Data Interpretation
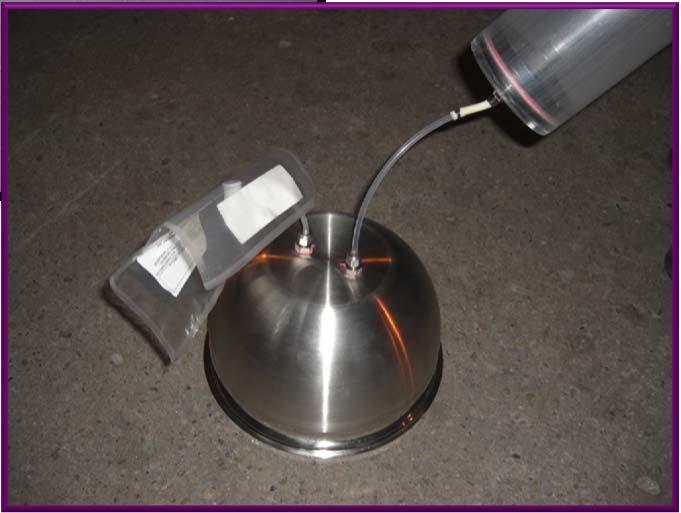
45 Optional Building Pressure Control: Address Temporal Variability & Indoor Sources General Concept: 1) Use controlled NEGATIVE pressure to TURN ON vapor intrusion 2) Evaluate potential for vapor intrusion using on-site analysis procedure NEGATIVE Pressure in Building = VI On POSITIVE Pressure in Building = VI Off


46 Optional Building Pressure Control: Mixed VI and Indoor Sources Industrial Building Housing NAPL Recovery System TCE in Indoor Air: Baseline: 440 ug/m 3 Positive Pressure: 38 ug/m 3 Negative Pressure: 404 ug/m 3 Key Point: Pressure control showed that VI was primary source of TCE in indoor air.
47 PRELIMINARY COST ASSESSMENT COST OF VI INVESTIGATION (PER SMALL BUILDING) On-site Analysis Method Traditional Method 1/2 day with HAPSITE (10-20 analyses) 2 Confirmation Summa Samples Planning, reporting, etc. Cost = $7,900/building Summa samples: 3 indoor, 1 outdoor, 3 sub-slab Planning, reporting, etc. Cost = $6,900/building Key Point: Costs are similar. Results from on-site analysis expected to be more definitive. Both cost estimates assume local consultant, multiple buildings included in investigation 46
48 Vapor Intrusion: Field Methods Significance of Background Sources Stable Isotope Analysis On-Site GC/MS Analysis Overview Investigation Protocol Data Quality Considerations Air Exchange SITE BUILDING source area 47

49 DATA QUALITY CONSIDERATIONS Data Quality Procedures 5-points calibration: daily to weekly Calibration checks: 2x per day Field duplicates Instrument blanks Data Quality Objectives DQO Goal Typical Accuracy RPD <100% RPD < 67% Precision RPD < 30% RDP < 10% Sensitivity <5 ug/m to 1 ug/m 3 Key Point: DQOs are not the same as fixed lab, but data quality is known and documented

50 Wrap-Up: VI Investigations Multiple Sources: VI investigations are challenging due to numerous potential sources of indoor air impacts. VOC Source Problems with Conventional Approach: Use of limited measurements can lead to false conclusions re: vapor intrusion. Advanced Methods: On-site analyses and other advanced methods can identify source of VOCs in quickly (< 1 day) and economically. Advanced Method