Aalborg Universitet. Publication date: Document Version Early version, also known as pre-print. Link to publication from Aalborg University
|
|
|
- Daniel McDaniel
- 5 years ago
- Views:
Transcription
1 Aalborg Universitet Heat Roadmap Europe 2 Connolly, David; Mathiesen, Brian Vad; Østergaard, Poul Alberg; Møller, Bernd; Nielsen, Steffen; Lund, Henrik; Persson, Urban; Werner, Sven; Grözinger, Jan; Boermans, Thomas; Bosquet, Michelle; Trier, Daniel Publication date: 2013 Document Version Early version, also known as pre-print Link to publication from Aalborg University Citation for published version (APA): Connolly, D., Mathiesen, B. V., Østergaard, P. A., Möller, B., Nielsen, S., Lund, H.,... Trier, D. (2013). Heat Roadmap Europe 2: Second Pre-Study for the EU27. Department of Development and Planning, Aalborg University. General rights Copyright and moral rights for the publications made accessible in the public portal are retained by the authors and/or other copyright owners and it is a condition of accessing publications that users recognise and abide by the legal requirements associated with these rights.? Users may download and print one copy of any publication from the public portal for the purpose of private study or research.? You may not further distribute the material or use it for any profit-making activity or commercial gain? You may freely distribute the URL identifying the publication in the public portal? Take down policy If you believe that this document breaches copyright please contact us at vbn@aub.aau.dk providing details, and we will remove access to the work immediately and investigate your claim. Downloaded from vbn.aau.dk on: december 30, 2018


2 HEAT ROADMAP EUROPE 2050 SECOND PRE-STUDY FOR THE EU27 By Aalborg University David Connolly Brian Vad Mathiesen Poul Alberg Østergaard Bernd Möller Steffen Nielsen Henrik Lund Halmstad University Urban Persson Sven Werner For Ecofys Germany GmbH Jan Grözinger Thomas Boermans Michelle Bosquet PlanEnergi Daniel Trier
3 Publisher: Department of Development and Planning Aalborg University Vestre Havnepromenade Aalborg Denmark May, 2013 ISBN: The Authors 2
4 ACKNOWLEDGEMENT The work presented in this report is partly as a result of the research activities of the Strategic Research Centre for 4 th Generation District Heating (4DH), which has received funding from The Danish Council for Strategic Research ( Since this is a pre-study, some key assumptions were necessary due to the limited time and resources available to investigate a pan-european energy system. However, this pre-study outlines the previously unconsidered potential of district heating and cooling in the EU, while also highlighting the need for new tools, data, and methodologies to analyse the specific requirements of district heating and cooling as technologies. The authors intend to continue developing these in the future. 3
5 FOREWORD ENHANCED ENERGY EFFICIENCY: FASTER DECARBONISATION, CHEAPER COMFORT, BETTER ENERGY - THE CHALLENGE In 2009 the European Council committed the European Union to decarbonize its energy system to at least 80% below 1990 levels by As heat demands dominate end-use, decarbonizing the European energy system requires special attention to these sectors which given their importance for health and wellbeing also have a very strong social dimension. The challenge is for the heat market to contribute to the decarbonisation goal in a manner which allows keeping the cost of energy in general - and of comfort in particular - affordable. A wide range of renewable and energy-efficient technologies are readily available already today to replace the two thirds of the heat market which today are covered by fossil fuels. These are outlined in various reports and studies, i.e. in the Energy Efficiency of the Energy Roadmap 2050 published by the European Commission in Why another study? Basically all existing studies exploring the road to a decarbonized energy supply in 2050 model generic solutions without investigating the possibilities and limits of their implementation in practice in an urban environment. Yet, future solutions must in the first instance be urban solutions. Forecasts indicate that 75% of the European citizens will live in urban areas in 2020 and that this share will increase to 84% by This means that the local character of heating and cooling markets both with regard to supply and demand must be taken into account when identifying concrete pathways to a low-carbon future. For example, a compact urban environment can compromise the desired use of natural lightning, ventilation and decentralized use of solar energy. Higher densities also limit the potential of ground-source heat pumps (and hence of electrifying heating and cooling as one of the options which is currently modelled in most reports). A compact urban environment also limits possibilities to accelerate the deep refurbishment rate of buildings due to space limitations, noise disturbances, social acceptance and relocation needs during construction work. Yet, the assumptions in the Energy Efficiency Scenario (EE- EU) of the Energy Roadmap are over-ambitious as regards the reduction of final heat demands in buildings (72% reduction of the specific heat demands), exceeding even what is considered feasible in recent reports of the European insulation manufacturing industry 2, and hence are assumed to be extremely costly. 1 European Commission, 2011: Energy Roadmap Available from 2 Boermans T., Bettgenhäuser K, Offermann M, Schimschar S. Renovation Tracks for Europe up to 2050: Building renovation in Europe what are the choices? Ecofys,
6 THE OPPORTUNITIES On the positive side, the local and urban dimensions of energy provide opportunities which usually are overlooked in studies as they often are not properly reflected in statistics and models. Heat Roadmap Europe is the first study on EU27 scale which combines geographical mapping of energy demand and supply in unprecedented detail with comprehensive energy system modelling (incl. hour-by-hour analysis). It identifies the potential for using local resources across Europe, and subsequently applies this in the EU27 energy system. The study takes the EU-EE scenario as starting point, refining and complementing it with local heat market information. As a result and beyond theoretical potentials, the new Heat Roadmap Europe Energy Efficiency scenario (HRE-EE) shows a pathway that can realistically be implemented and allows leveraging additional benefits. THE BENEFITS CHEAPER COMFORT Rising energy prices and fuel poverty are a major concern for all European governments. The study shows that ambitious targets can be achieved while keeping comfort affordable and without compromising on quality of life and health. While being ambitious to the limit of what can realistically be deemed feasible in terms of future reduction of space heat demands, additional cost savings identified by refining the EU-EE amount to at least EUR 100 billion/year and up to EUR 146 billion/year due to a reduction of the costs for the total heating and cooling supply for buildings in the range of 15 to 22%. These savings benefit all European citizens from the most vulnerable customer to businesses and ultimately Europe s competitiveness on the World market. FASTER DECARBONISATION Redesigning the heating and cooling supply as proposed in the study provides a fast-track solution to overcoming the constraints of compact urban environments and bringing renewable energies into cities. It enables the efficient use of combined heat and power, biomass, solar thermal, large-scale heat pumps, individual heat pumps, geothermal energy, as well as heat from waste incineration and excess heat from industry. At the same time, the HRE-EE scenario introduces additional flexibility to the EU-EE scenario that facilitates the integration of more wind and photovoltaic power in the electricity sector. BETTER ENERGY Energy autonomy ranks evenly high on the EU s energy agenda as competitiveness and decarbonisation. The HRE-EE scenario creates a more diverse energy supply than any other EU scenario and improves the security of supply. Using local renewable sources instead of imported fossil fuels does not only serve the environment but also creates welfare and jobs 5
7 within smart communities in Europe. The HRE-EE scenario uses no-regrets technologies that ensure flexibility and help avoiding lock-in effects. This reduces risks and adverse effects if heat savings in buildings do not have the expected effect due to lack of implementation (i.e. due to technical limitations or increasing costs) and creates robustness against fluctuating or increasing fuel prices, including of renewable energy sources. THE TOOL Based on their analysis, the authors of this study consider that while lowering energy consumption in buildings is essential, it must be combined with a robust strategy for a future heat and cooling supply in the European Union. As the results show, re-designing the heat and cooling supply in Europe will contribute to making any chosen decarbonisation path more robust and affordable. This means that any decarbonisation strategy for the energy sector as a whole should integrate a clear strategy for addressing energy efficiency and renewable energy use in heating and cooling. A strategy embracing a district or community dimension and targeting the reduction of fossil primary energy provides substantial benefits as outlined above. Given the urban dimension of the challenges and the resulting constraints, increasing the market penetration of heating and cooling networks to 30% by 2030 and to 50% by 2050 in combination with the use of local sustainable resources (renewable energies and recycled heat) can be considered as an essential element in achieving the ambitious goals of cheaper comfort, faster decarbonisation and better energy. 27 th May 2013 Frederic Hug President Euroheat & Power 6

8 EXECUTIVE SUMMARY Heat Roadmap Europe 3 is the first study on the EU27 scale which combines geographical mapping of energy demand and supply in unprecedented detail with detailed energy system modelling. Heat Roadmap Europe identifies the potential for using local resources across Europe, and subsequently applies this in the EU27 energy system. The results are recommendations for a redesign of the European heat supply. In 2009 the European Council made the objective for the EU to decarbonise its energy system to at least 80% below the 1990 level by 2050, without affecting general economic growth. A number of measures and technologies could contribute to these goals. A scenario which achieves these goals is the Energy Efficiency scenario in the Energy Roadmap 2050 report 4 by the European Commission. The Heat Roadmap Europe scenario proposed here achieves these same CO 2 reduction, but at a lower cost. Lowering the energy consumption in buildings is essential. However here we combine heat savings in the buildings with higher energy efficiency by expanding district heating in the future heat supply in the EU27. Local conditions are considered using geographical information systems (GIS) and combined with hour-by-hour energy system analyses for the EU27, which enables us to find a robust strategy to increase competitiveness, integrate more renewables and reduce the risks in the energy supply. By analysing heat savings and energy efficiency, by investigating local conditions, and by making energy system analyses we are able to identify a balance between heat savings and key infrastructural changes in the energy supply. The findings in the Heat Roadmap Europe can be summarised into three key messages (see Figure 1). 1. Cheaper Comfort Annual savings of B 100/year while still achieving decarbonisation 15% lower total heating and cooling costs Lower costs of the EU27 energy supply for citizens and businesses 220,000 more jobs per year than in business as-usual scenario in the energy sector 2. Faster Decarbonisation Infrastructure that ensures efficient use of renewable heat and electricity Recycling of heat otherwise wasted and an increased penetration of renewable energy Large heat savings and new more efficient energy conversion Supports the general goals in the Energy Efficiency scenario from the EU commission 3. Better Energy Increases the security of supply with local ressources and renewable energy Creating a flexible infrastructure Enhanced energy efficiency with a balanced choise of technologies Reducing risks and the adverse effects of technology lock-ins Figure 1: Three key messages from Heat Roadmap Europe. 3 Heat Roadmap Europe refers to the Heat Roadmap Europe report from 2012 (First pre-study for the EU27) and this report. 4 European Commission. Energy Roadmap European Commission, Available from: 7
9 Cheaper Comfort First of all we are able to Increase the economic competitiveness of the EU27. In Heat Roadmap Europe we have compared our results both to the current energy supply as well as to the implementation of the European Commission s Energy Efficiency scenario (EU-EE). By refining the EU- EE scenario, we are able to decarbonise to the same level while saving B 100/year, corresponding to 15% lower costs for the total heating and cooling supply for buildings. We achieve this by proposing an enhanced energy efficiency scenario (HRE-EE), which has significant heat demand reductions, combined with lower heat losses and more renewable energy in the energy supply. This ensures that the cost burden on European citizens and businesses is comparably lower with Heat Roadmap Europe, which enables stronger economic development in the EU and provides a more competitive business environment. Faster Decarbonisation Secondly Heat Roadmap Europe creates a Pathway for heat recycling and more renewable energy, by ensuring that we can increase the penetration of renewable energy in both the heat sector and the electricity sector. In HRE-EE we re-design the heat supply in the EU27 by quantifying the benefits of using individual heat pumps and district heating, in combination with energy savings and renewable energy. Currently about half of the primary energy in the EU27 is lost in the conversion from the primary energy supply to the end use. District heating makes it possible to recycle heat that would otherwise be wasted. The new infrastructure and redesign of the heating and cooling supply presented here enables the efficient use of heat from combined heat and power, solar thermal, large-scale heat pumps, individual heat pumps and many other sources such as geothermal, waste incineration and excess heat from industry. The scenarios introduce flexibility that facilitates the integration of more wind and photovoltaic power in the electricity sector compared to the EU-EE scenario. The HRE-EE scenario includes large savings in the heat demand in buildings. Heat savings in combination with an efficient energy supply system creates a scenario that supports the goals of the European Commission. Better Energy Reducing risks for the EU27 is a third key message from Heat Roadmap Europe. The infrastructure proposed creates a more diverse energy supply and improves the EU s security of supply by using resources within the EU and increasing the share of renewable energy. The HRE-EE scenarios use technologies that ensure flexibility in the energy supply which reduce the risk of lock-in effects in Europe. This reduces risks and adverse effects if 1) heat savings in buildings do not have the expected effect due to a lack of implementation, which could occur due to technical limitations or increasing costs, 2) fluctuating or increasing fuel prices, or 3) the cost of some renewable energy sources increases. In Heat Roadmap Europe we suggest a more robust strategy, with a diversified supply and an enhanced energy efficiency scenario that balances heat savings and efficient energy conversion. 8
10 COMBINING HEAT SAVINGS WITH A NEW HEAT SUPPLY The results in the HRE-EE scenario are based on thorough analyses of the heat savings feasible in the EU27 and the mapping of local conditions all over the EU27. The space heating demands in the HRE-EE scenario are reduced by as much as 47% compared to today. This is extremely ambitious and in accordance with the most ambitious deep renovation heat saving scenario in the Eurima study 5 from On the supply side, the market penetration of district heating is increased in the HRE-EE scenario based on existing and forecasted heat demands in the EU27. These have been profiled using the first ever pan-eu Heat Atlas, which was developed in this study (see Figure 2). Based on this data, the share of district heating for space heating and hot water supply in 2050 is set at 50% in the year Similar maps have been created to establish how to supply the heat for these new district heating systems from resources such as thermal power plants, solar thermal, geothermal, and industry. The resolution utilised in these maps ensures that the local conditions in the EU27 are considered in the macro modelling also carried out in this study. Figure 2: New European Heat Atlas developed in this study. 5 Boermans T, Bettgenhäuser K, Offermann M, Schimschar S. Renovation Tracks for Europe up to 2050: Building renovation in Europe - what are the choices? Ecofys, Available from: 9
11 QUANTIFYING THE IMPACT OF THE NEW HEAT SUPPLY To quantify the impacts of the HRE-EE scenario, the resulting primary energy supply and the CO 2 emissions are compared to those in the original EU-EE scenario from the European Commission, using hour-by-hour modelling in the energy-systems-analysis tool EnergyPLAN. The fossil fuel and biomass consumption in both scenarios is the same for the years 2030 and 2050, though the primary energy supply is marginally larger in the HRE-EE scenario (~2%). As a result, the carbon dioxide emissions in both scenarios are also the same, but the Heat Roadmap Europe scenarios are significantly cheaper (see Figure 3). The slightly larger primary energy supply in the HRE-EE scenario is due to the additional resources utilised in the district heating network such as waste incineration, geothermal, and largescale solar thermal. If district heating is not included in the EU energy system, these resources will be wasted. The HRE-EE scenario also utilises approximately 5% more wind power than the EU-EE scenario due to the additional flexibility introduced into the system by integrating the electricity and heat sectors. 18,000 Nuclear Coal Oil Gas Biomass Waste RES 3,000 Primary Energy Supply (TWh/year) 15,000 12,000 9,000 6,000 3,000 2,500 2,000 1,500 1, Carbon Dioxide Emissions (X, Mt/year) 0 EU-EE HRE-EE EU-EE HRE-EE Figure 3: Primary energy supply and carbon dioxide emissions in the Energy Efficiency (EU-EE) and Heat Roadmap Europe (HRE-EE) scenarios for the years 2030 and The HRE-EE scenario has a higher heat demand than the EU-EE scenario, due to the very high costs required to reduce the heat demand in buildings by more than the ~50%. As a result, the HRE-EE scenario proposed here also has lower investment costs in building refurbishments to reduce the heat demand than the EU-EE scenario (see Energy Efficiency Investments in Figure 4). Some of these savings are invested in redesigning the heating sector in the HRE-EE scenario by increasing the share of district heating and cooling and using larger individual boilers. However, these additional costs are 10
12 offset by the reduced investments on building side, so the total cost of heating and cooling for buildings in the HRE-EE scenario is ~15% lower. To put this in context, the overall energy costs for the EU energy system are reduced by approximately 7-8%. Furthermore, a sensitivity analysis in this study indicates that this is a conservative estimate: the total heating and cooling costs are more likely to be approximately 22%, since the costs assumed here for heat savings in the buildings could be significantly higher while the district heating distribution costs could be lower. Total Costs for Heating and Cooling in the Residential and Services Sectors (B /year) End-Use Energy Efficiency Investments Heating System Investments Cooling System Investments Centralised Electricity & Heat Plants Fuel CO EU-EE HRE-EE EU-EE HRE-EE Figure 4: Total annual costs for heating and cooling in the residential and services sectors for the Energy Efficiency (EU-EE) and Heat Roadmap Europe 2 (HRE-EE) scenarios in the years 2030 and DISTRICT HEATING IN URBAN AREAS IS ALSO CHEAPER THAN INDIVIDUAL HEAT PUMPS The EU27 analysis in this study is also supported here by a more specific local case study, based on the city of Aarhus in Denmark. Using the case study it is possible to determine more specific costs and demands when comparing alternative heat strategies. Similar to the results already discussed on an EU27 scale, the case study reveals that heat savings and district heating together can provide an efficient and cost-effective heat supply for buildings. An additional comparison between district heating and individual heat pumps is also completed here using the case study. The results show that district heating is also a cheaper solution than individual heat pumps in urban areas (see Figure 5). This is particularly due to two reasons: firstly, it is the very large investment costs for installing an individual heat pump in each building compared to sharing thermal capacity in a centralised plant with district heating and secondly, it is the larger investment in residual power plants to supply electricity for the heat pumps. The conclusions are also valid when demands are decreased, although the individual heat pump scenarios become more competitive with very low demands, because this results in a lower need for production capacity. 11
13 Annual Costs (M /year) Fuel costs O&M Investment 50 0 District Heating Individual Heat Pumps District Heating Individual Heat Pumps Reference 55% Heat Reduction 77% Heat Reduction Figure 5: Annualised costs for all scenarios considered in the Aarhus case study. FEWER HEAT SAVINGS STILL REQUIRES A NEW HEAT SUPPLY Another scenario in the Energy Roadmap 2050 report4 by the European Commission describes a situation where none of the current policy initiatives in the EU are changed (EU-CPI scenario). EU-CPI contains very little combined heat and power and district heating systems using excess heat. In the first pre-study of Heat Roadmap Europe [1], we have also redesigned the heat supply in the EU- CPI scenario, to create a new HRE-CPI scenario. This highlights the benefits of a different heat supply that can recycle heat, even if fewer heat savings are achieved than expected in both the EU-EE and the HRE-EE scenarios. In HRE-CPI, the expansion of district heating could decrease the European primary energy supply, decrease fossil fuel consumption, and lower the CO 2 emissions while still supplying exactly the same energy services as in EU-CPI (see Figure 6). 12
 Figure 6, Primary energy supply and carbon dioxide emissions in the EU-CPI and HRE-CPI scenarios for the years 2030 and 2050.")
14 Primary Energy Supply (TWh/year) 20,000 18,000 16,000 14,000 12,000 10,000 8,000 6,000 4,000 2,000 0 Nuclear Coal Oil Natural gas Biomass & Waste RES EU-CPI HRE-CPI EU-CPI HRE-CPI ,500 3,000 2,500 2,000 1,500 1, Carbon Dioxide Emissions (X, Mt/year) Figure 6, Primary energy supply and carbon dioxide emissions in the EU-CPI and HRE-CPI scenarios for the years 2030 and More district heating in Europe will reduce the energy system costs considerably since local heat recycling and renewable energy will replace expensive energy imports compared to EU-CPI. The reduced energy import will increase the future security of supply and give a more positive balance of foreign exchange. At the same time as reducing the costs of energy, more district heating will generate local labourintensive investments. For HRE-CPI a first rough estimate of job creation indicates that around 8-9 million man-years will be created, which equals approximately 220,000 new jobs on average over the 38 year period from 2013 to 2050, due to investments in heat recycling, renewable energy supply, and extended and new district heating grids. It should be noted that these jobs are additional to the jobs in the EU-CPI 2050 scenario. In neither the EU-CPI nor the HRE-CPI scenarios are the decarbonisation goals achieved. It should be emphasized that 220,000 jobs is a rough estimate of the minimum number of work places being created and the 220,000 jobs arise from purely the additional investments. The real number will be higher due to the following: Multiplier effects of the jobs created are not included. Additional jobs are not included to account for the fact that when the energy costs of Europe decrease, European industry will become more competitive. Additional jobs from industrial innovation due to the investments in new energy technologies are not included. When comparing the jobs in EU-EE and HRE-EE in which the goals are achieved, HRE-EE would create fewer jobs in the energy sector, as we have created a cheaper alternative. However with HRE-EE the costs for EU citizens and businesses will be lower: this reduces the cost burden with regard to the energy supply, creating better 13
15 competitiveness while still achieving decarbonisation also in a situation where heat savings are not achieved due to practical or political implementation difficulties. Key technologies for the new heat supply in HRE-EE 2050 Heat savings equal to the most ambitious deep renovation space-heating scenario in the Eurima 3 study from The total heat demand in buildings is reduced by 34% between 2010 and Expansion of district heating from the present level of 12% to 50% in Combined Heat and Power: increase from 41 GW e in 2010 to 205 GW e in 2050 Large-Scale Heat Pumps: 0 GW e in 2010 to 40 GW e in 2050 Thermal Storage: 160 GWh in 2010 and 750 GWh in 2050 Centralised Boilers: 132 GW th to 532 GW th in 2050 (mostly on Biomass) Heat from Waste Incineration: 50 TWh in 2010 and 200 TWh in 2050 Large-Scale Solar Thermal: 0 TWh in 2010 and 100 TWh in 2050 Individual Solar Thermal: 22.5 TWh in 2010 and 130 TWh in 2050 Industrial Excess Heat: 7 TWh in 2010 and 105 TWh in 2050 Geothermal Heat: 2 TWh in 2010 and 100 TWh in 2050 Individual Heat Pumps: 40 GW e in 2010 and 175 GW e in 2050 Wind Power: 150 TWh in 2010 and 1490 TWh in 2050 (this includes the 65 TWh of additional wind Power in the HRE-EE scenario in 2050) Key achievements of the HRE-EE 2050 scenario Same decarbonisation as in the EU-EE 2050 scenario Same use of fossil fuels as in the EU-EE 2050 scenario 14
16 TABLE OF CONTENTS FOREWORD... 4 EXECUTIVE SUMMARY... 7 TABLE OF CONTENTS NOMENCLATURE INTRODUCTION OVERALL CONTEXT CURRENT SITUATION IN ENERGY BALANCE FOR CURRENT HEAT MARKET CONTEXT CURRENT DISTRICT HEATING SYSTEMS BASED ON LOCAL CONDITIONS DISTRICT HEATING WITHIN THE CURRENT EU ENERGY POLICY CONTEXT FUTURE HEAT DEMANDS IN EUROPE STRUCTURE OF THE REPORT METHODOLOGY MAPPING MODELLING MAPPING FUTURE POSSIBILITIES INCLUDING LINKING LOCATION OF CURRENT HEAT DEMANDS LAND USE DATA AND SETTLEMENT STRUCTURES MAIN STRATEGIC SOURCES OF HEAT SUPPLY FIRST MAIN HEAT SOURCE CATEGORY EXCESS HEAT ACTIVITIES THERMAL POWER GENERATION WASTE-TO-ENERGY (WTE) INDUSTRIAL EXCESS HEAT SECOND MAIN HEAT SOURCES CATEGORY RENEWABLE HEAT RESOURCES
17 3.4.1 BIOMASS GEOTHERMAL HEAT SOLAR HEAT CONCLUSION WITH RESPECT TO AVAILABLE LOCAL HEAT RESOURCES POSSIBLE EXTENSIONS OF DISTRICT HEATING SYSTEMS LINKING TO ENERGY MODELLING LINKING TO REGIONAL PLANNING THE EXCESS HEAT RATIO IDENTIFYING NUTS3 REGION HOT SPOTS MOST PROMISING NUTS3 REGION HOT SPOTS EXPANSION REFURBISHMENT NEW DEVELOPMENTS CONCLUSION REFERENCE SCENARIO FOR 2030 AND EUROPEAN ENERGY SYSTEM SCENARIOS IN ENERGY ROADMAP ENERGY EFFICIENCY SCENARIO HEAT DEMAND MODELLING THE EU-EE SCENARIO IN ENERGYPLAN NEW HEAT SCENARIO FOR 2030 AND INCREASING THE HEAT DEMAND REPLACING INDIVIDUAL BOILERS WITH DISTRICT HEATING REPLACING INDIVIDUAL COOLING WITH DISTRICT COOLING ADDING DISTRICT HEATING PRODUCTION UNITS ADDING ADDITIONAL RESOURCES TO SUPPLY HEAT TO THE DISTRICT HEATING NETWORK UTILISING THE SAME AMOUNT OF BIOMASS AS THE EU-EE SCENARIO UTILISING THE ADDITIONAL FLEXIBILITY OF THE HRE-EE SCENARIO SUMMARY
18 6 ENERGY SYSTEM ANALYSIS OF THE HRE SCENARIO CONCLUSIONS REFERENCES ANNEX I: REVIEW OF EXISTING ENERGY STRATEGIES ANNEX II: REVIEW OF FUTURE HEAT DEMANDS WITHIN VARIOUS ENERGY STRATEGIES ANNEX III: PROFILING BOILERS IN THE EU27 AND EVALUATING THE FUTURE HEAT DEMANDS ANNEX IV: LOCAL CONDITIONS ILLUSTRATED BY MAPS ANNEX V: THE PRIMES MODELLING TOOL ANNEX VI: CHARACTERISTICS OF A SUITABLE ENERGY SYSTEMS ANALYSIS ANNEX VII: KEY ASSUMPTIONS WHEN MODELLING THE ENERGY EFFICIENCY SCENARIO ANNEX VIII: DATA INPUT FOR MODELLING THE ENERGY EFFICIENCY SCENARIO ANNEX IX: KEY COSTS ASSUMED FOR THE ENERGY SYSTEM ANALYSES ANNEX X: ENERGYPLAN OUTPUT SHEETS ANNEX XI: DATA USED TO CREATE ENERGY-SYSTEMS-ANALYSIS FIGURES ANNEX XII: AARHUS CASE STUDY
19 NOMENCLATURE Abbreviation CC CCS CEEP CEWEP CHP CORINE CPI DH EC EEA EnergyPLAN (EP) EHI EPBD EU EU-CPI scenario EU-EE scenario GHG GIS HRE HRE-CPI scenario HRE-EE scenario IEA ISWA NUTS NUTS3 PES PP PRIMES Description Combined Cycle Carbon Capture and Storage Critical Excess Electricity Production Confederation of European Waste-to-Energy Plants, located in Brussels. Combined Heat and Power The European land cover surveying system. Current Policy Initiatives, future energy system scenario in the EC communication Energy Roadmap District Heating European Commission European Environment Agency, located in Copenhagen. The energy system analysis tool used in the pre-study. European Heating Index Energy Performance of Buildings Directive (EU) European Union The future energy system scenario called Current Policy Initiatives (CPI) from the Energy Roadmap 2050 communication. This scenario was chosen as the reference scenario in the first pre-study. The future energy system scenario called the Energy Efficiency scenario from the Energy Roadmap 2050 communication. This scenario was chosen as the reference scenario in this pre-study. Greenhouse Gas Geographical Information Systems Heat Roadmap Europe, a label for a planned research project initiated by this pre-study. An alternative future energy system scenario for the EU developed in the first HRE pre-study, which includes district heating in future scenario for the EU which only includes the implementation of existing policies. An alternative future energy system scenario for the EU developed in this study, which contains energy efficiency measures on both the demand and the supply side (i.e. by using district heating) of the energy system. International Energy Agency, located in Paris. International Solid Waste Association, located in Vienna. Nomenclature of Statistical Territorial Units, defined by Eurostat; a hierarchical geographic boundary system for statistical and other purposes. The third level of the European NUTS system defining the national administrative regions. Primary Energy Supply Power Plants - plants producing electricity only The energy systems model used for energy modelling in the EC 18
20 RES WTE communication Energy Roadmap Renewable energy sources Waste-to-energy, label for defining waste incineration plants with energy recovery 19
21 1 INTRODUCTION 1.1 OVERALL CONTEXT In 2010, about 73% of all 502 million EU27 residents lived in urban areas, according to United Nations World Urbanization Prospects [2], indicating that a major part of the EU s buildings are in high heat density areas. This condition is in itself a strong argument for increased use of district heating in Europe. The forecast for the future indicates that the urban population fraction in the EU27 will continue to increase: it is estimated to be 75% in 2020 and 84% in , thus highlighting one of the many reasons for this study which also include: The heating sector is almost always modelled and analysed in a simplified way in most future energy scenarios published concerning the European energy system. Evidence for this observation is presented in section 1.3 and Annex II of this report. Other parts of the energy system, such as electricity generation, industry, and transport, have received more attention in these scenarios. When heating is modelled in future energy scenarios, the heat supply is mostly based on generic options, while locally available options are omitted. Examples of omitted options are excess heat from thermal power generation, waste incineration, and industrial excess heat together with renewable sources as biomass, deep geothermal heat and solar heat. The future possibilities and economic benefits with more district heating have never been properly assessed within the European energy system. District heating is seldom seen as a powerful tool in most future energy scenarios. This observation is further presented in Annex I of this report. The first Heat Roadmap Europe pre-study published in 2012 was the first study ever on the EU27 scale which estimated the future economic benefits with more district heating using local options available. However, the first pre-study was based on a scenario which only included the implementation of existing policies in the EU, so there are relatively small changes in the future heat demands for the residential and service sectors. The key focus of this second pre-study is to estimate the possibilities and benefits with considerable reductions of the heat demands in the residential and service sectors. 1.2 CURRENT SITUATION IN 2010 The current situation is described by the 2010 energy balance, the heat market context, the district heating context, and district heating within the EU energy policy context Energy balance for 2010 The current energy balance for EU27 is illustrated in Figure 7 by the 2010 energy balance. This energy balance presents the energy flows from primary energy supply to end use. The final consumption stacked bar illustrates the energy flows after the conversion losses of the central conversion plants, mostly for generating electricity. This stacked bar summarises the energy that final consumers buy. The end use stacked bar illustrates the energy flows after energy conversion at consumer facilities, such as 6 It should be noted that such aggregated estimates for the entire EU27 are to be considered as indicative only. The reason for this being mainly that no harmonised definition of urban area currently is available, so Member States employ national definitions. 20
22 local boilers and vehicles. The figure reveals that about half of the primary energy supply is lost before reaching the end use. The losses are heat losses, mostly in electricity generation and vehicle engines, when fuel heat contents are converted into mechanical energy. Fuels used for heating in buildings constitute 18% of the primary energy supply in the EU27, but some electricity is also used for heating. This electricity use constitutes about 5% of the primary energy supply. Hence, the EU27 buildings use 23% of the primary energy supply for heating. The main purpose with this report is to present a robust strategy for reducing the primary energy supply and the corresponding carbon dioxide emissions, by recycling some the heat losses encountered between primary energy supply and end use. 80 Energy Balance for the EU27 in 2010 (EJ) Non-specified Non-energy use Transport Electricity Heat for Industry Heat for Buildings 0 Primary Energy Supply Final Consumption End Use Figure 7: The energy balance in three steps during 2010 for EU27. The energy flows labelled as heat for industry and building include only fuels and district heating. Electricity used for heating is included in the electric energy flows [3] Current heat market context The current heat market for residential and service sector buildings within the EU27 is about 3300 TWh/year according to Figure 8. The market share for district heating in buildings is approximately 13%, giving heat deliveries of about 430 TWh/year. District heat is also used for low-temperature heat demands in industry. These heat deliveries are about 180 TWh/year. These two major customer groups add up to the total volume of heat sold from district heating systems of about 620 TWh/year. Furthermore, 220 TWh/year is delivered from industrial CHP plants to industrial demands. Hence, the total turnover in the EU27 heat balance for final consumption amounts to about 840 TWh/year. The exact division between district heating systems and industrial CHP plants is very diffuse in international heat statistics. Hereby, it is also difficult to identify the real extent of district heating in the EU27, but the simple division estimated here will be used in this pre-study. 21
23 Currently, the heat market for buildings is dominated by fossil-fuels in on-site boilers, which according to Figure 8 account for two-thirds of the heat supply. This gives a future opportunity for CHP, district heating and the local use of renewables and heat pumps, by substituting fossil fuels to reduce the primary energy supply and carbon dioxide emissions. This expansion of district heating can be fulfilled by expanding heat recycling and renewable energy use in existing and new district heating systems. A proper assessment by energy modelling is still missing for this possible expansion for the whole EU27. However, some assessments have been performed for some countries and cities. One national example is the two Heat Plan Denmark (Varmeplan Danmark) reports for Denmark [4, 5], while one city example is the renewable plan for the Munich district heating system and geothermal heat [6]. Another purpose with this pre-study is to pave the road for a proper assessment of a future expansion of district heating within the EU27. The focus is on more heat deliveries to the residential and service sector buildings. Heat 13% Coal and Coal Products 3% Petroleum Products 17% Electricity 12% Combustible Renewables 10% Solar/Wind/Other 1% Geothermal 0% Natural Gas 44% Figure 8: Composition of the origin for heat supply to residential and service sector buildings in EU27 during Total heat supply was 11.8 EJ (3300 TWh), not including indirect heat supply from all indoor electricity use. Labels refer to the standard commodity groups used in the IEA energy balances. Heat denotes mainly heat from district heating systems. Data sources: IEA energy balances for 2010 complemented with some external estimations Current district heating systems based on local conditions District heating systems can be found all over Europe today, but levels of expansion differ significantly between the EU27 Member States. Although some national heat market shares are between 40-60% in some Scandinavian and Baltic Member States, district heating systems only cover 13% of the current European heat market for buildings in the residential and service sector. The corresponding market share for the industrial sector is about 9% [7]. European district heating systems have distribution pipes with a total trench length of almost 200,000 km, and total revenues for heat sold are about B 30/year. 22
24 Since district heating is mainly an urban occurrence, due to the dependency on concentrated heat demands for feasible heat distribution, it is relevant to express levels of expansion in terms of urban heat market shares. As a European average, district heat constitute about 16% of current urban heat markets, while these fractions can reach more than 90% in some cities with mature district heating systems. The spread and dissemination of European district heating technology can be seen in Figure 9, where each red dot marks a city with at least one district heating system in operation. The map is based on the current contents in the Halmstad University District Heating and Cooling Database. Some current numbers from the database are summarised in Table 1. The database is not complete, since about 6000 district heating systems currently operate in Europe, of which 5400 are located within the EU27. The deficit consists mainly of small systems in Germany, France and Poland. This overview shows that it is possible to track European regions which have existing experience of district heating systems in operation. An expansion of existing systems in these regions should be possible. Table 1: Overview of numbers of district heating systems in Europe according to the current content of the Halmstad University DHC database. All Europe EU27 Population concerned within EU27, million Proportion of population concerned within EU27 Number of systems % - in cities and towns over 5000 inhabitants Number of cities concerned % - in cities and towns over 5000 inhabitants Number of NUTS3 regions concerned % Total number of NUTS 3 areas % 23

25 Figure 9: Cities with district heating systems in EU27 by city size and for cities having more than 5000 inhabitants. The map shows 2188 cities with 2445 systems [8] District heating within the current EU energy policy context The European Union does not have many specific energy policies or directives concerning district heating. However, the specific directives for industrial emissions, emissions trading, energy performance in buildings, renewable energy, waste management, energy taxation and energy efficiency are examples of the EU regulatory framework for district heating. The latest projection within the EU energy policy context concerning future heat deliveries from district heating systems and industrial CHP plants is the specific Energy Roadmap 2050 communication [9] published in December This communication followed the more general communication from March 2011 called A Roadmap for moving to a competitive low carbon economy in 2050 [10]. However, the description of the heat sector is not complete in this future projection, since some of the energy for heat is missing in the corresponding impact assessment reports [11, 12]. 24
26 The development of the heat deliveries in each of the seven scenarios elaborated in Energy Roadmap 2050 is presented in Figure 10. The diagram is somewhat confusing with respect to the future development. The first years in the projection lack some heat deliveries from industrial CHP plants to industrial purposes since they are based on existing heat statistics lacking these heat deliveries. On the other hand, the energy modelling from 2015 and onwards includes all CHP heat deliveries. Hereby, the diagram gives a false optimistic view of the actual expected development. Therefore, we have added our own estimations of the total heat deliveries for the period of , estimated with additional input from the specific Eurostat statistical reports concerning CHP heat generation in the EU27. The average of these years amounts to about 830 TWh/year comparable to the level identified in section Historical and Projected Heat Deliveries in the EU27 (TWh/year) 1 Reference 1B Current Policy Initiatives 2 Energy Efficiency 3 Diversified 4 High RE 5 Delayed CCS 6 Low Nuclear IEA EuroStat EuroStat Including Industry 1,400 1,200 1, Figure 10: Expected heat deliveries for each of the seven main scenarios in the Energy Roadmap 2050 communication [40] compared to the heat statistics available from Eurostat and IEA for recent years. The expected development then becomes an increase of almost 20% by 2030 and almost 40% by 2050 in the Energy Roadmap 2050 reference scenario, indicating an annual expansion rate lower than 1% per year. However, this expansion is unevenly distributed among the two major customer groups. Heat deliveries to industrial purposes are expected to increase by 48% until 2030 and by 87% until 2050, while heat deliveries to residential and service sector buildings are expected to decrease by 13% until 2030 and by 22% until Two questions arise directly from analysing the projection of the heat deliveries in Energy Roadmap 2050: Have local synergy options been considered? To what extent has the substitution of electricity and gas by excess heat recovery been considered? 25
27 The conclusion is then that the European Commission does not foresee any radical expansion of the heat deliveries from district heating systems and industrial CHP plants in the future. Since all decarbonisation scenarios give lower heat deliveries than in the reference scenario, the European Commission has not identified district heating and industrial CHP as a major future decarbonisation tool within the energy system. Hence, Energy Roadmap 2050 has not estimated the outcome from a radical expansion of European district heating systems. It is possible that the benefits of district heating may have been overlooked in the Energy Roadmap 2050 communication by the PRIMES tool. As we have identified from studying the background references for Annex V, the PRIMES tool does not aggregate local conditions to identify the possibilities for expanding district heating systems, thus missing many of the possibilities and advantages of district heating. This is not unique to the scenarios in the Energy Roadmap 2050 report, but as discussed in the next section, the recycling of heat is a common omission in existing energy strategies for the EU FUTURE HEAT DEMANDS IN EUROPE A number of reports regarding the decarbonisation of the energy supply and/or increase in the penetration of renewable energy have been reviewed to present how the heat sector is currently dealt with in energy scenarios for the EU27. The results are described below and a description of the different reports (in terms of heat demands) is available in Annex II. The total number of reports reviewed is 14. In Table 2, the reports and the organization behind them are presented. The typical goal in the reports is greenhouse gas (GHG) emission reductions or to increase the share of renewable energy. The main trend in almost all the reports is that an increased electrification along with extensive energy savings are considered the main technological change to achieve reduced GHG emissions within the heating sector. Of course this implies that the electricity sector is made more efficient and reduces GHG emissions by producing electricity with low-carbon technologies. The heat demand depends highly on which scenario is followed. Typically electricity is assumed to play the largest role in the most ambitious scenarios (with a high share of renewable energy and large energy savings). In general the more ambitious the GHG goals, the larger the focus on electrification is. Some of the reports indicate the need for further investigations in terms of heating and cooling, which underlines the relevance of the analysis in this report. One example can be found in the Energy Technology Perspectives 2012 by IEA which states: Heating and cooling remain neglected areas of energy policy and technology, but their decarbonisation is a fundamental element of a low-carbon economy. The same report states that due to the projected urbanisation, district heating will be more feasible because of shorter distribution networks and more compact heat-generating infrastructure. Besides this, a compact urban development can compromise the desired use of natural lighting, ventilation and decentralised use of solar energy, and higher densities limit the potential of ground-source heat pumps. Most of the reports do not state the heat demand separately and it is therefore unclear to what extent the different resources should supply the demand for heating/cooling in general and specially for 26
28 district heating. In general the heating sector (including district heating) is not forgotten in the reports, but is just not a main focus area. Table 2 indicates the lack of detailed information regarding the heat demands in the reviewed reports. The demand for space heating and domestic hot water is mainly supplied by individual ground source, air to water or air to air heat pumps in the reports. While a heat pump is in fact a heat production unit, it is in some places described as a heat savings initiative. This is due to the thought that since heat pumps are deemed to replace (mainly) inefficient oil and gas boilers (and to some extent electrical heating), the implementation will result in a lower primary energy demand for the building. However to reach any ambitious GHG targets, the extensive use of heat pumps implies that the electricity sector in the long run must be based mainly on renewables, Carbon Capture and Storage (CCS), and/or nuclear power. In the Energy Roadmap 2050 it is stated that some European long term energy scenarios seem to have unclear/inadequate assumptions of the necessary investment costs for the electricity distribution grid. This means that the cost of the increased electrification may actually be higher than what is expected in these scenarios. Most reports do mention some district heating in densely populated areas using technologies such as large scale heat pumps, CHP, biomass, and to some extent solar and geothermal heat. Gas is also predicted in several reports to act as a replacement for coal and oil at least in the short to medium term future. District heating is expected to have an important role, but this is mainly in the less ambitious scenarios in terms of GHG reductions except from the Energy Technology Perspectives 2012 report from IEA where the importance of CHP and district heating is recognised as fundamental for the decarbonisation of the heating and cooling sector. One of the main ways to reduce the heat demand and energy demand in general is to include strict building requirements in all new buildings. After 2020 nearly zero-energy buildings are assumed to be the norm in Europe due to the energy performance of buildings directive (EPBD) [13]. Besides this, buildings which are subject to major renovations should at least live up to the minimum requirements. In the EPBD it is specified that it is the sole responsibility of the Member States to set minimum requirements for the energy performance of buildings and building elements. In other words, the responsibility of these savings in the heating of buildings relies on a) the legislation in the different countries and b) the rate of refurbishment. The latter is in some reports assumed to lead to a refurbishment of the whole European building stock by While a typical renovation cycle of buildings (e.g. around years) may make the renovations necessary within the timeframe from now till 2050, the issue is not only whether or not renovations will occur, but if the energy savings initiatives will be implemented when the renovations are carried out. In many cases there will be only one chance to improve the energy performance (i.e. one renovation within the period). Hence the uncertainty of refurbishment rates to high energy standards also lies within the assumption of the improvement of all renovated buildings besides the amount of buildings renovated per year. Nevertheless several reports include high refurbishment rates (to high energy standards) even without mentioning the share of the building mass which in practice cannot be improved, such as historical monuments. 27
29 Table 2: List of reports reviewed, the organization behind the report, and the relation to the heating sector. Report title EC Energy Roadmap 2050 / Impact Assessment Organisation Is the heat demand quantified separately? Does the report analyse the development in heat demand? Is CHP said to be important to promote? Is CHP a part of the analyses? EC Yes Yes Yes Yes Roadmap 2050 ECF No No Yes The Energy Report / Re-energising Europe WWF No No Not mentioned Yes, but not quantified in the text No Is district heating expanded as part of the analyses? For industry only, using industrial CHP Yes, but not quantified No ETP 2012 IEA Yes Yes Yes Yes Yes WEO 2012 IEA No No Yes Yes, but not quantified in the text Not described Deciding the future WEC No No Not mentioned No No Desert Power 2050 Dii No No Not mentioned No No Policy Report - Contribution of EE measures Fraunhofer ISI No No Not mentioned Yes, but not quantified in the text No Rethinking 2050 EREC Yes Yes Yes Not described Yes, but not quantified EU Energy Policy to 2050 EWEA No No Not mentioned No No Renovation tracks for Europe up to 2050 Europe s buildings under the microscope Eurima BPIE Space heating demand, yes Space heating demand, yes Power choices Eurelectric No No No No Not mentioned Not mentioned Not mentioned directly No No Yes Yes, but not included for new bldg. Not described Yes, but not quantified 28
30 Two of the main barriers to achieve the improvements in terms of the heat demand of buildings are the high investment cost (and long payback time) and the issue that there is often a split of incentives between tenants and landlords because the person who pays the energy bill is not the same as the one who would have to invest in building improvements. For this reason and the fact that the present annual renovation rates in most countries are well below a level which will have all buildings renovated by 2050 [14], there is an urgent need for political action to address the barriers by implementing policies and financing models to help overcome high up-front investment costs. The European Commission recognises the magnitude of this challenge when stating that the Energy Efficiency (EU-EE) scenario of the Energy Roadmap 2050 pushes the limits of what the chosen measures can achieve. Actually none of the scenarios in the Energy Roadmap 2050 live up to the energy efficiency goals 7 [15]: the Energy Efficiency scenario only reaches 18% in This indicates that fulfilling the goals will only be that much harder if the measures to obtain them are not launched right away, but scheduled to be commissioned in the years ahead. For most of the reports the idea is not to make a forecast of the expected future of the energy system, but to describe different ways to achieve more or less (or very) ambitious goals in terms of GHG emission reductions or share of renewables. In other words, the projections should not be seen as the answer on how to move towards a sustainable future, but as suggestions on how a specific target could be reached. The idea of HRE is to make a scenario for the European energy system towards 2050 which will argue that there is another unexplored path towards the energy objectives and that this path can contribute to address the technological challenges of implementing high shares of renewables and deep cuts in GHG emissions even in an economically feasible way. Concluding from the review of the analyses in the reports mentioned, it can be said that there is a need for conducting integrated energy system analysis of the electricity and heating sector also taking into account refurbishment, energy savings and new building standards. Should the actual refurbishment rate and energy efficiency improvements not live up to the very ambitious targets for buildings, the need for other measures in the electricity sector, or transport sector could increase in order to maintain the overall GHG emission objective. Also CHP and district heating could become a good option to increase energy efficiency and include more sources for the heat sector. 7 A 20% reduction in EU greenhouse gas emissions from 1990 levels (binding), raising the share of EU energy consumption produced from renewable resources to 20% (binding) and a 20% improvement in the EU's energy efficiency. 29
31 1.4 STRUCTURE OF THE REPORT Overall, the key focus in this report is to create a new heat strategy for the EU27 primarily based on heat savings in buildings, the expansion of district heating, more heat recycling, more renewable energy, and individual heat pumps. The report is structured as follows: Chapter 2 provides a brief overview of the methodology used in this study. Chapter 3 describes the maps that have been created for the EU27, which are used to identify how district heating can be expanded and what resources can supply heat to district heating networks in the future. Chapters 4, 5, and 6 describe the modelling part of this study: Chapter 4 presents the reference scenario, which is used as a starting point in the energy systems modelling. The reference scenario is based on the Energy Efficiency (EU-EE) scenario from the EU Energy Roadmap report. Chapter 5 describes how the EU-EE scenario is redesigned to include both district heating and district cooling, along with less heat savings and the same number of individual heat pumps. This new heat strategy is called the Heat Roadmap Europe Energy Efficiency (HRE-EE) scenario. Chapter 6 presents a comparison between the EU-EE and HRE-EE scenarios. The energy consumed, CO 2 emissions produced, and the costs of both scenarios are discussed. Chapter 6 discusses the main results from a case study, which has also been completed in this project based on the city of Aarhus in Denmark. This case study also includes a combination of mapping and modelling. Different combinations of heat savings, district heating, and individual heat pumps are compared for the city of Aarhus. Chapter 7 presents the main conclusions from this report. 30
32 2 METHODOLOGY The methodology utilised in this study is based on a combination mapping and energy system modelling. The mapping of local conditions reflects the potential to expand district heating in the future, while the modelling quantifies the effect of including district heating in the EU energy system. This approach is not completely new: the same methodology was used in the Heat Plan Denmark (Varmeplan Danmark) project [4, 5] with a very high geographical resolution for the mapping of local conditions. Below is a brief discussion of both the mapping and modelling methodologies employed in this study. In addition a case study has been performed for a concrete city, using more site specific data (see chapter 0 and Annex XII). 2.1 MAPPING Included in this study is a new methodology to map the heat demand, the potential for district heating, and the supply from excess heat and renewable energy sources at a desirable higher geographical resolution on an EU27 scale. The mapping part is then used to estimate the district heating expansion feasible in the EU in 2030 and 2050, which acts as an input for the modelling part of this study. In the future, the aim is to explore how this link between mapping and modelling can be even stronger. The main target area for the analysis is the aggregated area of the European Union with 27 member states (EU27). Since the mapping of local conditions concerns all countries within the European Union, the mapping information can be used for a separate analysis of each country. A major setback in standard generic energy modelling is that national conditions constitute the basis for the analysis. By such an approach, energy assets, demands, and distribution structures are viewed from an aggregated perspective not permitting insight into unique local circumstances and conditions. Such perspectives may be well suited when considering cross-border technologies and energy carriers such as electricity and gas grids, since such commodity flows are integrated and visible in international energy statistics. But, for analyses aiming to include genuinely local technologies such as district heating and cooling systems, such perspectives generally tend to be too blunt to detect and capture synergy options strictly limited to the local dimension. The ambitious European targets to increase energy efficiency in future power and heat distribution and use acts as a force to address local conditions in a more systematic and thorough sense than previously elaborated. The main reason for this is simply that only local conditions disclose obtainable synergies between local heat assets and prevailing heat demands. Only at the local level can the excess heat from various activities and sources be utilised by the recovery and distribution in district heating systems. For this reason, one fundamental idea for the planned extensive Heat Roadmap Europe Project is to deliberately break-up national boundaries and use local conditions as a foundation for the analysis, as it strives to identify, map, and quantify feasible and cost-effective synergy locations in Europe. For this purpose, we have used the NUTS3 regions defined by Eurostat as primary level of analysis for mapping local conditions in order to get relevant input to the energy modelling. These administrative regions, according to the 2006 NUTS classification with 2008 additions, are available for 34 European countries with 1461 defined regions. The 27 Member States of the European Union consists of
33 NUTS3 regions, see Figure 11. By using these predefined administrative regions, other statistical variables are easily available from the Eurostat and other related databases. A wide array of such publicly available data has been utilised in this study to create a heat atlas identifying the heat demands in Europe, as well as several other maps to identify resources available for future district heating systems. In the Heat Roadmap Europe context, these resources are divided into the two main strategic heat source categories of excess heat and renewable local resources, where the former includes sources such as thermal power generation plants, waste incineration facilities, and recovery of excess industrial heat, while the latter refers mainly to biomass, geothermal, and solar thermal heat. Figure 11: The NUTS3 regions of Europe, of which 1289 are located within the EU27 European territory and 14 are located overseas. The actual presence of sufficient heat demands in absolute terms and by geographical density is crucial for an estimate of the potentials for developing future district heating systems. The general aim of the mapping part of the project is thus to quantify the share and absolute size of heat demand by density, by population, and relative to the locations of excess heat activities, so that the total amount of district 32
34 heat to be distributed by the future energy system of Europe is known. The mapping part of the project thus serves two purposes; first to create a linkage with the energy system modelling part of the project, which simulates supply and demand on an hourly basis, and, secondly, to provide input and methodological tools for regional planning of future local European heat markets. The link to the energy system modelling, where the mapping group provides regional data of probable district heat volumes, also operates in the opposite direction: the output from the energy systems modelling indicates the amount of different resources that can be utilised within the energy system. With reference to the two main strategic sources of heat supply, such indications could to exemplify refer to locations where excess heat recovery from thermal power generation is a priority, or where rich availability of biomass is a major alternative. At yet other locations, Waste-to-Energy incineration in combination with significant presence of energy intensive industrial facilities, offers a quite different set of heat supply options. Mapping of European heat assets by regional resolution provides in this sense a basis for evaluations of appropriate alternative heat supply compositions, and in extension also concrete tools for planning of local and regional heat networks. 2.2 MODELLING After profiling the potential for district heating using the new maps created in this study, the effect of district heating on the EU energy system is then analysis using an energy systems tool. In this way, the impact of district heating can be quantified. EnergyPLAN is an energy system analysis tool specifically designed to assist the design of national or regional energy planning strategies under the Choice Awareness theory [16, 17]. It has been developed and expanded on a continuous basis since 1999 at Aalborg University, Denmark [18]. As a result, it is now a very complex tool which considers a wide variety of technologies, costs, and regulations strategies for an energy system (see Figure 12). The algorithms used to create the tool are described in detail in the user manual [19]. EnergyPLAN is a user-friendly tool designed in a series of tab sheets and programmed in Delphi Pascal. The main purpose of the tool is to assist the design of national or regional energy planning strategies by simulating the entire energy-system: this includes heat and electricity supplies as well as the transport and industrial sectors. All thermal, renewable, storage/conversion, transport, and costs (with the option of additional costs) can be modelled by EnergyPLAN. It is a deterministic input/output tool and general inputs are demands, renewable energy sources, energy station capacities, costs, and a number of different regulation strategies for import/export and for handling excess electricity production. Outputs are energy balances and resulting annual productions, fuel consumption, import/export of electricity, and total costs including income from the exchange of electricity. The energy system is modelled on an hourly basis over a period of one year, which ensures that the system can be operated reliable even with high penetrations of intermittent renewable energy. As the model is based on compiled analytical procedures rather than on the interpretation of model interdependencies, the computation of one year requires only a few seconds on a normal computer. Finally, EnergyPLAN optimises the operation of a given system as opposed to tools which optimise investments in the system. 33
![Figure 12: The structure of the EnergyPLAN tool [17].](/docs-images/92/110421724/images/35-0.jpg "Previously, EnergyPLAN has been used in a variety of studies at national and European level, including the Heat Plan Denmark (Varmeplan Danmark) project [4, 5] and the first HRE pre-study [1].")
35 Figure 12: The structure of the EnergyPLAN tool [17]. Previously, EnergyPLAN has been used in a variety of studies at national and European level, including the Heat Plan Denmark (Varmeplan Danmark) project [4, 5] and the first HRE pre-study [1]. In this study, the EU energy system has been modelled in EnergyPLAN based on the EU-EE scenario (see chapter 4). Then, as outlined in Figure 13, the inputs from the mapping work in this study have been used to replace some of the individual heating in the EU-EE scenario with district heating. This is combined with a number of other alternations to the heat sector to produce a new HRE-EE scenario (see chapter 5). Finally, both of these scenarios are compared with one another (see chapter 6). 34
36 Modelling Mapping Reference (EU-EE Scenario) Heat Demands Heat Resources New Heat Strategy (HRE-EE Scenario) Potential District Heating Expansion Comparison (Energy, CO 2, Costs) Figure 13: Linkage between the mapping and modelling in this study. 35
37 3 MAPPING FUTURE POSSIBILITIES INCLUDING LINKING In the mapping part of the project, three fundamental categories of information relevant for district heating expansions are subject for spatial analysis; residential and service sector heat demands, excess heat activities, and local renewable heat resources. While heat demand is geographically distributed in terms of climatic location, levels of energy services required by local populations, and by human settlement patterns (such as rural areas, towns and cities), excess heat activities and local renewable heat resources are distributed spatially over the continent by influence of e.g. regional levels of economic activity, availability of raw materials, and general terrain properties. The main objective of this chapter is thus to map the shares of total EU27 residential and service sector heat demands that are within reach of district heating; and to geographically quantify the sources of current and future district heat generation. From a strict heat supply perspective, modern district heating systems can be viewed as local heat distribution solutions that exploit two main strategic sources of heat; excess heat and renewable heat resources. Both of these main sources of heat supply consist of three activity sectors each, according to: 1. Excess heat: Thermal power generation Waste-to-Energy incineration Energy intensive industrial sectors 2. Renewable heat: Biomass Geothermal Solar The first main heat source category is based on the principle of sequential energy supply, or cascade coupling, by which rejected heat flows from primary energy conversions are recovered as secondary heat. Although primary fuel sources in thermal power generation and energy intensive industrial activities consist of fossil shares, serial utilisation of excess heat improves the general energy efficiency of these processes. Waste-to-Energy incineration of municipal solid waste and industrial waste fractions, possibly also containing shares with fossil origin, serves a purpose to reduce landfill deposits, reduce landfill GHG emissions while simultaneously generating electricity and heat. The second main heat sources category is based on the principle of utilising local renewable heat resources available in the ground, on land, or from the sky. As with the first main heat source category, these assets are heterogeneously spread over Europe depending on e.g. geology, agricultural and silvicultural management practices, and geographical location. Some European areas are rich in all three activity sectors, while others have dominant assets to exploit within only one or two of these. As a general distribution, Northern Member States are richer in biomass, while Central European areas are richer in geothermal energy. Solar irradiation is about twice as intense in Southern Europe compared to the Northern parts of the continent, but solar energy is naturally present in all Member State although at various degrees of intensity and usability. 36
38 While district heating systems today are supplied with heat originating from both fossil and renewable heat sources, a future decrease of the fossil content would further improve the sustainability of district heating. Future possibilities constitute a complex matrix of excess heat activities and renewable heat resources (including also wind energy converted to heat) heterogeneously distributed amongst city districts, urban agglomerations, rural regions, and country sides. To decide upon which future solutions to explore at different locations, a comprehensive mapping of prospective demand and supply is carried out. To be able to decide and select what options to develop at any given place, sufficient heat demand density as well as point sources for excess heat and local access to renewable energy sources has to be quantified by location. A first step to address these challenges and to generate a basic understanding of this puzzle is therefore to map European heat demands, excess heat activities, and local renewable heat resources. In combination with spatial information and geographical data for each locality and activity, the project aims at finding regions with exceptionally good conditions for establishing new and expanding existing district heating systems. However, the idea of using GIS based spatial planning for finding district heating opportunities is not new. This approach was used in Sweden in 2003 in order to identify more aggregated heat loads for higher utilisation of industrial excess heat and combined heat and power [20]. The Heat Plan Denmark project in 2008 used an extensive GIS-based heat atlas to identify the potentials to fully utilise existing district heating systems, and convert individual natural gas to new district heating on a national scale [5, 21]. A similar project in the UK gathered information about industrial heat loads [22]. The knowledge gained in that project is now available as interactive Internet maps for the CHP development [23] and the recently released National Heat Map [24]. A similar approach has also been used to give an overview of the European power plant infrastructure [25]. Hence, both information availabilities and presentation methods have made it possible to leave national energy balances in favour of local energy balances in future energy modelling. 3.1 LOCATION OF CURRENT HEAT DEMANDS A key parameter in the mapping part of the Heat Roadmap project is to produce reliable assessments of low temperature heat demands for space heating and domestic hot water preparation in each NUTS3 region, since these heat demands constitute the main target for district heat distribution. Estimating total NUTS3 region heat demands for space heating and domestic hot water preparation in residential and service sectors are fairly straight forward, although at a much too coarse resolution for district heating applications. In aiming to identify and map the proportion of total NUTS3 region heat demands within reach of current and future district heating systems, i.e. heat demand in areas with sufficient density quantified by amount and location, the greatest challenge is to map heat demands with sufficiently high geographical resolution. The aim within the project is to locate heat demands within a few kilometres distance. The methodological approach of mapping heat demands is done initially in a top-down manner, where national level energy statistics allow for the calculation of Member State average per-capita heat demands, which are subsequently associated to total population counts within each NUTS3 region in respective country. Per-capita heat demands by country include the levels of energy services available in the country, such as amount of floor space and indoor climatic comfort levels. It also indicates the 37
39 technological level of heating, reflected by level of insulation, occupant behaviour, or access to thermostatic control. Finally, the general climate of each Member State is represented by use of the European Heating Index (EHI), a concept presented by Werner [26], in order to map sub-national deviations from national and European heat demand averages. The European heating index is available as an isoline with values of zero in the far South to 150 in Northern Scandinavia. Eurostat statistics on NUTS3 region level are the smallest scale of public statistics available for all EU27 countries and contain, among other parameters, data on population and service sector activities. To achieve the highest possible resolution for mapping, the GEOSTAT European population grid by GISCO, the European Forum for Geostatistics, containing the 2006 population in one square kilometre grid cells was used [27]. Comprising of almost two million cells, this data set is assumed to be by far the best possible input to map high resolution demography in all EU27 Member States. Using the EHIadjusted heat demands per NUTS3 region, as described above, this population grid was converted to a highly detailed heat atlas for Europe. The one square kilometre grid that contains heat demand in Tera-joules per square kilometre (TJ/km 2 ) comprises a heat demand density map which could be the basis for an assessment of district heating potential by density alone. However, the grid does not allow for mapping coherent areas of similar heat demand. These are necessary to describe a distribution of heat demand over larger areas, which can be converted to areas that have a minimum threshold value for heat demand. A focal mean function in the raster-representation of a geographical information system (GIS) was used to calculate the average values of heat demand within a radius of one kilometre. The result is a smoothed heat demand density map; a European heat atlas, as presented in Figure 14. To our knowledge, this kind of heat atlas has never been published for EU27 before. In order to present a future heat demand, which takes into account the demographic projections for the member states, and which is reduced by 34% of the current demand, another version of the heat atlas was prepared. Population growth by 2030 originates from the PRIMES model, which was multiplied by the current population count per cell. The future energy demand of 34% was normalised for all cells dividing by the overall population growth in EU27 of 104%. The resulting heat atlas and heat demand density map shows that with the same classification, the prospective district heating potential is reduced significantly. The heat demand density map by focal mean is found to represent European urban areas and their suburban fringes very well. On the basis of a classification by Werner, four zones of heat demand density were modelled: below 15 TJ/km 2, TJ/km 2, TJ/km 2, and above 150 TJ/km 2, which represent levels of technological development as well as a general classification of areas by feasibility. The heat demand density class value of each square kilometre grid cell was spatially joined to the heat atlas, hereby allowing for classification of each individual 1 km 2 by heat density. Afterwards the nearly two million cells were subjected to further processing by means of a pivot table summary, which specifies the amount of heat demand by density class for all NUTS3 districts, resulting in the distribution presented in Table 3. The method is generic in a sense that statistical extracts can be made by several parameters, and for several geographical entities. 38
40 Figure 14: European Heat Atlas by heat demand density classes based on the GEOSTAT km 2 population grid. Table 3: Heat demand density classes, current situation (2006) for EU27 Heat demand density class [TJ/km 2 ] Population [10 6 ] Share of Population [%] Total inhabite d area [km2] Share of Total inhabited area [%] Avg. heat demand density [TJ/km 2 ] Total heat demand [PJ] Share of heat demand [%] zero > Total It was found that the focal mean density method has a levelling effect and results in lower overall density values, underestimating the district heating potentials. If using the raw density values however, the potential is overestimated. This happens because many small areas with higher densities are 39
41 identified, which often are not connected to larger prospective district heating areas. The solution may be to use the focal mean and the raw density as thresholds, within which a more realistic potential may be found. Figure 15 shows the development of these density thresholds by cumulative heat demand. Raw density 2010 Raw density HRE-EE Focal mean 1c density 2010 Focal Mean 1c density HRE-EE Heat demand density (TJ/km2) Cumulative heat demand (EJ/year) Figure 15: Cumulative heat demand according to the European Heat Atlas in 2010 and in the Heat Roadmap Europe Energy Efficiency (HRE-EE) scenario, by two different types of heat density calculations. Raw density is the density calculated in each square kilometre cell, while Focal mean density is the density if calculating the mean of a cell and its neighbourhood cells, thereby levelling out density values but resulting in more coherent prospective district heating areas. Taking Denmark as a case, the abovementioned method was applied to reconstruct the prospective district heating areas found, and to validate the results of the heat demand calculations. Looking at the area around the city of Aarhus (which also serves as the location of the case study for a comparison between district heating and individual heat supply in this report see chapter 0), it can be seen that the boundaries of the proposed district heating areas found by the density method correspond very well with the district heating areas charted by the municipal heat plans, see Figure 16. Of course the mapping here happens at two different scales. While the existing district heating areas are mapped at scales between 1:10,000 to 1:25,000, the European heat atlas grid resolution of 1 km2 is equivalent to scales of 1:250,000 to 1:1,000,000 (this is an approximation; vector scale and raster resolution cannot directly be compared). The scale or resolution of one square kilometre is sufficient to identify all district heating areas of more than 1020 TJ of annual heat demand. It can further be seen that there 40

42 are several smaller district heating areas existing, which however are too small to be identified by the European model 8. Figure 16: Comparison of prospective district heating areas found by the density method and existing district heating areas around the city of Aarhus, Denmark. The method can identify the majority of areas. The resolution of one square kilometre is just sufficient to identify all district heating areas above TJ of annual heat demand Land use data and settlement structures The main challenges of using uniform values of per-capita heat demands lie in the real-life heterogeneity of settlement structures, in the differing geography of a country (where particularly extensive and large countries may have different levels of heating requirements in different parts of the country), and in varying socio-economic structures where uneven distributions of e.g. wealth may have influence on heat demand factors such as specific floor spaces, household sizes, and affordability of space and hot water heating. Different regional building practices and national building codes through times add to this complexity. Actual geographical distribution of settlement structures by type and volume within cities and urban agglomerations is not fully captured by NUTS3 level information, and rarely so even in data originating from the highest level of resolution in official European spatial data, i.e. the Local Administrative Units (LAU2, or NUTS5, i.e. municipal level). Also from a strict district heating perspective, being a local heat distribution technology utilizing local opportunities, the ability to sub-penetrate national and NUTS3 region information levels is crucial for 8 A comparison between the modelled heat demand and the actually measured demand in the supply area of Affald Varme Aarhus shows a very good correspondence. While the expected demand in the supply area, based on several years of recorded data and using a normalised climate profile, is 8363 TJ, the Danish Heat Atlas by Aalborg University (Möller, 2008) accounts the heat demand to 8597 TJ, while the European Heat Atlas lands at 8731 TJ, which is a difference of less than 2% to the Danish Heat atlas and of 4% if compared to the expected heat sales, which are subject to some uncertainty. 41

43 feasibility estimations and practical assessments. Altogether, heat demands, settlement structures, land use priorities, excess heat activities, local heat resources, and general geographic properties of any given location need to be analyzed at high spatial resolution to provide sufficient information for robust assessments. Since heat demands, and e.g. levels of heat demand density concentrations, are decisive for the feasibility of district heating installations, the approach of combining 1 km 2 population grids with NUTS3 regional data needs therefore in the extension of the project to be improved in ways that allow for the delineation of areas within which there is a certain head demand density and presence of main strategic heat supplies. Coincidentally, a wide range of datasets are today publicly available for in-depth geographical and demographical analyses of local conditions in EU27 Member States. In Figure 17, an example of land use data from the European CORINE land cover 2000 seamless vector database is depicted with regards to some chosen land cover types in Belgium. The CORINE 2000 database [28] discretely reveals heat demand concentrations in urban areas, by label distinctions between e.g. continuous urban fabric, discontinuous urban fabric and industrial and commercial areas. In the CORINE database, the complete European land area is defined according to 44 different land cover types, and hence, it offers the possibility to identify proportions of urban areas within all NUTS3 regions. Figure 17: Example of land cover data labels for Belgium from the European CORINE land cover 2000 seamless vector database [28]. A major parameter decisive for the mapping of future district heating is also availability of high resolution data on European cities and urban agglomerations. Going beyond the CORINE 2000 dataset, in terms of geographical resolution, the Urban Audit of Eurostat has collected information on larger EU27 urban areas since late 1990s. As a cooperation between the European Commission Directorate- 42

44 General for Regional Policy and the Directorate-General for Enterprise and Industry, with support of the European Space Agency and the European Environment Agency, the European GMES Urban Atlas constitute a massive spatial dataset with high resolution data for many but not all European cities, drawing from the experiences from the Urban Audit scheme. As an example from this dataset, Figure 18 shows a wide set of land cover types for the French capitol Paris and surrounding NUTS3 regions (EEA, 2010). Using advanced spatial statistics such as cluster and outlier analysis by Morans I, or using Getis-Ord s Gi-coefficient for identification of hot spots, the urban land cover maps could be used to identify coherent areas on the basis of spatial distribution alone. Alternatively, raster-based analysis or network analysis may be used to model the cost propagation of district heating network by weighted distance using gravity-based approaches. Figure 18: Example of land cover and settlement structure data for the French capitol Paris, with surrounding NUTS3 regions, from the European GMES Urban Atlas dataset [29]. In the extension of the Heat Roadmap project, as the results will be disseminated to regional energy planners and local authorities, the features of the European CORINE land cover 2000 seamless vector database, the GMES Urban Altas as well as the GEOSTAT 2006 population grid can provide the basis for a tool to identify coherent prospective district heating areas. Information on land cover types and especially - urban tissue distribution will be important when sub-penetrating the NUTS3 region level to out-line feasible distribution distances from available heat sources to existing and future district 43
45 heating systems. Going one step further, even a model of all urban areas, and their district heating potentials by amounts and costs can be thought of. By thus offering spatial guidance and geographical support when identifying and analysing European synergy opportunities and locations, high resolution geographical and spatial datasets constitute corner-stones in the tool-package of the project. 3.2 MAIN STRATEGIC SOURCES OF HEAT SUPPLY To provide an alternative projection of future European heat supply in contrast to the generic model approach of the Energy Roadmap 2050, key parameters to identify in the Heat Roadmap Europe project will be the availability of current local excess heat streams and alternative local heat resources. Thus using a bottom-up approach to include local conditions, the project aims at establishing balances between local heat demands in residential and service sectors and available local excess heat and renewables heat resources in each NUTS3 region. A first inspiration for the need of such a bottom-up approach, was presented in the Ecoheatcool study [30], where future possible heat resources from combined heat and power, Waste-to-Energy, industrial excess heat recovery, geothermal heat, and biomass was quantified on an aggregated level for 32 European countries. The findings from this work can be summarised as: Approximately 17% of all residual heat from thermal power generation was recycled into district heating systems or used directly for industrial demands Only 1% of the European biomass potential was used in district heating systems for urban heat demands Approximately 7% of the calorific value of non-recycled waste was utilised as heat in district heating systems Only 3% of the direct available industrial excess heat was recycled into district heating systems Less than 0.001% of the geothermal resources suitable for direct use were utilised in district heating systems Hence, there is no shortage, in absolute terms, of available heat resources in short and medium term. To identify the relative amount of techno-economically feasible supply, the Heat Roadmap Europe project aims at finding the locations for these future heat resources in order to facilitate an expansion of district heating in Europe. 3.3 FIRST MAIN HEAT SOURCE CATEGORY EXCESS HEAT ACTIVITIES As mentioned above, modern district heating systems are local heat distribution solutions that exploit the two main strategic sources of excess heat and renewable heat resources. The first main heat sources category, excess heat, is found mainly in thermal power generation plants, in waste-to-energy incineration facilities, and in energy intensive industrial processes. A brief overview is given below in this sub section with respect to some available information sources about excess heat locations and annual volumes. Although summoned here mainly per Member State or at EU27 level, the information 44
46 itself is geo-referenced as point data with coordinates, which has been gathered and generated on NUTS3 region level and subsequently aggregated for this overview presentation Thermal power generation The possibility of increased combined heat and power generation in the European power balance is based on an assumed continued future need for thermal power generation. Increased recovery of excess heat from thermal power generation plants will reduce heat losses to the environment and substitute the current use of fossil fuels for space heating and hot water preparation in many European buildings. Given a current ¾ approximate share of power-only operation in European thermal power generation (2008), there should be future possibilities with increased recovery of excess heat by more combined heat and power generation. As presented in Table 5, annual EU27 Member State excess heat volumes from thermal power generation alone are substantial. If only considering major facilities with installed capacities above 50 MW, as reported in the E-PRTR for the years 2007 to 2009 (and given applied carbon emission factors and other project assumptions), total EU27 excess heat volumes from these activities sum up to some 7.1 EJ yearly. Although massive, this figure is likely to be an under-assessment, since there is also a large presence of smaller sized plants throughout the continent. The locations of major thermal power stations using fuel combustion are presented in Annex IV in Figure 81. However, many of these installations already operate as combined heat and power plants, and a large share of this generation capacity is located in more rural areas, at large distances from cities and towns that represent sufficiently sized district heat sinks Waste-to-Energy (WTE) Waste incineration with energy recovery belongs to the fourth recovery step of the waste management hierarchy after prevention, re-use, and recycling in the Waste Framework Directive. The primary purpose with waste incineration is to avoid the environmental problems associated with landfills, the fifth and final step in the waste management hierarchy. As presented in Figure 19, the use of landfills is still very extensive for municipal solid waste in many EU27 Member States, since 92 million tonnes of municipal solid waste reached landfills during 2010 according to eurostat [30]. Also industrial waste streams are available for waste incineration. Less than half of the current waste supplied to the Swedish WTE plants is municipal solid waste. The locations of the 407 WTE plants currently operating within EU27 are presented in Annex IV in Figure 82. These plants receive about 65 million tonnes of waste per year, representing a calorific heat value of between 650 and 720 PJ. Currently, less than half of this calorific heat value is recovered as electricity as well as heat. During 2009, only 162 PJ of heat was recycled from these European WTE plants according to the Eurostat heat balance. Hence, more heat could be recycled from WTE plants, both from better utilisation of existing plants and establishment of new WTE plants. 45
47 Municipal Solid Waste (kg/person) Material recycling Energy recovery Landfilled Composted etc Incinerated without energy recovery Unknown (generated minus treated) European Union - 27 Cyprus Luxembourg Denmark Ireland Netherlands Austria Malta Germany Spain France Italy United Kingdom Portugal Finland Belgium Sweden Greece Slovenia Hungary Bulgaria Lithuania Romania Slovakia Czech Republic Poland Estonia Latvia Figure 19: Distribution of municipal solid waste treatment in EU27 Member States during 2010 according to the waste hierarchy order categories [30] Industrial excess heat Industrial excess heat is normally recycled from five typical energy intensive industrial sub-sectors (chemical/petrochemical; iron and steel; non-ferrous metals; non-metallic minerals; and pulp and paper production) and oil refineries. Current recycling of industrial excess heat is difficult to discover since it is not reported in international energy statistics. The only bodies that report these heat streams are national district heating associations gathering own national statistics. An overview of these heat streams is presented in Persson & Werner [31] for 2008: 1.1 PJ in France, 17.6 PJ in Sweden, 2.9 PJ in Denmark, 3.2 PJ in Germany, and 0.1 PJ in Italy. These volumes add up to 24.8 PJ for the whole EU27. But this estimation is probably an underestimation, since the situation in many other countries is unknown. The locations for major industrial plants within the six sub-sectors mentioned above having excess heat are presented in Annex IV in Figure 83. Many of these plants are located near urban areas giving the possibility of transferring the excess heat to heat consumers in district heating systems. Given applied study recovery efficiencies, reflecting full capacity recovery, total annual excess heat volumes from EU27 energy intensive industrial sub-sectors are in the vicinity of 2.7 EJ, as detailed in Table 5. 46
48 3.4 SECOND MAIN HEAT SOURCES CATEGORY RENEWABLE HEAT RESOURCES The second main heat sources category, local renewable heat resources are found mainly in biomass availabilities, in geothermal fields, and in annual solar irradiance. An overview is given below with respect to available information sources about their locations with respect to NUTS3 regions. A brief overview is given below with respect to some available information sources about local renewable heat resources and current and potential annual volumes by location Biomass Biomass is currently used as an original energy source in many European district heating systems. Fuel sources are mainly forestry and agricultural waste. According to the Eurostat heat balance for 2009, 241 PJ of heat with biomass origin was supplied into district heating systems. Sweden had a lead position with an input of 86 PJ, while other significant supply appeared in Austria, Denmark, and Finland. While biomass may come from different sources, we focus here on the biomass available from established forestry as part of sustainable forest sources (mostly wastes from forestry operations of managed forests like thinning and rotation felling). Likewise, biomass from agriculture is included, but without adding to the available agricultural areas by land use change, and preferably in the form of wastes such as straw left on the fields. Potentials are limited to the extent of EU27 countries only, although an increasing proportion comes from import. Because imported biomass is always available if transport infrastructure exists, but less desirable in a 100% renewable energy scenario [32], we shall aim here to map the EU27 domestic potentials as local potentials, which take into consideration that forest and agricultural land use, stock and productivity is preserved in each member state. Furthermore, we are aware of indirect land use change [33] as an increasing problem that adheres to the production of energy crops. Hence the potentials are mapped using current stocks, areas and management practices which are believed to have neutral consequences for carbon emissions (there may however be exemptions in some Eastern and Central European countries, but on the positive side the accumulation of carbon in Western European forests is not included either). We are furthermore aware that it is incredibly complex to identify sustainable forestry and agricultural practices without including the life cycle of forestry and agricultural products. Finally, we have neglected the technological aspects of biomass use and we merely sketch but do not solve the issue of rational biomass resource allocation by location, scale, and technology of plant. As a consequence, the availability of biomass resources by geography shall only be made in a qualitative way. In order to satisfy the desire to map biomass resources by location anyway, a method has been devised that does the following: 1) Maps the current geographical extent in terms of areas used for forestry and agriculture at a high spatial resolution. 2) Maps the current management practices in terms of stock and felling in European forests, as well as cereal productivity on agricultural fields, both on a country scale. 3) Produces qualitative maps on the NUTS3 scale on the availability of biomass from forest and agriculture under current management regimes. 47
49 Forest biomass The European forest density maps produced by the European Forestry Institute (EFI) are available as forest coverage per one square kilometre grid. No distinction is made between deciduous and coniferous species in the current version. The forest coverage comprises all forests as a percentage per one square kilometre grid, which translates to the number of hectares per square kilometre if considering full forest coverage. The percentages can therefore be summarized for each NUTS3 region using the Zonal Statistics as Table function in ArcGIS Spatial Analyst. The result is a table, which can be joined to a NUTS3 administrative map for visualization and further analysis. Forest management practices are quantified in the Eurostat Database. Table for_area, last updated on , shows forest area by member state; forest area of managed forests only ( Forests available for wood supply ) is used here. Appreciating that forests can have different yield and management practices, which are determined by geography and by country, another table with wood volumes for_vol, last updated on , has been used to calculate specific increments and specific fellings [m 3 /ha] for each country, again for managed forests only. The resulting specific fellings and increments have been related to the summarized forest area (now including all forest areas, not just managed forests) from the EFI forest density map per NUTS3 region Biomass from agriculture As a spatial data input for agricultural area, the 2006 Corine data set by the European Environmental Agency was used, which in its raster version allows for mapping land use in a 100m grid, i.e. each grid cell represents land use per one hectare. The land use classes for arable land (211, 212 and 213) were recoded to a grid with value 1, and summarized by NUTS3 region as the number of hectares of arable land. Because agricultural yield, like forest biomass yield, is a function of management practices as well as climate, the spatial dataset was enriched with statistical data from Eurostat. Table tag00006 with the area of cereals grown as well as table tag00031 with the annual cereal yield, both for 2011, were used to calculate the specific yield in tonnes/hectare by country. As cereals are the most widely used crop, and have similar characteristics to many energy crops, specific cereal yield was used as a proxy for agricultural productivity, which can be applied as a qualitative measure for straw yield or the amounts of energy crops by multiplying the total area of arable land with the cereal productivity. Hence, the method describes the potential for energy crops if all arable land was used for this. Caveats in this method are that the current agricultural productivity may be higher or lower than in a situation where agriculture for energy may become intensified, and that we only look at cereals, where a shift in current crops of different kind to cereals or energy crops may be an option. However, we believe that the combination of arable land availability and productivity is feasible as a means to qualitatively assess the geographical distribution of agricultural wastes and dedicated energy crops. 48
50 Qualitative overlay by means of multi-criteria modelling In order to combine agricultural and forestry biomass resources in one map, which can be used to visualize the relative biomass resource, a multi-criteria model has been applied which uses the inputs given in Table 4. Table 4: Forestry and agriculture input data for multi-criteria modelling Biomass origin Criterion per NUTS3 district Justification for biomass availability Weight Forestry Forest coverage, % High availability of forest 20% Forest increment, m 3 Sustainable forest management 15% Forest felling, m 3 Presence of forest industry 15% Agriculture Arable land, ha High availability of arable land 20% Cereal productivity, ton/ha Intensity of agriculture 30% The justification of the five criteria follows rational reasoning. A high availability of forest is a precondition to actually use forest products, and to run a forest industry that accumulates sufficient volumes of wood. Forest increment is used as an indicator for sustainable forest management. Low or even negative values indicate areas which are unlikely to deliver additional forest biomass. High felling rates suggest there are established forest industries in the area, which positively influence the biomass availability. In terms of agriculture the absolute amount of arable land is a driver for biomass. Finally, an important factor is the cereal productivity, which indicates agricultural intensity. The presence of intensive agriculture is related to the availability of agricultural wastes such as straw, and a generally positive attitude to growing energy crops. A possible alternative to this approach could be the calculation of likely yield minus the actual yield in order to identify idle resources (land and management) for growing energy crops. A multi-criteria model allows for the comparison of what otherwise is incomparable, and is a shortcut to a more elaborate account for resources and implementation of management practices. In this prestudy it was deemed feasible to qualify those NUTS3 regions, which, by the nature of their silvio- and agricultural management of natural resources, may score high in a European context. Each of the five criteria was based on Eurostat statistics, see above, and converted to a 5 grade scale (1 worst, 5 best) by means of a classification that uses a geometrical interval in order to manage the large differences in area and volumes adherent to agricultural and silviocultural statistics. The result is a map, presented in Figure 85 of Annex IV, where each NUTS3 region has a score of 1 to 5, depending on the availability of either woody biomass or agricultural residues or energy crops, which where weighted 50/50. It can be seen that both the areas with high intensity forestry as well as high intensity agriculture achieve a moderately high score of around 3, while a few regions score highly in both disciplines, resulting in high overall scores. Low scores are the result of this model in areas with high population densities, dry climates and low agricultural and silviocultural productivity. The potentials derived from current statistics and land use mapping are subject to change if particularly the agricultural sector is subject to change, and if forestry is oriented towards energy production Geothermal heat European Geothermal Energy Council (EGEC) reported recently [34] that 212 district heating systems in Europe use partly input from geothermal heat. According to Eurostat energy statistics, systems in Belgium, Denmark, Germany, Lithuania, Hungary, Austria, and Slovakia utilised 2.5 PJ during But 49
51 systems also appear in France, Poland, Romania, and United Kingdom. The French systems used 2.9 PJ during 2009 according the national SNCU statistics. About thirty of them are situated in the Paris region. New major geothermal projects are implemented in Paris in France, Den Haag in Netherlands, and Vienna in Austria. EGEC foresees an expansion in many countries until 2014 according to Figure 20. Number of geothermal district heating systems Austria Belgium Czech Republic Denmark France Georgia Germany Hungary Iceland Italy Lithuania FYRO Macedonia Netherlands Poland Portugal Romania Serbia Slovakia Slovenia Sweden Switzerland Turkey United Kingdom Bosnia-Herz. Bulgaria Croatia Ireland Norway Spain Figure 20: Number of geothermal district heating systems in Europe by country: Firstly as existing systems in 2011 and secondly as planned additions for 2014 [34]. The geothermal conditions vary by location in Europe. The estimated temperatures at a depth of 2000 metres are presented by NUTS3 region in Annex IV in Figure 84. By joining population statistics with Figure 84, we can conclude that 4 % of the EU27 population live in NUTS3 regions with geothermal temperatures above 200 ºC. The corresponding population proportions are 8 % for temperatures between 100 and 200 ºC and 20% for temperatures between 60 and 100 ºC. With an urban population of 73%, the proportion of the EU27 population that can be reached with a geothermal district heating systems is about 26%. These areas include major cities such as Aalborg, Hamburg, Berlin, Munich, Frankfurt am Main, Hanover, Stuttgart, Groningen, Amsterdam, Rotterdam, Paris, Lyon, Strasbourg, Madrid, Barcelona, Budapest, and Bratislava. Another way to illustrate the future possibilities with geothermal heat in European district heating systems is to consider the shares and volumes of geothermal heat at currently best practice locations. One such region is found in the French NUTS3 region FR107 Val-de-Marne, located just south of the French capitol Paris (geothermal temperatures between 60 and 100 ºC at 2000 metres depth). 50
![Figure 21: Cities with district heating and geothermal heat in French NUTS3 region FR107 Val-de-Marne [34].](/docs-images/92/110421724/images/52-0.jpg "If the level of geothermal heat utilisation in district heating systems as found in the major cities of this NUTS3 region (18% share of total city heat demands in 2011, according to [34], were to be")
52 Figure 21: Cities with district heating and geothermal heat in French NUTS3 region FR107 Val-de-Marne [34]. If the level of geothermal heat utilisation in district heating systems as found in the major cities of this NUTS3 region (18% share of total city heat demands in 2011, according to [34], were to be reached by similarly large European cities in NUTS3 regions with geothermal temperatures at 2000 meters at or above 60 ºC, an estimated 430 PJ could be harnessed annually by Solar heat Some solar thermal installations in conjunction to district heating systems appear in Denmark, Germany, Austria, and Sweden. Denmark had a lead position with a solar heat supply of 0.11 PJ during 2009 according to the Eurostat heat balance. Denmark has also seen an increasing interest in more installations according Figure 22. This large Danish interest has given lower installations cost for large solar collector fields, giving the possibility for other countries to benefit from this trend. The regional conditions for solar district heating depends on the location in Europe, since the global solar irradiation is about twice in Southern Europe compared to Northern Europe. The global irradiation for optimal angle by NUTS3 region is presented in Annex IV in Figure This future projection for geothermal heat in EU27 is based on the assumption that all cities with more than inhabitants, within identified 461 NUTS3 regions in 17 Member States, that has geothermal heat at 2000 meters with temperature levels at or above 60 C, will exploit these heat assets in 2050 by the same rate and extent as is currently being done in FR
![Figure 22: Overview of existing and planned solar collector fields connected to district heating systems in Denmark [35].](/docs-images/92/110421724/images/53-0.jpg "As can be seen in Figure 22, the Danish town of Marstal, with approximately 2200 inhabitants and a total district heat supply of 100 TJ/a (2004 [36]), hosts one of the largest solar district heating")

53 Figure 22: Overview of existing and planned solar collector fields connected to district heating systems in Denmark [35]. As can be seen in Figure 22, the Danish town of Marstal, with approximately 2200 inhabitants and a total district heat supply of 100 TJ/a (2004 [36]), hosts one of the largest solar district heating schemes in Denmark. Adding to an original m 2 solar collector field from 2003, an extension of m 2 in 2010 increased the total field area to m 2 (the extended scheme also contains a m 3 seasonal pit heat storage). Before the extension, the annual solar heat contribution to the district heat supply was 29 TJ per year. In the new system configuration, this volume has increased to approximately 47 TJ annually [37]. The local renewable heat resource of solar irradiation is unique in the sense that it is available for all, although large scale solar heat in district heating systems as opposed to individual solar panels is considered most suitable in smaller towns and rural areas. The main reason being that all three activity sectors within the first main strategic heat supply source are more frequent in urban regions, why large scale solar heat would constitute undesired competition in such areas, particularly during summer. Another reason being that large scale solar thermal solutions require accessibility to relatively large land areas for collector fields and storages. As in the case of a geothermal potential for future European district heating above, a corresponding projection was made with regard to solar thermal possibilities. Based on the above reasoning, all EU27 cities with a population within the interval of 2000 n 10,000 (close to 19,000 cities and a total 84 million people) were assigned an expected solar heat per-capita value reflecting partly the solar irradiation intensity of the location (see Figure 86 in Annex IV for a map on EU27 solar irradiation 52
54 intensity levels), and partly the average solar heat generation capacity at the original Marstal field (low projection) and at the extended Marstal field (high projection). In short, the large scale solar thermal potential for EU27 ranges by this assessment between 1250 PJ to 2060 PJ annually, although relatively lower heat demands in Southern European Member States were not considered in this assessment Conclusion with respect to available local heat resources The main conclusions and central message from this brief overview of information sources, annual volumes, and potentials, for the two main strategic sources of heat supply is that it is possible to gather information on excess heat and renewable local heat resources by NUTS3 regions. Hereby, as a fundamental basis for calculating and assessing expansion possibilities for future European district heating systems, the balance of total main strategic heat supplies per NUTS3 region and total heat demands per NUTS3 regions can be established. In the mapping part of the project, this data assembly constitute a matrix of 1289 rows, one for each included NUTS3 region 10. In Table 5 this information, quantified with regards to the first main strategic heat supply source only, has been aggregated to Member State and EU27 total levels. 10 Of 1303 EU27 NUTS3 regions, according to the 2006 classification, a total of 14 regions are excluded in the Heat Roadmap project. Four French NUTS3 regions refer to Caribbean islands, eight Spanish regions refer to Atlantic islands and North Africa coastal regions, and two Portuguese regions refer to Atlantic islands. 53
55 Table 5: Annual volumes of excess heat by activity sector and totals, Member State total heat demands in residential and service sectors, and assessed National excess heat ratios [38-40]. Member State Sum of excess heat per EU27 Member State by activity sector and total [PJ/a] Sum of heat demand per EU27 Member State [PJ/a] National excess heat ratio [-] TPG 1 W-t-E IHR Total Total Avg. AT BE BG CY CZ DE DK EE EL ES FI FR HU IE IT LT LU LV MT NL PL PT RO SE SI SK UK EU Excess heat from current combined heat and power activities recorded as Steam and air conditioning supply in the E-PRTR dataset was not included in this assembly focusing on future potential. By this exclusion, estimated to approximately 500 PJ/a, significant existing excess heat recovery volumes from TPG in e.g. Poland, Germany, Finland, and Sweden are omitted in this analysis. 3.5 POSSIBLE EXTENSIONS OF DISTRICT HEATING SYSTEMS As presented in Figure 9, district heating is widely used in Europe today, although typically at moderate expansion levels. But, the wide presence of district heating systems today acts in favour of future extensions of existing systems, since it is a greater leap to introduce a completely new technology than it is to extend and expand an existing one. Technology know-how, component manufacturers, and business models are already present in many EU27 Member States, why possible extensions of current district heating systems are to be considered achievable from a pure practical point of view. Additionally, from an economic point of view, it has been established in a recent work that urban district heating can threefold at competitive and directly feasible conditions from current urban heat market shares of approximately 20% up to market shares of 60% [41]! In this work, focusing on city areas in France, Germany, the Netherlands, and Belgium, the current average urban district heating heat market share (21%) was slightly higher than the EU27 average (15%), indicating that average European extension possibilities are greater still. The main study result from Persson & Werner [41] is 54
56 depicted in Figure 23, where it can be seen that beneficial extension possibilities up to 60% urban district heating heat market shares are equally present in all four studied Member States. This high level of district heating extension further corresponds to a marginal distribution capital costs of only 2.1 /GJ (7.6 /MWh). One of several important aspects of the methodology in Persson & Werner [41] is that it utilises local conditions, e.g. population and heat densities on sub-city district levels, to produce the resulting estimates of specific investment costs for district heat distribution. By this methodology feature, high resolution modelling of feasible extensions or new establishments of district heating systems can be performed for unique city districts, where the concentration of residential and service sector heat demands are taken into account for each assessment. In conjunction with information from the Eurostat Urban Audit, the European CORINE 2000 database (mentioned in section 3.2.1), and other relevant data sources, modelling of specific investment costs for district heating systems are made possible by this methodology. Marginal Distribution Capital Cost ( /GJ) France Belgium Germany Netherlands Grand total % 10% 20% 30% 40% 50% 60% 70% 80% 90% 100% Share of Total Heat Market Figure 23: Current marginal distribution capital cost levels and corresponding urban district heating heat market shares in four studied European countries in 2008 [41]. 55
57 60 Why do Europeans prefer imported energy instead of heat recycled from their neighbour? Heat Delivery Cost ( /MWh) Crude Oil Natural Gas Heat Distribution (average annual cost) Figure 24: The simple socio-economic comparison between current import prices of fossil fuels and the heat distribution cost for connecting heat surpluses with heat demands. Current import price of crude oil has been set to US$110/barrel. It is interesting to compare this suggested average annual cost of 2.1 /GJ (7.6 /MWh) for feasible and competitive urban district heat distribution to other individual heating solutions. This specific investment cost represents a high level of European district heating extension and it can be compared to the current cost of heat from oil and natural gas. Given the current crude oil price for import to EU27 (April 2012) of 110 US$/barrel, the corresponding heat costs for imported crude oil and natural gas are presented in Figure 24. These import costs are substituted, when heat are recycled into district heating systems. The annual average cost for heat distribution according to Persson & Werner [41] is included as the third bar in Figure 24. Hence, this cost for connecting heat sources with heat demands is much lower than the substituted costs, giving a very profitable situation. When comparing the investment cost for heat distribution with the substituted costs, the socio-economic payback becomes only 2-3 years. 3.6 LINKING TO ENERGY MODELLING The Heat Roadmap Europe 2050 project unites the properties of both top-down modelling and bottom-up mapping (see Figure 13). By this combination of dual methodological perspectives, the project aims at identifying genuinely local heat synergy opportunities often ignored in generic energy modelling. The linkage to the energy modelling part of the project consists of volume confirmations and geographical determinations of model estimates and calculations. As detailed in above sections, current total EU27 heat demands in residential and service sectors have been spatially distributed in the European heat atlas (see Figure 14), as well as specified for each included NUTS3 region. 56
58 Regarding the main strategic sources of heat supply, a quantitative representation of current excess heat volumes recovered and rejected from thermal power generation activities, Waste-to-Energy facilities, and energy intensive industrial sub-sector activities, have been established based primarily on emission data from the E-PRTR dataset from the EEA, other complementary data sources, and according to corresponding project assumptions of carbon dioxide emission factors and excess heat recovery efficiencies. This data has been assembled and is available at NUTS3 region level, although presented here at EU27 Member State level for the sake of overview, see Table 6. Table 6: Summary table of EU27 Member State heat demands, excess heat activities, and associated excess heat volumes (EH) and excess heat ratios (EHR) [38-40]. Member State NUTS3 regions Excess heat facilities CO 2 & Excess heat Heat demand In study With EHR In study Considered CO 2 [Mt/a] EH [PJ/a] In study [PJ/a] With EHR [PJ/a] AT BE BG CY CZ DE DK EE EL ES FI FR HU IE IT LT LU LV MT NL PL PT RO SE SI SK UK Grand Total No exclusions Difference Excluded NUTS3 regions refer to Atlantic and Caribbean islands of French, Spanish, and Portuguese origin. 2 Excluded or Non-considered excess heat facilities refer mainly to mining, quarrying, and extraction plants on land or in the North Sea, and to existing combined heat and power facilities sorted under the NACE main economic activity name category label steam and air conditioning supply in the E-PRTR dataset. For local renewable heat resources, qualitative maps of current availabilities have been complemented with hands-on projection estimates for future potentials based on e.g. currently best practice examples. These potentials have been assessed to provide indications to the modelling group regarding model projected volumes of e.g. geothermal and large scale solar thermal heat resources. 57
59 In this sense, the link to the energy modelling group can be presented in a table format, see Table 7, where the assessed and projected annual heat supply contributions from each of the six heat source activities in the mapping part of the project, is matched to the corresponding annual volumes produced by the energy modelling group. The table specifies annual volume shares from each heat supply, given current and expected total district heating shares of total heat EU27 heat demands (in parenthesis). As the current geographical database of the Heat Roadmap Europe 2050 project can be scaled and structured to any spatial subdivision, the link to energy systems analysis can be adjusted to future energy models, which may incorporate a division of Europe into several subsystems. Table 7: Annually delivered district heating volumes to residential and service sectors in EU27 for current situation (2010), 2030, and 2050, by strategic heat supply sources, as modelled by the energy modelling group (EM) and resource potential assessed by the mapping group (Map). Main strategic heat sources (PJ/year) Fossil fuel power generation excess heat and heat from boilers Potential 2010 (13% DH) 2030 (30% DH) 2050 (50% DH) Map EM EM EM Waste-to-Energy incineration excess heat Industrial excess heat Biomass heat n/a Geothermal heat Solar thermal heat Large-scale heat pumps n/a Total district heating in modelling Total heat delivered from waste in 2010 was 170 PJ. However, only 50 PJ/year is assumed to go to the residential and services sectors due to the assumptions used to remove industry from the Energy Roadmap 2050 projections. 2 The biomass potential is not established in this context, but modelled levels correspond to volumes used in the reference scenario. As outlined in Table 7, there is more surplus heat available in the EU27 than utilised in the 2050 scenario proposed here in the energy modelling. There is slightly more heat from waste incineration utilised as this was deemed a conservative estimate. The 2010 IEA energy balance for the EU27 indicates that 182 TWh of waste was consumed to produce 36 TWh of electricity and 47 TWh heat, corresponding to the efficiencies of 20 and 26% respectively. The remaining 54% became heat losses. Currently 65 million tons of waste is directed to waste incineration, while approximately 90 million tons is put into landfills. Approximately 50 million tons could be used in new waste incineration plants, so in the future 115 million tons of waste could be direct towards waste incineration, corresponding to a fuel heat value of 330 TWh. Assuming a future heat efficiency of 60%, then the total heat supply from waste would be 200 TWh (720 PJ), which is 150 TWh of additional heat compared to There are other factors which will affect the heat available from waste incineration, particularly the assumptions relating to increasing or declining waste volumes in the future. Here we assume the current volume as a compromise, making additional heat of 150 TWh/year possible. 58
60 3.7 LINKING TO REGIONAL PLANNING A central objective in the Heat Roadmap Europe project is to outline and map synergy opportunities within European NUTS3 regions with respect to local heat resources and excess heat recovery in district heating systems. In the context of this second pre-study, this objective is pursued by combining data on available heat resources with low temperature heat demands in residential and service sectors, hereby identifying European excess heat hot spots for further analysis and evaluation. The key questions to be answered in this analysis are: Which European NUTS3 regions or agglomerations of NUTS3 regions have large volumes of excess heat and local heat resources? Which European NUTS3 regions or agglomerations of NUTS3 regions have large volumes of low temperature heat demands in residential and service sectors? Hence the hot spots can be used as a point of departure for local case studies, which would include more elaborate analysis of the utilisation of low temperature heat sources for the development of district heating. In the extension of the project, follow-up questions to be asked in relation to these topics are at what acceptable investment cost levels for district heating systems identified excess heat and local heat resources in chosen NUTS3 regions will be recoverable and possible to utilise? Also, what is the magnitude of fossil fuel substitution by this excess heat recovery and local heat resource utilisation, and what are the resulting reductions in greenhouse gas emissions? Furthermore, by spatial allocation of low temperature heat resources to distributed heat demands by least cost, shortest distance or lowest CO 2 content, the potentials for low temperature heat supply can be refined to actually comprise least-cost solutions for any of the identified hot spots or for larger regions in general. But, at this stage first, a means by which to identify excess heat and district heating opportunity regions need to be developed; the excess heat ratio The excess heat ratio identifying NUTS3 region hot spots The definition of the excess heat ratio concept takes departure from a related identity known as heat utilisation rate (ξ heat ), first defined and elaborated in a recent study that analysed general conversion and recovery efficiencies in the EU27 energy balance [31]. The heat utilisation rate reveals the extent by which recovered excess heat is utilised by establishing the proportion of recovered excess heat in any given total heat demand. The heat utilisation rate is expressed as: ξ heat = E heat Q tot [%] Where the term E heat (J) refers to recovered (utilised) excess heat and the term Q tot (J) refers to low temperature heat demands in residential and service sector buildings. In analogy with this definition of the heat utilisation rate, the excess heat ratio (ξ heat,o ) can be defined in a principally similar way: ξ heat,o = E heat,o Q tot [%] 59
61 Where E heat,o (J) refers to theoretically recoverable (potentially utilisable) excess heat from any given excess heat activity. A corresponding concept referring to local renewable heat resources, i.e. a renewable heat ratio could principally be established in a similar way. In this context, the recoverable volume of excess heat from any given excess heat activity has been established by use of the following condition: E heat,o = E prim,act η heat [J] Where the annual primary energy input (E prim,act ) to any given excess heat activity was calculated by applying carbon dioxide emission factors 11 to reported total annual carbon dioxide emission volumes from each considered excess heat activity [38], and recovery efficiencies were chosen to reflect complete realisation of conceivable excess heat recovery from the considered activities. For each NUTS3 region, the total sum of available excess heat were then related to total low temperature heat demands in residential and service sectors, to produce the distribution of EU27 NUTS3 region excess heat ratios as shown in Figure Carbon dioxide emission factors used in this context were based on IPCC standard values for stationary combustion of fuels in corresponding activity sectors, and further adjusted to constitute unique Member State values by reflecting fuel supply compositions within national excess heat activities, as reported in the IEA Energy Balances for the year 2010 (IEA, 2012). 60
62 Figure 25: EU27 NUTS3 regions by their excess heat ratio, i.e. their share of excess heat relative their share of low temperature heat demands in residential and service sectors. In Figure 25, the 789 EU27 NUTS3 regions with an excess heat ratio value above zero are distinguished from the grey colour label of no activity and assigned a colour according to the level of excess heat by heat demands in the region at hand. It is noticeable that excess heat volumes in many instances are larger than current heat demands, i.e. excess heat ratios being above one. Yet, in some occasions, EU27 NUTS3 region excess heat volumes are found at above ten times the magnitudes of corresponding heat demands! This confirms that many excess heat activities are located remotely to urban areas. On the other hand, five hundred NUTS3 regions have no recorded excess heat activities within the activity sectors considered in his project at all, and hence, have excess heat ratios equal to null. A conclusion must be that while the NUTS3 regions form a good spatial reference for access to statistical data, as administrative units they are rather arbitrary when it comes to the spatial structure of cities, industry and the power sector, where major activities not necessarily follow administrative boundaries. Also, the map of Europe reveals that the NUTS system has led to an uneven division into areas (compare e.g. France and Germany), which means that they are less suitable as containers for 61
63 the distributed heat demand and the point locations of excess heat, which may require an even higher spatial resolution. However, since the main objective by using the excess heat ratio is to provide a tool to identify NUTS3 regions where recovery and utilisation of existing excess heat is reasonable and not just any NUTS3 region with larger volumes of excess heat than prevailing heat demands the excess heat ratio needs to be complemented with manual evaluations regarding the possibilities in each case. As an example, a high excess heat ratio is in itself not sufficient enough an indicator of heat synergy opportunities, since the total volumes at hand might be of insignificant magnitudes. Hence, the excess heat ratio is suitable as a preliminary indicator of likely synergy regions selectable for deeper analysis and evaluation Most promising NUTS3 region hot spots Based on data analyses and thorough evaluation of found excess heat ratio values, all NUTS3 regions that were found to have excess heat available were sorted by ratio magnitude and by Member State belonging. By hereafter performing complementary manual analyses of total volumes of excess heat and heat demands in found NUTS3 regions, combined with experience based considerations of e.g. district heating developments, technology preferences, and future prospects, an exclusive list of most promising NUTS3 region hot spots were extracted from the mapping work results (see Table 8 for a summary and Annex IV a full list). Table 8: Selection of most promising EU27 NUTS3 region excess heat hot spots by population, total heat demand, and excess heat volumes, per Member State Member States Count of NUTS3 regions Total population [Mn] Heat demand [PJ] Excess heat [PJ] FR AT BE CZ DE IT PL UK Grand Total This selection resulted in the identification of 68 promising NUTS3 regions, depicted in Figure 26, where initiative and efforts for increased heat synergy projects are considered most optimal. 62
64 Figure 26: Selection of most promising EU27 NUTS3 region excess heat hot spots. As a general reference of classification for this selection, all identified NUTS3 region hot spots were sorted in three descriptive regional labels indicating current levels of district heating technology use. These three labels, i.e. Expansion, Refurbishment, and New developments, are also used as subheadings in the following section where some NUTS3 region hot spots characteristic for these labels are presented in more detail Expansion Four EU27 Member States with favourable expansion possibilities for district heating are France, Austria, Italy, and Germany. Already today district heating is well established in many towns and city districts in these countries, but considering current moderate average heat market shares for district heating in general, there is opportunity for expansions within these nations. As an example, the single French NUTS3 region of FR232 Seine-Maritime, one of six identified French NUTS3 region excess heat hot spots in the pre-study, shows a strong geographical resemblance with regard to excess heat activities and larger urban agglomerations, see Figure 27, which constitute ideal basic conditions for excess heat recovery and utilisation by means of district heating systems. 63

65 Figure 27: Example of Expansion NUTS3 region hot spots: French NUTS3 region of FR232 Seine-Maritime at the Atlantic coast. Annual excess heat volumes from excess heat activities in Seine-Maritime are found at 95.6 PJ, according to the pre-study investigation. At an annual heat demand in residential and service sectors of only 35.0 PJ, the corresponding excess heat ratio in the French coastal region is as high as 2.7. The strong coherence of industrial activity locations and urban settlements is noticeable in this case. Another example where excess heat activities and vicinities to larger urban agglomerations are possible to identify is found in the twin Austrian NUTS3 regions of AT315 Traunviertel and AT312 Linz- Wels, as illustrated in Figure 28. These regions show similar properties as the French example, although at slightly lower excess heat ratios of 1.8 in both instances, and constitute most beneficial expansion regions in Austria. Another common feature for both of these country examples are also relatively low NUTS3 region population densities (< 350 n/km2), although population and heat density concentrations within urban areas are significantly higher. 64

66 Figure 28: Example of Expansion NUTS3 region hot spots: twin Austrian NUTS3 regions of AT315 Traunviertel and AT312 Linz-Wels. The two other EU27 Member States that were considered to suit well into the Expansion group for future district heating are Italy and Germany. Within both of these, larger clusters of NUTS3 region excess heat hot spots were identified in the analysis, see Figure 29 and Figure 30. As can be seen, these kinds of highly populated, as well as highly developed, regions, offer extended expansion possibilities for excess heat recovery and utilisation of renewable heat resources by district heat distribution here there are possibilities for regional heating networks exploiting a rich variety of present heat sources! 65
, but both excess heat and heat demand volumes are often large.")
67 Figure 29: Example of Expansion NUTS3 region hot spots: large clusters of NUTS3 region excess heat hot spots in the Milan region in Italy. None of the Italian NUTS3 hot spot regions have very high excess heat ratios (typically between 0.2 and 0.9), but both excess heat and heat demand volumes are often large. As an example, the NUTS3 region of Milan itself, holds a total population of 3.9 million people, generating a total low temperature heat demand of roughly 83 PJ per year, to which a total annual excess heat volume of 28 PJ could be utilised. In the German example, the Ruhr region stands out as perhaps the most significant excess heat and heat synergy opportunity region in all of EU27 today. There are already plenty of district heating networks distributing heat in this region, but to recover more of all available excess heat in the region, future expansions are a likely option. Basic hot spot data for all NUTS3 regions within the Ruhr cluster are presented in Table 9. 66

68 Figure 30: Example of Expansion NUTS3 region hot spots: large clusters of NUTS3 region excess heat hot spots in the Ruhr region of Germany. Table 9: 20 NUTS3 region hot spots in the Ruhr region of Germany, per NUTS3 region NUTS3 region NUTS3 region Name Population [Mn] Land area [km 2 ] Population density [n/km 2 ] Heat demand [PJ] Excess heat [PJ] Excess heat ratio [-] DEA11 Düsseldorf, Kreisfreie Stadt DEA12 Duisburg, Kreisfreie Stadt DEA13 Essen, Kreisfreie Stadt DEA14 Krefeld, Kreisfreie Stadt DEA17 Oberhausen, Kreisfreie Stadt DEA19 Solingen, Kreisfreie Stadt DEA1A Wuppertal, Kreisfreie Stadt DEA1C Mettmann DEA1D Rhein-Kreis Neuss DEA1F Wesel DEA23 Köln, Kreisfreie Stadt DEA24 Leverkusen, Kreisfreie Stadt DEA27 Rhein-Erft-Kreis DEA31 Bottrop, Kreisfreie Stadt DEA32 Gelsenkirchen, Kreisfreie Stadt DEA36 Recklinghausen DEA51 Bochum, Kreisfreie Stadt DEA54 Hamm, Kreisfreie Stadt DEA55 Herne, Kreisfreie Stadt DEA5C Unna Total

69 3.7.4 Refurbishment The second label, Refurbishment, indicates district heating opportunities in the form of decarbonisation efforts of heating markets by extended use of excess heat and local renewable heat resources. To exemplify this kind of future opportunity conditions, two examples are drawn, one from Poland and one from the Czech Republic, see Figure 31 and Figure 32. In the Polish case, the NUTS3 region of Sosnowiecki in the southern part of the country has a high excess heat ratio well above 5 (5.6) due to large shares of thermal power generation activities and a relatively small population (0.71 million). Not far away, close to the Czech border, the neighbouring region of Katowicki, has less excess heat but considerably higher population concentrations than Sosnowiecki, indicating generally better conditions for large scale heat recovery and distribution. Figure 31: Example of Refurbishment NUTS3 region excess heat hot spots: PL22A Katowicki and PL22B Sosnowiecki in Southern Poland. Similar to the Polish example, the Czech Republic NUTS3 region of CZ042 Ústecký kraj harbours a total of astonishing 135 PJ per annum of excess heat mainly from thermal power generation and energy intensive industrial activities. At very sparsely populated land areas (population density of only 160 n/km 2 ), this serves as a good example that not even very high excess heat ratios (in this case at 7.1) automatically signals absolute recovery possibilities. Once again, within urban agglomerations, the conditions for network heat distribution can be expected to be most beneficial but how far are they from the plentiful excess heat sources in this case? 68

70 Figure 32: Example of Refurbishment NUTS3 region excess heat hot spots: Czech Republic NUTS3 region of CZ042 Ústecký kraj New developments If not considering the fourth label category sometimes mentioned in this context (the fourth label being; Further developments, mainly considering mature district heating markets and current developments to 4 th generation heat distribution technology), the third and final category to exemplify in this section is the New Development cases. Quite naturally, these new development examples come from EU27 Member States currently in the midst of integrating concepts such as district heating and cooling solutions in a broader sense than previously. Due to many reasons, e.g. different preferences regarding low temperature heating options in different regions of Europe, district heating have not been broadly recognised in these New Development regions before. But now, many new initiatives are being made all around Europe, to harvest the benefits of low carbon and energy efficient district heating in communities and regions acting for a more sustainable way of providing space and hot water heating. To exemplify, the twin NUTS3 regions of UKC12 South Teesside and UKC11 Hartlepool and Stocktonon-Tees, up on the east United Kingdom coast, together with Belgian cluster of NUTS3 regions surrounding the big city of Antwerp, constitute such new development regions see Figure 33 and Figure 34. Both of these examples share common features such as high presence of excess heat activities, large populations, and high heat densities. 69

71 70 Figure 33: Examples of New Development NUTS3 region excess heat hot spots: twin United Kingdom NUTS3 regions of UKC12 South Teesside and UKC11 Hartlepool and Stockton-on-Tees.

72 Figure 34: Examples of New Development NUTS3 region excess heat hot spots: Belgian twin NUTS3 regions of BE236 Arr. Sint-Niklaas and BE211 Arr. Antwerpen Conclusion To conclude, the mapping part of the second pre-study of the Heat Roadmap Europe 2050 project, has performed a bottom-up analysis and a spatial mapping of EU27 heat demands in residential and service sectors, of excess heat activities within thermal power generation, Waste-to-Energy incineration, and energy intensive industrial sub-sectors, together with projections and potential estimates of local renewable heat resources, to provide a linkage to the modelling team of the project. By this linkage, proposed future levels of heat demands and district heating deliveries from the modellers have been balanced against the anticipated corresponding levels found by spatially mapping the distributions of these local opportunities. By development of theoretical concepts to describe excess heat availabilities in relation to local and regional heat demands, the mapping group has performed a selection of EU27 NUTS3 regions according to their excess heat ratios and complementary conditions, by which three distinguished categories of European district heating progression has been exemplified. For the next phase of the project, a renewable heat ratio should be established as well, which in combination with the excess heat ratio, would allow for a single heat ratio to be calculated for all NUTS3 regions of EU27. Unlike the excess heat ratio, which of course has a zero value for regions without excess heat activities, a renewable heat ratio would have a positive value for all EU27 NUTS3 regions. Hence, there is a heat ratio waiting to be established for all regions in Europe! 71
73 4 REFERENCE SCENARIO FOR 2030 AND 2050 In this chapter the reference energy system that serves as the basis for creating new scenarios for Europe are constructed. First the energy systems scenarios in Energy Roadmap 2050 [9] are described in general and specifically with regards to the heat demands. Finally based on this, the reference energy systems used in this study is described. 4.1 EUROPEAN ENERGY SYSTEM SCENARIOS IN ENERGY ROADMAP 2050 The EC published in 2011 Energy Roadmap 2050 [9], which analysed cost-effective ways of reducing greenhouse gas emissions in the European Union. It contains six different scenarios for the future of the EU energy system. In the first pre-study for Heat Roadmap Europe (HRE1) [1], the Current Policy Initiatives (CPI) scenario from the Energy Roadmap 2050 report was used as a reference. The CPI scenario is based on the assumption that there will be no changes in European energy policies beyond the publication of the Energy Roadmap 2050 report. It is described not as a forecast, but as a projection of what will happen if the market forces at all times determines the energy solution in the present economic, technological and political situation. The PRIMES model which is described in Annex V was used to develop the projections in Energy Roadmap The CPI scenario was utilised in HRE1 since the aim was to investigate if the addition of district heating can improve the EU energy system, compared to a scenario which only includes the implementation of existing policies. In this study, the aim is To improve the methodologies developed in the first pre-study [1] for mapping and modelling district heating in the EU energy system and subsequently, to investigate if the addition of district heating can improve the EU energy system in combination with significant heat reductions in the residential and services sectors. Furthermore, in this study electric heating and district cooling are also considered. In line with this, the EU Energy Efficiency (EU-EE) scenario from the Energy Roadmap 2050 report is used as a reference in this report. This scenario is driven by a political commitment of very high primary energy savings by 2050 and includes a very stringent implementation of the Energy Efficiency plan [11]. In addition to a number of common proposal for all of the decarbonisation scenarios in the Energy Roadmap 2050 report, the EU-EE scenario includes the following policies also [12]: Additional strong minimum requirements for appliances High renovation rates for existing buildings due to better/more financing and planned obligations for public buildings (more than 2% refurbishment per year) Passive houses standards after 2020 Marked penetration of ESCOs and higher financing availability Obligation of utilities to achieve energy savings in their customers' energy use over 1.5% per year (up to 2020) Strong minimum requirements for energy generation, transmission and distribution including obligation that existing energy generation installations are upgraded to the best available technology every time their permit needs to be updated Full roll-out of smart grids, smart metering Significant renewable energy sources (RES) with highly decentralised generation 72
74 As a result, the gross inland consumption is approximately 10% and 30% lower in the EU-EE scenario than in the CPI scenario in the years 2030 and 2050 respectively (see Figure 35). Furthermore, there is more renewable energy utilised in the EU-EE scenario in 2050 than in the CPI scenario. 20,000 Solids Oil Natural gas Nuclear RES Gross Inland Consumption (TWh) 16,000 12,000 8,000 4,000 0 EU-CPI EU-EE EU-CPI EU-EE EU-CPI EU-EE Figure 35: Gross inland consumption in the EU-CPI scenario from the first pre-study [1] and the EU-EE scenario used in this study. Note: electricity is excluded from this diagram since it only represents the net annual exchange which is less than 0.25% of the total in all years. This is also reflected in the installed electricity capacities for both scenarios. As outlined in Figure 36, there is more solar and wind power in the EU-EE scenario than the CPI scenario, primarily at the expense of gas-fired power plants and some nuclear power. 73
75 1,600 1,400 Electricity Capacity (GW) 1,200 1, Geothermal heat Biomass-waste fired Oil fired Gas fired Solids fired Other renewables Solar Wind Hydro Nuclear 0 EU-CPI EU-EE EU-CPI EU-EE EU-CPI EU-EE Figure 36: Electricity capacity by fuel in the EU-CPI scenario from the first pre-study [1] and the EU-EE scenario used in this study. A more detailed breakdown of electricity production is available in Figure 37, which also indicates that in 2050 there is three times more electricity from CCS plants in the EU-EE scenario than in the CPI scenario, while electricity production from CHP plants is approximately 33% less. In summary, the EU- EE scenario has a lower energy consumption, more intermittent renewable energy, more electricity from CCS, less electricity from nuclear, and less electricity from CHP than the CPI scenario. This means that the EU-EE scenario will require more flexibility than the CPI scenario since there is more baseload power in the form of CCS and more intermittent electricity in the form of wind and solar. 74
76 2010 EU-EE 2050 EU-CPI 2050 EU-EE Indicators for gross electricity production (%) Efficiency for thermal electricity production (%) CHP indicator (% of electricity from CHP) CCS indicator (% of electricity from CCS) Nuclear in electricity generation (%) Renewable energy in electricity generation (%) Figure 37: Indicators for gross electricity production in the EU-CPI scenario from the first pre-study [1] and the EU-EE scenario used in this study. Looking at the EU-EE scenario in more detail, it is clear from Figure 38 that the transport and industry sectors will continue to be the largest energy consumers between now and Due to the largescale implementation of energy efficiency measures, the residential and services sector only represent 32% of the total consumption in 2050 compared to 39% in This is important to consider here since this study will focus on the heat demands for the residential and services sectors Indicators for gross electricity production (%) 5,000 4,500 4,000 3,500 3,000 2,500 2,000 1,500 1, Industry Residential Services Agriculture / Fishing Transport Figure 38: Final energy consumption by sector in the EU-EE scenario for the years 2010, 2030, and
77 4.2 ENERGY EFFICIENCY SCENARIO HEAT DEMAND Since this study will focus on the heat sector for the residential and services sector, the assumptions used for the future heat demand in the EU-EE scenario are of critical importance. In Heat Roadmap Europe 1, the results indicated that under existing policies (i.e. the CPI scenario), the heat demand will be sufficient for district heating to be implemented at a cheaper cost than using the technologies being pursued by existing policies. Hence, a key motivation for choosing the EU-EE scenario in this study was to investigate the feasibility of district heating if the heat demands are reduced significantly compared to the heat demand expected under existing policies only. To begin, the first step is to analyse exactly how much the heat demand for the residential and services sectors is being reduced in the EU-EE scenario. As outlined in Figure 39, the total heat demand in the EU-EE scenario is expected to drop by approximately 60% between 2015 and This is a much larger reduction than in the CPI scenario: by 2050, the total heat demand in the EU-EE scenario is approximately 50% of the heat demand in the CPI scenario. EU-CPI Scenario EU-EE Scenario Space and Hot Water Heat Demands (TWh/year) Figure 39: Total heat demand for the residential and services sectors in the EU-CPI scenario from the first prestudy [1] and EU-EE scenario used in this study for This total heat demand can be broken down into a number of key sectors: firstly the heat demand provides two distinct services, hot water and space heating. Figure 40 outlines how the total heat demand in the EU-EE scenario is divided between these two services, which indicates that the space heating demand is expected to drop by approximately 60% and the hot water demand by 55% between 2015 and
78 Space and Hot Water Heat Demands in the EU-EE Scenario (TWh) 4,500 4,000 3,500 3,000 2,500 2,000 1,500 1, Space Heating Hot Water Total Figure 40: Space heating and hot water demand for the residential and services sectors in the EU-EE scenario between 2015 and Secondly, the heat demand can be divided in terms of two distinct sectors, residential and nonresidential/services. Figure 41 indicates that the heat demand will reduce by approximately 60-62% in both of these sectors between 2015 and 2050, similar to the overall trend in the total heat demand. However, it is important to recognise that there are other dynamics involved in these changes also such as the population and the building stock. 77
79 Residential Services Total Space and Hot Water Heat Demands in the EU-EE Scenario (TWh) 4,500 4,000 3,500 3,000 2,500 2,000 1,500 1, Figure 41: Heat demand for the residential and services sectors separately in the EU-EE scenario between 2015 and Table 10: Population assumptions in the Energy Efficiency scenario between 1990 and 2050 [9]. Year Population (Million) Population 1-Year Change (%) Population 5-Year Change (%) Population 20- Year Change (%) Population 40- Year Change (%) Start Start % 1.4% % 0.9% % 1.7% % 2.1% Start Start % 1.7% % 1.2% % 0.8% % 0.4% 4.1% % 0.1% % -0.1% % -0.3% % -0.6% -0.9% 3.2% While the heat demand is reducing in the EU-EE scenario, both the population and the building stock experience an increase. Table 10 summarises the changes assumed in population in the EU-EE scenario, suggesting a 3.2% overall growth in population between 2010 and Table 11 presents similar statistics for the building stock in Europe: the total building stock is expected to grow by 35% between 2015 and 2050, which includes a growth of 42% for the residential sector and 32% for the services sector. 78
80 Table 11: Estimated building floor area for the residential and non-residential/service sectors in the EU27 between 2015 and PRIMES Estimate* [9] Ecofys Estimate [42] Residential floor area Residential floor area Non- Residential floor area Non- Residential floor area Period Residential Floor Area (mio. m 2 ) %/year Start 1.7% 1.2% 1.0% 0.7% 0.5% 0.3% 0.2% (mio. m 2 ) %/year Start 1.7% 1.0% 0.9% 0.9% 0.9% 0.8% 0.8% *In 2050, Ecofys estimated a residential floor area 15% lower than PRIMES. This data is significant since it means that the specific heat demand reductions (i.e. kwh/m 2 ) are even larger than the absolute heat demand reductions portrayed in Figure 40 and Figure 41. Overall, Figure 42 shows that the specific heat demand reduction is very similar for both services and both sectors considered here, with a 70% reduction (+/-3%) for each between 2015 and Space Heating Hot Water Total Residential Services Specific Heat Demands in the EU-EE Scenario (kwh/m2) Figure 42: Specific heat demand in the EU-EE scenario for the residential and services sectors, as well as for the space heating, hot water, and total heat demand. 79
81 4.3 MODELLING THE EU-EE SCENARIO IN ENERGYPLAN The PRIMES tool is an annual energy balance tool which forecasts the development of the EU energy system over 5-year periods (see Annex V). In contrast, the EnergyPLAN tool is an hourly energy-systemanalysis tool which focuses on the integration of intermittent renewable energy (see section 2.2 and Annex VI). Therefore, a number of issues are naturally encountered when data from the PRIMES tool is interpreted for the EnergyPLAN tool. During this process, a number of issues have been identified which are discussed in detail in Annex VII, along with an explanation of the assumptions made to overcome them. By modelling the EU-EE scenario in EnergyPLAN using these assumptions, it is possible to replicate the original projections created by the PRIMES model. As outlined in Figure 43, the PES is almost exactly the same in 2010, 2030, and 2050 in both the reference EU-EE scenario and the EnergyPLAN EU-EE scenario. The minor differences in 2030 (<0.5%) occur since the CHP plants cannot operate as much as the initial projections suggest. Due to a combination of a small heat demand, a high share of intermittent renewable energy, and a lack of flexibility in the system, the boiler needs to provide heat instead of the CHP plants more than the projections suggest. Since the boilers primarily use gas, there is a slightly higher gas consumption in the EnergyPLAN model. Similarly, since the CHP plants use considerable amounts of coal and biomass, due to a lower number of operating hours, there is a slightly lower coal and biomass consumption in the EnergyPLAN model. Nuclear Coal Oil Gas Biomass Waste RES Primary Energy Supply (TWh/year) 21,000 18,000 15,000 12,000 9,000 6,000 3, Electricity Exports (, TWh/year) 0 Reference EnergyPLAN Reference EnergyPLAN Reference EnergyPLAN Energy Efficiency Scenario -20 Figure 43: Primary energy supply by fuel and the net electricity exports for the EU-EE scenario from the original reference projections and the EnergyPLAN model. For 2050, the minor differences (<2.5%) seem to be caused for two reasons. Firstly, due to the same reason outlined for the year 2030 i.e. the CHP units do not operate as much as the projections suggest. Secondly, there is a larger electricity export in the EnergyPLAN model than in the original EU-EE 80
82 projections. The original EU-EE projections had a net electricity export of 31 TWh in 2050 whereas the EnergyPLAN model produces a net electricity export of 100 TWh (see Figure 43). This additional 70 TWh is evident in the EnergyPLAN tool since it considers the hourly balance between demand and supply for electricity, heat, and gas, which may be overlooked by the PRIMES tool, which primarily focuses on the annual energy balance. The overall difference for both 2030 and 2050 is so small that it can be concluded that the EU-EE scenario has been successfully replicated in the EnergyPLAN tool based on the key assumptions discussed in Annex VII. A full breakdown of the original EU-EE projections, how they have been interpreted to create a reference, and the results from the EnergyPLAN model is provided in Annex VIII. 81
83 5 NEW HEAT SCENARIO FOR 2030 AND 2050 After creating a model of the EU-EE scenario in EnergyPLAN, the Heat Roadmap Europe (HRE-EE) scenario could be created. The HRE-EE scenario contains a number of specific alterations for the space and hot water demands to residential and services buildings in the EU27 for the years 2030 and In summary, the key changes made to the EU-EE scenario when creating the HRE-EE scenario are as follows: 1. The heat demand is increased as the reductions identified in the EU-EE scenario seem very difficult to implement and they are very expensive. The hot water demand is increased by 16% compared to 2010 in the HRE-EE scenario, which is in line with a growth in population and building stock. The space heating demand is reduced by 47% in comparison to 2010 in the HRE- EE scenario. In comparison, the EU-EE scenario has a reduction of 55% in hot water demand and 62% in space heating demand between 2010 and Since there are less energy efficiency measures implemented in the HRE-EE scenario, the costs for energy efficiency are also reduced. 2. Individual boilers are replaced by district heating. In 2030, district heating meets 30% of the heat demand and in 2050 it meets 50% of the heat demand in residential and services buildings. Individual coal, oil, gas, biomass, and direct electric heating systems are replaced, but individual heat pumps are not since these are also considered a key technology to decarbonise the EU energy system. It is assumed here that these individual heat pumps are installed outside the urban areas that contain district heating. 3. Individual cooling units are replaced with district cooling. 10% of the cooling demand for residential and services buildings is provided using district cooling in 2030 and 20% in the year District cooling is supplied from both natural cooling and from absorption heat pumps, which require heat from the district heating network. 4. To supply the heat for these new district heating demands, new production units are added to the HRE-EE scenario. Some existing condensing power-plants are converted to CHP plants and new decentralised natural gas plants are constructed. Centralised boilers, heat pumps, and thermal storage facilities are also constructed. 5. With district heating now installed, additional resources can be utilised in the HRE-EE scenario that could not be utilised in the EU-EE scenario. These include more wind power of the largescale heat pumps, large-scale solar thermal plants, geothermal heat, surplus industrial heat, and heat from waste incineration. Therefore, heat from each of these resources is also added to the HRE-EE scenario. 6. After these measures are implemented, the HRE-EE scenario consumed slightly less biomass than the EU-EE scenario. Therefore, the biomass consumption was increased in the HRE-EE scenario until it was at the same level as the EU-EE, by replacing some natural gas in the centralised district heating boilers. 7. Finally, the HRE-EE scenario is more flexible than the EU-EE scenario since it integrates the electricity and heating sectors. To exploit the benefits of this, wind power is increased in the HRE-EE scenario until there is the same level of critical excess electricity production (CEEP) in the HRE-EE scenario as the EU-EE scenario. The assumptions used and results obtained during each of these steps is described in more detail in the rest of this chapter. 82
84 5.1 INCREASING THE HEAT DEMAND The heat demand in the EU-EE scenario has already been presented and discussed in section 4.2. In summary, the reductions identified in the EU-EE scenario seem very ambitious and they are likely to be extremely difficult to implement. For example, the most ambitious scenario for heat savings in buildings presented in a recent report by EURIMA (European insulation Manufacturers Association) [42], outlines that with deep renovations in the EU27, a space heating reduction of 47% or specific space heating demand (i.e. kwh/m 2 ) reduction of 62% will be feasible between 2015 and In comparison, the EU-EE scenario achieves corresponding reductions of 62% and 72% respectively. Since energy efficiency measures in buildings typically become more expensive as larger savings are achieved, the additional measures in the EU-EE scenario are likely to be extremely expensive. Comparing the cost of the energy efficiency measures in EU-EE scenario with those in the EURIMA report also suggest this. The cost of the energy efficiency measures in buildings in the EU-EE scenario are estimated at an annual average cost of B 295/year [9]. In contrast, the annual average investment costs for the energy efficiency measures in the Deep Renovation scenario completed by Ecofys for EURIMA are approximately B 160/year, although as outlined in Figure 44 these vary over the 45-year period including a steep drop in the last few years (which occurs because the whole building stock is then retrofitted). It is difficult to make a definite conclusion from this comparison since there are a lot of unknown assumptions behind the cost data in the EU-EE scenario. For example, the EU-EE scenario includes the following energy efficiency measures, with some of them occurring in other sectors such as electricity and transport: a. More stringent minimum requirements for appliances and new buildings; b. Energy generation, transmission and distribution; c. High renovation rates for existing buildings; d. The establishment of energy savings obligations on energy utilities; e. The full roll-out of smart grids, smart metering and significant and highly decentralised RES generation The costs for the EU-EE scenario are then divided into three types: Capital Energy purchases Direct efficiency investments It is assumed here that a lot of the energy efficiency costs are accounted for under capital costs rather than direct efficiency investments. For example, better appliances, new electric grids, the smart grid, and more renewable energy generation are assumed to be under capital costs. Hence, it is assumed that direct efficiency investments relates to the implementation of space and hot water savings in the buildings sector, which amounts to B 295/year. This may not be the case so the cost of energy efficiency measures may be over-estimated based on this. In any case, other reports based on the Danish building stock also report a significant increase in energy efficiency costs when you reach this scale of energy savings [43] (which is presented in more detail later). Therefore, the costs assumed here may not be correct, but the scale of the costs for energy efficiency measures seems to be correct. 12 The specific heat reduction (i.e. kwh/m 2 ) is greater than the absolute reduction (i.e. kwh) in space heating since the building area increases in combination with a decrease in the absolute heat demand. 83
85 The aim in designing a new "enhanced energy efficiency" scenario in this report is to identify if the same objectives in the EU-EE scenario, in terms of energy and emission reductions, can be achieved in a way that is both cheaper and easier to implement. To achieve such an objective, the strategy is to replace some of the energy efficiency measures in buildings, which are either very expensive and/or difficult to implement, with a heat supply from units such as district heating or individual boilers. In line with this, the following two subjects have been investigated further in the EU-EE scenario: The high reductions in the hot water end use seem very difficult to implement. The reduction per unit of space heating demand, below a total average reduction of 40-50% of the existing level, seems to be very ambitious in terms of implementation and also very expensive. Annual investment costs for insulation and windows (B /year) Target Scenario - Deep Renovation Traget Scenario - Shallow Renovation + REN Shallow Renovation Figure 44: Annual investment costs for insulation and windows in the three scenarios created by Ecofys for energy efficiency in the EU27 [42]. Firstly to account for this, the hot water demand is not reduced in the HRE-EE scenario for the following reasons: 1. Table 10 and Figure 45 indicate that population will grow by 3.2% between 2010 and According to a number of interviews with industry experts, people tend to wash more today than they did in the past, which is likely to continue into the future. In other words, individuals are likely to take more showers and baths in the future than they do today. 3. People are not expected to live with one another as much in the future. Hence, there will be a larger number of people living in their own houses rather than living together. This is also expected to increase the demand for hot water for an individual. 4. At present, there are regions in Europe where the use of hot water is limited due to technical and financial limitations. As these regions become wealthier, the demand for hot water is expected to rise in these regions. 5. The building area for residential and non-residential buildings is expected to grow by 32% and 42% respectively between 2015 and 2050 (see Table 11). 84
86 For these reasons, the hot water demand is not expected to decrease in this study, even with appliances that use less water, pipes with more insulation, and better hot water management in buildings. Therefore, it is assumed here that the hot water will increase rather than decrease. It is unlikely that the hot water demand will increase as fast as the building area, since people will live in larger houses and use the hot water more efficiently. However, it is unlikely that the hot water demand will increase at a lower rate than the population, for the reasons outlined in 1-4 above. Therefore, it is assumed here that the hot water demand will grow at a rate between the residential floor area and the population. Residential floor area Non-Residential floor area Population EU-EE Hot Water HRE-EE Hot Water 2.0% Annual Average Growth Rate (%/year) 1.0% 0.0% -1.0% -2.0% -3.0% -4.0% Figure 45: Average annual growth rates for the residential floor area, non-residential floor area, population, the original EU-EE scenario hot-water demand, and the new hot water demand assumed for the HRE-EE scenario (which is based on the average annual growth rate for the residential floor area and the population). The new hot water demand grows by 16% between 2015 and 2050 instead of reducing by 55% as in the original hot water demand projection for the EU-EE scenario, as outlined in Figure 46. The specific hot water demand now drops from approximately 27 kwh/m 2 in 2015 to 23 kwh/m 2 in 2050, instead of from 27 kwh/m 2 to 9 kwh/m 2 as in the EU-EE scenario. 85
87 EU-EE Hot Water EU-EE Hot Water HRE-EE Hot Water HRE-EE Hot Water Hot Water Demand (TWh/year) 1, Specific Hot Water Demand (---, kwh/m2) Figure 46: Original hot water demand in the EU-EE scenario and the new hot water demand for the HRE-EE scenario, along with the corresponding specific hot water demands (dotted lines). For the space heating demand, the reductions achieved in the Deep Renovation scenario of the EURIMA report [42] are likely to cost significantly less than those proposed in the EU-EE scenario. Hence, a reduction of 47% in the total space heating demand is assumed here, instead of 62%. It is important to note that one significant difference between the Deep Renovation scenario and the EU- EE scenario is the space heating demand in As outlined in Figure 47, this is approximately 2,600 TWh in the Deep Renovation scenario, but it is approximately 3,200 TWh in the EU-EE scenario. Looking at actual historical data from the International Energy Agency (IEA) indicates that the total heat demand for both space heating and hot water in 2010 was approximately 3,300 TWh (as displayed in Figure 8). Data from the EU-EE scenario indicates that the hot water demand is approximately 800 TWh in 2015 (see Figure 46). Assuming the same hot water demand is the same in the IEA 2010 data, then the space heating demand for the EU27 was approximately 2,700 TWh in Although this means that the heat demand in the Deep Renovation scenario is more likely closer to the current situation in Europe than the EU-EE scenario, the HRE-EE heat demand created for this study uses the same starting point as the EU-EE scenario. This is to make the results of this study comparable to the analysis in the EU-EE scenario since the principal objective here is to compare a scenario with energy efficiency only to a scenario with both energy efficiency and district heating. The final space heating demand assumed in the new HRE-EE scenario is outlined in Figure
88 Space Heating Demand (TWh/year) 3,500 3,000 2,500 2,000 1,500 1, Deep Renovation (Ecofys) EU-EE Scenario HRE-EE Scenario IEA 2010* Figure 47: Space heating in the EU-EE scenario from the Energy Roadmap 2050 report [9], the Deep Renovation scenario form Ecofys [42], and the new space heating demand assumed in the HRE-EE scenario. *This space heating demand is estimated based on the total heat demand from the 2010 EU27 IEA Energy Balance minus the hot water demand identified from the PRIMES data for The final total heat demand for the new HRE-EE scenario assumed in this study is outlined in Figure 48: there is a total reduction of 34% between 2015 and 2050 in the HRE-EE scenario instead of 61% as originally proposed in the EU-EE scenario. 4,500 HRE-EE Scenario EU-EE Scenario Total Heat Demand (TWh/year) 4,000 3,500 3,000 2,500 2,000 1,500 1, Figure 48: Total heat demand for the EU-EE and HRE-EE scenarios for
89 The cost for the energy efficiency measures also need to be adjusted downwards from the B 295/year in the EU-EE scenario, since there are now less energy efficiency measures in the HRE-EE heat demand forecast. To do so, an energy efficiency cost curve, which is displayed in Figure 49, has been utilised. This cost curve was developed based on data from the Danish Research Building Institute [43] and a Danish Heat Atlas [44, 45]. The costs reflect the additional cost of energy efficiency measures, which means that they are implemented at the same time as other renovations which are taking place in the building. Assuming a 3% interest rate and an average lifetime of 30 years for these energy efficiency measures, indicative annual costs of implementing energy efficiency measures in the EU27 have been estimated in Figure 50. These are indicative only since they reflect total energy savings and not the reduction in specific heat demand. However, these results demonstrate how the unit cost of energy savings increases as more savings are implemented. For example, the first B 200/year on energy savings in Europe will achieve savings of approximately 53%, while investments of B 400/year will only achieve 22% more at 75% Additional Cost of Energy Efficiency Measures ( /kwh Saved) % 10% 20% 30% 40% 50% 60% 70% 80% Heat Demand Reduction (%) Figure 49: Additional costs for energy efficiency measures that reduce the heat demand by different percentages based on Danish buildings (scenario C) [43]. Additional means it is assumed that these are the extra costs of completing the energy efficiency measures at the same time as implementing other building refurbishments. 88
90 Annual Additional Costs of Energy Savings in the EU27 (B /year) % 10% 20% 30% 40% 50% 60% 70% 80% Heat Demand Reduction (%) Figure 50: Annual additional costs for energy efficiency measures that reduce the heat demand by different percentages based on Danish buildings (scenario C) [43], an interest rate of 3%, and assuming an average lifetime of 30 years. These are indicative only as they not consider the change in specific heat demand, but instead it considers the change in total heat demand. As displayed in Figure 40, there is a total reduction of approximately 70% in the specific heat demand in the EU-EE scenario, equating to total savings of 2,460 TWh. Assuming a cost of 2.4/kWh (18 DKK/kWh) based on the data in Figure 49, a 3% interest rate, and an average lifetime of 30 years for the energy efficiency measures, the annual costs of implementing the energy efficiency measures in the EU-EE scenario are calculated as approximately B 303/year. This is very similar to the costs suggested in the EU Energy Roadmap report of B 295/year, although as mentioned previously the B 295/year may include savings in other sectors such as electricity and transport. Using the same assumptions, the costs for the energy efficiency measures in the new heat demand scenario can also be estimated. In the HRE-EE scenario, there is a 51% reduction in the specific heat demand between 2015 and 2050, equating to a total energy saving of 1,215 TWh. Assuming a cost of 1.9/kWh (14 DKK/kWh), this means that the total annual costs for energy efficiency measures in this scenario are approximately B 133/year. Comparing this to the annual investment costs estimate by Ecofys in the EURIMA report [42] suggests that this is a 17% underestimation of the total energy efficiency costs required. As displayed earlier in Figure 44, the average annual investments required in the Deep Renovation scenario (for a 47% reduction in space heating) are approximately B 160/year. This difference warrants further investigation in the future, but based on these comparisons, the indicative costs provided by the unit costs in Figure 49 are deemed an adequate representation of the variation in costs as more energy efficiency measures are implemented. Overall, the EU-EE scenario is extremely ambitious in terms of energy efficiency, since it will be extremely difficult and expensive to achieve. Hence, a new heat demand has been created for this 89
91 study, which is also very ambitious in terms of energy efficiency since it follows the space heating recommendations of the Deep Renovation scenario created for EURIMA [42]. This new HRE-EE heat demand will be used to investigate the feasibility of district heating in an EU energy system with very low heat demands for residential and services buildings. 5.2 REPLACING INDIVIDUAL BOILERS WITH DISTRICT HEATING After creating a new heat demand for the HRE-EE scenario, individual boilers could then be replaced with district heating. In the EU-EE scenario, district heating provides 12.8% of the heat demand for residential and services buildings in 2030 and 13.3% in 2050 [12]. In the HRE-EE scenario, the share of district heating is increased to 30% in 2030 and 50% in 2050, as outlined in Table 12. Table 12: Individual and district heating demands in the EU-EE and HRE-EE (before and with the district heating expansion) scenarios for the years 2030 and Scenario Individual Heat Demand (TWh) District Heating Heat Demand (TWh) District Heating Production (TWh) Total Heat Demand (TWh) 2030 EU-EE 2, ,715 HRE-EE Before the 3, ,477 DH Expansion HRE-EE 2,434 1,043 1,268* 3, EU-EE 1, ,584 HRE-EE Before the 2, ,648 DH Expansion HRE-EE 1,324 1,324 1,571* 2,648 *Includes an additional 17% in network losses for all new district heating systems. It is assumed here that individual heat pumps are not replaced by district heating since these are also considered a key decarbonisation technology for the EU27 energy system. Therefore, there is the same amount of individual heat pumps in the EU-EE scenario as in the HRE-EE scenario. There is an underlying assumption here that individual heat pumps are also placed outside the urban areas where district heating is implemented. Inside the urban areas, it is assumed that coal, oil, gas, biomass, and electric boilers are replaced by district heating. As a result, Figure 51 indicates that there is a lower fossil fuel and biomass consumption for individual boilers in the HRE-EE scenario than in the EU-EE scenario, even though the heat demand is larger in the HRE-EE scenario. The volume of each type of boiler that is replaced by district heating is currently unclear, so in the HRE-EE scenario the different boilers have been replaced by district heating proportional to the heat demand they satisfy. 90
92 Fuel Demand for Heating Individual Residential and Services Buildings (TWh/year) 3,000 2,500 2,000 1,500 1, EU-EE HRE-EE EU-EE HRE-EE Electricity Solar Biomass Gas Oil Solids Figure 51: Fuel consumption by individual boilers in the EU-EE and HRE-EE scenarios for the years 2030 and The cost of transforming individual boilers into district heating is estimated here based on the number of boilers replaced, the size of these boilers, and the heat demand replaced. The number of boilers has been estimated using the BEAM tool developed by Ecofys (see Annex III). Table 13 displays the number of residential boilers in the EU-EE and HRE-EE scenarios for the years 2030 and 2050, while Table 14 displays the number of services boilers for the same. Both Table 13 and Table 14 illustrate the decrease in the total number of individual boilers in the HRE-EE scenario, the same number of heat pumps in both the EU-EE and HRE-EE scenario, and the increase in the number of district heating substations in the HRE-EE scenario. Table 13: Number of residential boilers (million units) for the EU-EE and HRE-EE scenarios for the years 2030 and 2050 (Million) Oil Gas Pellet/ Coal Direct Electricity Air Heat Pump Brine Heat Pump District Heating Substation 2030 EU-EE HRE-EE EU-EE HRE-EE Total 91
93 Table 14: Number of services boilers (million units) for the EU-EE and HRE-EE scenarios for the years 2030 and (Million) Oil Gas Pellet/ Coal Direct Electricity Air Heat Pump Brine Heat Pump District Heating Substation 2030 EU-EE HRE-EE EU-EE HRE-EE Since the HRE-EE scenario has a higher heat demand than the EU-EE scenario, the individual heating systems are assumed to have larger heat capacities in the HRE-EE scenario. As the specific heat demand is also reducing over time in both the EU-EE and HRE-EE scenarios, the individual boiler capacities are reduced between 2010 and Similarly, the investment costs for individual boiler units are lower in the EU-EE scenario than the HRE-EE scenario. The final average boiler capacities and investment costs assumed are outlined in Table 15 for residential boilers and Table 16 for services boilers. These have been estimated based on previous Danish experiences [4, 5] and inputs from Ecofys (see section 1.2 in Annex III). Table 15: Average thermal capacities and corresponding investment costs assumed for residential boilers in the EU-EE and HRE-EE scenarios for the years 2030 and Total Oil Gas Pellet/ Coal Air Heat Pump Brine Heat Pump Direct Electricity District Heating Substations Average Size of Residential Boilers (kwth) EU-EE HRE-EE EU-EE HRE-EE Specific Investment for Residential Boilers (k /unit) * EU-EE * 2030 HRE-EE * 2030 EU-EE * 2050 HRE-EE * *Includes the cost of a meter and a branch pipe from the district heating network to the building. 92
94 Table 16: Average thermal capacities and corresponding investment costs assumed for services boilers in the EU-EE and HRE-EE scenarios for the years 2030 and Oil Gas Pellet/ Coal Air Heat Pump Brine Heat Pump Direct Electricity District Heating Substations Average Size of Services Boilers (kw th ) EU-EE HRE-EE EU-EE HRE-EE Specific Investment for Services Boilers (k /unit) * EU-EE * 2030 HRE-EE * 2030 EU-EE * 2050 HRE-EE * *Includes the cost of a meter and a branch pipe from the district heating network to the building. 93
95 To annualise the boiler costs, technical lifetimes were also assumed for each type of boiler as outlined in Table 17. In addition, Table 17 indicates the fixed and marginal O&M costs assumed for each type of boiler. Table 17: Other financial assumptions for residential and services boilers for both the EU-EE and HRE-EE scenarios in the years 2030 and Technical lifetime (years) Fixed O&M ( /unit/year) Variable O&M ( /MWh) Technical lifetime (years) Fixed O&M ( /unit/year) Variable O&M ( /MWh) Oil Gas Pellet/ Coal Air Heat Pump Brine Heat Pump Direct Electricity District Heating Substations Residential Boilers Services Boilers ,0 00 1,5 40 3, , Direct electric heating is also replaced by district heating in this study. These systems do not have central heating systems in the buildings already, so the additional cost of the central heating system also needs to be considered in the economic calculations. The costs assumed for central heating systems are outlined in Table 18. Table 18: Costs assumed for central heating systems in the EU-EE and HRE-EE scenarios for the years 2030 and Cost Residential Services Specific investment (1000 /unit) Technical lifetime (years) Fixed O&M ( /unit/year) Variable O&M ( /MWh) 0 0 The costs assumed for the district heating network are outlined in Table 19. It is assumed that all district heating proposed in the EU-EE scenario is conventional district heating, since there is no increase in the market share for district heating in the EU-EE scenario. However, from a cost point of view, all additional district heating constructed in the HRE-EE scenario is assumed to be lowtemperature district heating [44] (see Table 20). As presented in Table 19, this means that the additional district heating in the HRE-EE scenario has investment costs over 7 times more per unit of heat demand met than the conventional district heating used today. Hereby, the highest marginal cost for the expansion is used as an estimate for the average cost of the whole expansion. This very 94
96 conservative assumption is made, since we have not yet completed a thorough assessment of the actual investment cost for the future heat distribution from the European heat atlas in Figure 14. In reality, if the HRE-EE scenario is implemented, then there will be an expansion of both conventional and low-temperature district heating in the future, so this can be seen as a worst case scenario in terms of the district heating pipeline costs. Although low-temperature district heating is not in use today, it is expected to grow in the future since the heat demands in the buildings will reduce and also, so that low-temperature heat sources can be utilised by district heating networks. Table 19: Financial assumptions for conventional and low-temperature district heating assumed in the EU-EE and HRE-EE scenarios [45]. Conventional District Heating Network for a heat demand of >120 TJ/km 2 Low-temperature district heating for a heat demand of TJ/km 2 Specific Investment costs* 72, ,000 # (1000 /TWh of heat demand) Technical lifetime (years) Average Fixed O&M ( /TWh/year) 900,000 3,960,000 Variable O&M ( /MWh) 0 0 *Branch pipes to the buildings are not included here, but instead are included in the district heating substation costs. #This cost represents the price per unit of heat delivered. It is important to recognise that the difference between conventional and lowtemperature district heating is very large since low-temperature district heating is assumed to supply buildings with lower heat demands. Therefore, the cost per metre of district heating pipelines is not reflected here, but the cost per unit of heat supplied. Table 20: Type of district heating assumed in the EU-EE and HRE-EE scenarios for the years 2030 and Heat Demand (TWh) Conventional District Heating Network for a heat demand of >120 TJ/km2 Low-temperature district heating for a heat demand of TJ/km2 Total EU-EE HRE-EE * 697 1,043 EU-EE HRE-EE * 1,059 1,324 *Conventional district heating supplies the same market share in the HRE-EE scenarios as in the EU-EE scenario, but the heat demand is higher since there are less energy efficiency measures. Based on these assumptions, the annual investments and operation costs for heating networks and consumer installations for the EU-EE and HRE-EE scenarios are displayed in Figure 52. The investment costs for the individual boiler units are the dominant cost in all scenarios considered, representing approximately 70% of the total costs on average. This is followed by the central heating system costs, which represent approximately 25% of the total costs in all scenarios. Although the costs assumed for the district heating network in the HRE-EE scenario are very high (see Table 19), these only represent approximately 10% of the total costs in 2050 when there is a 50% district heating market share. However, the total annual costs are still higher in both HRE-EE scenarios and the costs of the production units still need to be added to these scenarios. 95
97 Annual Costs for Heating Networks and Consumer Installations (B /year) Residential Individual Units Residential Central Heating Systems Services Individual Units Services Central Heating Systems District Heating Network EU-EE HRE-EE Figure 52: Annual investment and operation costs for heating networks and consumer installations for the EU- EE and HRE-EE scenarios in the years 2030 and REPLACING INDIVIDUAL COOLING WITH DISTRICT COOLING The cooling demand in the EU-EE scenario is approximately 15% of the heat demand between 2010 and 2050, so less emphasis is placed on cooling in this report. However, based on a forecast from the EU project RESCUE [46], it is assumed here that district cooling can supply 10% of the cooling demand in 2030 and 20% in 2050 in the HRE-EE scenario (see Figure 53). No information was identified or developed in this study to specify exactly how this district cooling would be provided. Therefore, it is simply assumed that 50% of the district cooling is from natural cooling and 50% is from absorption heat pumps. 96
98 Cooling Demand for Residential and Services Buildings (TWh) Electricity Natural Cooling Absorption Cooling EU-EE HRE-EE EU-EE HRE-EE Figure 53: Cooling demand by fuel source for residential and services buildings in the EU-EE and HRE-EE scenarios for the years 2030 and It is assumed that the compression heat pumps have a COP of 2 [45], and so the electricity demand for cooling is half the cooling demand (see Figure 54). However, the absorption heat pumps only have a COP of 0.6 [47] and so there is an additional heat demand of 30.5 TWh in 2030 and 54 TWh in 2050 from the district heating network. Fuel Demand for Cooling Residential and Services Buildings (TWh) Electricity Natural Cooling Heat for Absorption Cooling EU-EE HRE-EE EU-EE HRE-EE Figure 54: Fuel demand for cooling residential and services buildings in the EU-EE and HRE-EE scenarios for the years 2030 and The costs for district cooling are difficult to estimate since there is currently very little data available for cooling demands. However, since the cooling demand is very small compared to the heating 97
99 demand, the costs are also less significant. For cooling that is provided by electricity, it is assumed that an air-to-water heat pump is utilised with the investment costs outlined in Table 21. Table 21: Financial assumptions for air-to-water heat pumps which use electricity to provide cooling in the EU- EE and HRE-EE scenarios. Individual heat pump air-to-air Average Size (kw cooling ) 267 Specific investment (1000 /unit) 240 Technical lifetime (years) 20 Fixed O&M ( /unit/year) 400 Variable O&M ( /MWh) 0 The number of cooling units has been estimated for 2010 based on an assumed average cooling capacity of 267 kw cooling /unit and a total estimated cooling capacity in the EU of 275 GW [48]. Then, the total cooling capacity is increased proportionately to the cooling demand for the years 2030 and 2050, as displayed in Table 22. Similarly, it is then assumed that the number of individual heat pump units replaced in the HRE-EE scenario is proportionate to the cooling demand replaced with district cooling. Table 22: Assumptions used to estimate the number of individual cooling units and the capacity of individual heat pumps in the EU-EE and HRE-EE scenarios for the years 2030 and Total Cooling Demand (TWh) Estimated Cooling Capacity Installed in 2010 (MW Cooling ) 275, , ,692 Cooling Capacity of a Heat Pump (kw Cooling ) Number of Heat Pumps Required in the EU-EE scenario 1,031,250 1,166, ,346 District Cooling in the HRE-EE scenario (%) 0% 10% 20% District Cooling in the HRE-EE scenario (TWh) Number of Heat Pumps Replaced with District Cooling in the 0 116, ,269 HRE-EE scenario Individual Heat Pump Capacity Replaced with District Cooling 0 31,102 49,138 (kw Cooling ) Centralised Absorption Heat Pump Capacity Required in the HRE-EE scenario (kw Cooling ) 0 23,327 36,854 The cost of natural cooling is assumed to be 150% of the cost for conventional district heating networks, while the additional district heating demand for absorption cooling is provided by lowtemperature district heating (see Table 19). It is not possible to be specific about the breakdown of cooling units used for district cooling since it is often composed of backup chillers and absorption heat pumps. Therefore, here it is assumed that 75% of the individual heat pump capacity replaced by district cooling is rebuilt as centralised absorption heat pumps (see Table 22) using the costs outlined in Table
100 Table 23: Financial assumptions for the centralised absorption heat pumps used to provide district cooling in the EU-EE and HRE-EE scenarios: based on the costs for thermal absorption heat pumps in [45]. Specific investment (M /MW Cooling ) 0.97 Lifetime (years) 20 Fixed O&M (% of Investment) 5.00% The costs assumed here will need to be investigated in more detail in the future, but it is a sufficient proxy for this study since the cooling systems costs (Figure 55) are less than 10% of the heating system costs (Figure 52). Individual Units District Cooling Network District Cooling Production Plants Annual Costs for Cooling Networks and Consumer Installations (B /year) EU-EE HRE-EE EU-EE HRE-EE Figure 55: Annual cooling system costs for the EU-EE and HRE-EE scenarios for the years 2030 and ADDING DISTRICT HEATING PRODUCTION UNITS Now the total district heating demand has been defined for the HRE-EE scenarios, which includes district heating for hot water and space heating (section 5.1) as well as district heating for absorption heat pumps for district cooling (section 5.2). The next step is to define the capacities for the production units in the HRE-EE scenarios, which are displayed in Table 24. It is assumed that half of the district heating expansion in the HRE-EE scenarios will be decentralised and so, this will require the construction of new relatively small CHP plants. These are assumed to be MW gas power plants with an average electrical efficiency of 50% and an average thermal efficiency of 40% [47]. The remaining district heating is provided by centralised CHP plants that either already exists or are created by converting existing electricity-only power plants. It is assumed that the fuel mix for these power plants in the HRE-EE scenarios are the same as the fuel mix already defined for CHP plants in the EU-EE scenarios for 2030 and
101 Table 24: District heating production unit capacities assumed in the EU-EE and HRE-EE scenarios for the residential and services sectors for the years 2030 and Assumed Efficiencies [47] EU-EE HRE-EE EU-EE HRE-EE District Heating Production for Boiler Only Systems (TWh) n/a Boilers for Boiler Only Systems (MW th ) Other District Heating Production (TWh) CHP (MW e ) 2030: η thermal = 80% 2050: η thermal = 81.5% 17,089 21,750 3,190 5,364 n/a ,571 Centralised: 2030 η elec =40% & η thermal =45% 2050 η elec =45% and η thermal =45% 33, ,570 25, ,916 Decentralised: η elec =50% and η thermal =45% Backup Boilers* (MW th ) η thermal =90% 105, ,850 57, ,230 Heat Pumps (MW e ) COP = , ,000 Thermal Storage # (GWh) n/a *Assuming a boiler capacity that is 20% greater than the maximum heat demand. # Assuming a thermal storage capacity that is 17% of the average daily heat supply into the network [49]. 5.5 ADDING ADDITIONAL RESOURCES TO SUPPLY HEAT TO THE DISTRICT HEATING NETWORK By adding district heating networks to the energy system, it is possible to utilise a number of additional resources that could otherwise not be utilised. As displayed in Figure 56, the following additional heat production is provided by unconventional resources in the HRE-EE scenario: Industrial surplus heat: 100 TWh/year Direct geothermal heat: 100 TWh/year Waste incineration: 150 TWh/year Large-scale solar thermal: 100 TWh/year These values have been determined based on the mapping discussed in chapter 3. This is a conservative estimate of the additional heat that could be utilised for district heating in the future. It does not consider the surplus heat that is likely to be available from a number of new technologies such as bioethanol plants, biomass gasification facilities, and large-scale electrolysers. The costs assumed for the unconventional resources utilised in the HRE-EE scenarios are outlined in Table
102 Industry Waste Incineration^ Geothermal Large-Scale Solar Heat Available from Unconventional Resources due to District Heating* (TWh/year) EU-EE HRE-EE EU-EE HRE-EE Figure 56: Heat from unconventional resources in the EU-EE and HRE-EE scenarios for the years 2030 and *In the Energy Efficiency scenario it is assumed that these resources will remain the same as 2010 levels, since there is no growth in district heating. ^Includes waste incineration heat for industry. Table 25: Unit cost for the unconventional resources added to the HRE-EE scenario. Investment Costs (M /TWh) Annual Fixed O&M Costs (% of investment) Lifetime (years) Industrial Surplus Heat 40* 1 30 Direct Geothermal Heat 216* Waste Incineration 250 # Solar Thermal 440* *These investment costs are expressed in terms of the heat delivered. # These investment costs are expressed in terms of the input resource. 5.6 UTILISING THE SAME AMOUNT OF BIOMASS AS THE EU-EE SCENARIO Biomass will be a very valuable resource in future sustainable energy systems [50] since it is a limited resource and also, the only renewable energy than can directly substitute all forms of fossil fuels: biomass for coal, biogas for natural gas, and biofuels for oil. The HRE-EE scenario uses less biomass in individual boilers than the EU-EE scenario, which was already displayed in Figure 51. However, the same amount of biomass is utilised in the HRE-EE scenario as in the EU-EE scenario by converting centralised boilers for district heating from natural gas to biomass. 5.7 UTILISING THE ADDITIONAL FLEXIBILITY OF THE HRE-EE SCENARIO The EU-EE scenario has a small share of district heating (10-15% of the heat demand), but otherwise the electricity and heat sectors are not significantly interconnected. As a result, the energy system in the EU-EE scenario is more segregated like the energy system displayed in Figure
103 Resources Conversion Exchange and Storage Demand Mobility Power Exchange Fuels Power-Only Plants Electricity Cooling Heat-Only Boilers Heating Figure 57: Interaction between sectors and technologies in segregated energy systems [51]. In contrast, the energy system in the HRE-EE scenarios contains a lot of district heating with thermal storage facilities and large-scale heat pumps. As a result, the electricity and heat sectors are more interconnected like the energy system displayed in Figure 58. This means that the overall system is more flexible and it can accommodate larger amounts of intermittent renewable energy such as wind power. 102
104 Resources Conversion Relocation Exchange and Storage Demand Fuel Storage Wind etc. Fluctuating Electricity Power Exchange Mobility Electricity Electricity Storage Fuels CHP (or Quad) Heat Pump Cooling Thermal Storage Heating Solar etc. Fluctuating Heat Figure 58: Interaction between sectors and technologies in a future sustainable energy system [52]. Critical excess electricity production (CEEP) measures the amount of intermittent renewable energy that cannot be utilised on an annual basis in an energy system. It occurs when there is an over production of electricity from intermittent electricity resources such as wind power and photovoltaic units during different hours of the year. In the HRE-EE scenarios, these hours can be accommodated more often than in the EU-EE scenario, since the HRE-EE scenario contains large-scale thermal storage and heat pumps in the district heating system. To reflect this, the wind power capacity is increased in the HRE-EE scenario until the level of CEEP is the same as in the EU-EE scenario. 5.8 SUMMARY The HRE-EE scenario has a higher heat demand than the EU-EE scenario and it utilises more district heating and cooling instead of individual units in 2030 and 2050 (see Figure 59 and Figure 53 respectively). As a result, Figure 51 indicates that the HRE-EE scenario uses less fuel for heating residential and services buildings, but Figure 60 shows that there is more much more fuel consumed for district heating production in the HRE-EE scenario. Furthermore, Figure 52 and Figure 55 show that the cost of the heating and cooling systems is now higher in the HRE-EE scenario than the EU-EE scenario, and these costs do not include for the production units for district heating discussed in section 5.3. Therefore, the energy system analysis, which is discussed in chapter 6, will indicate if this reduction in fuel costs in the HRE-EE scenario along with a reduction in energy efficiency costs will offset the increase in the investment costs for the heating and cooling system as well as for the district heating production units. In this way, the final HRE-EE scenario is a mix of energy efficiency and district heating, which aims to produce a similar level of CO 2 emissions as the EU-EE scenario. 103
105 Heat Demand for Residential and Services Buildings (TWh/year) 4,000 3,500 3,000 2,500 2,000 1,500 1, EU-EE HRE-EE EU-EE HRE-EE Geothermal Heat Pumps Direct Electricity Solar Biomass Gas Oil Solids District Heating Figure 59: Heat demand by fuel for residential and services buildings in the EU-EE and HRE-EE scenarios for the years 2030 and District Heating Supply for Residential and Services Buildings (TWh/year) 1,800 1,600 1,400 1,200 1, EU-EE HRE-EE EU-EE HRE-EE Industry Waste Geothermal Solar Heat Pumps Boiler CHP Figure 60: District heating production by plant type in the EU-EE and HRE-EE scenarios for the years 2030 and Note: some of the district heating is used by absorption heat pumps to provide cooling as discussed in section
106 6 ENERGY SYSTEM ANALYSIS OF THE HRE SCENARIO The energy systems analysis considers the design of the heating system in the context of the whole energy system. In future sustainable energy systems this is an essential consideration as integrating the different sectors (i.e. electricity, heat, and transport) can provide excellent opportunities for integrating intermittent renewable energy such as wind and solar (see Annex VI). Using the EnergyPLAN tool discussed in section 2.2, the primary energy supply (PES) and the CO 2 emissions have been estimated for both the EU-EE and HRE-EE scenarios in the years 2030 and As displayed in Figure 61, the PES is slightly larger in the HRE-EE scenario (~2%), but the fossil fuel and biomass consumption in both scenarios is the same (<1% difference). As a result, the carbon dioxide emissions in both scenarios are also the same. The slightly larger PES in the HRE-EE scenario is due to the additional resources utilised in the district heating network such as waste incineration, geothermal, and large-scale solar thermal (see Figure 56). The HRE-EE scenario can also utilise approximately 5% more wind power than the EU-EE scenario due to the additional flexibility introduced into the system by integrating the electricity and heat sectors (see section 5.6). 18,000 Nuclear Coal Oil Gas Biomass Waste RES 3,000 Primary Energy Supply (TWh/year) 15,000 12,000 9,000 6,000 3,000 2,500 2,000 1,500 1, Carbon Dioxide Emissions (X, Mt/year) 0 EU-EE HRE-EE EU-EE HRE-EE Figure 61: Primary energy supply and carbon dioxide emissions for the EU-EE and HRE-EE scenarios in the years 2030 and Figure 62 presents the PES for heating and cooling in buildings separate to the rest of the energy system. Once again, these results indicate that both the EU-EE and HRE-EE scenarios have the same 105
107 level of biomass and fossil fuel consumption in 2030 and 2050, so the additional heat demands in the HRE-EE scenario are met using CO 2 neutral resources. The HRE-EE scenario utilises a lot of large-scale heat pumps in the district heating system since there is a very large amount of surplus electricity production in the original EU-EE scenario. It is likely that there would be fewer large-scale heat pumps in a system optimised for the integration of intermittent renewable energy. Primary Energy Supply for Heating and Cooling in Residential and Services Buildings (TWh/year) 6,000 5,000 4,000 3,000 2,000 1,000 0 EU-EE HRE-EE EU-EE HRE-EE Industry Surplus Heat Geothermal for DH Surrounding Heat for HPs Solar Thermal Wind Power Waste Biomass Gas Oil Coal Figure 62: Primary energy supply for heating and cooling in residential and services buildings in the EU-EE and HRE-EE scenarios for the years 2030 and Figure 63 indicates that the HRE-EE scenario has lower annual costs than the EU-EE scenario, while achieving the same level of PES and CO 2 emissions. Both scenarios have very similar fuel, O&M, and CO 2 emission costs, but the HRE-EE scenario reduces the investment costs by approximately 10%. 106
108 1,400 Investment Fuel Fixed O&M Variable O&M CO2 1,200 Total Costs (B /year) 1, EU-EE HRE-EE EU-EE HRE-EE Figure 63: Total annual energy system costs for the EU-EE and HRE-EE scenarios in the years 2030 and The source of these investment savings is more evident when the costs for heating and cooling buildings are separated from the whole energy system costs (see Figure 64). The HRE-EE scenario saves a lot of money on energy efficiency investments, which result in higher heat demands. However, to overcome these savings the HRE-EE scenario has higher shares of district heating and cooling, larger individual boilers, and it produces more heat. Therefore, the heating system, cooling system, and fuels are more expensive in the HRE-EE scenario than the EU-EE scenario. However, Figure 64 indicates that these additional costs are offset by the reduced energy efficiency investments, so the total cost of heating and cooling for buildings in the HRE-EE is ~15% cheaper than in EU-EE scenario. 107
109 Total Costs for Heating and Cooling in the Residential and Services Sectors (B /year) End-Use Energy Efficiency Investments Heating System Investments Cooling System Investments Centralised Electricity & Heat Plants Fuel CO EU-EE HRE-EE EU-EE HRE-EE Figure 64: Total annual costs for heating and cooling in the residential and services sectors for the EU-EE and HRE-EE scenarios in the years 2030 and As discussed in section 5.1, the investment costs for energy efficiency measures are very difficult to estimate, particularly for the entire EU27. In this study, a cost curve has been used based on Danish experiences to estimate the cost of the energy efficiency measures in the EU-EE and HRE-EE scenarios created (see Figure 49). Afterwards, these estimates have been validated based on data in the Energy Roadmap 2050 report [9] and based on inputs from Ecofys [42]. Since the energy efficiency measures are the primary source of savings in the HRE-EE scenario, it is important to recognise that the energy efficiency costs assumed in this study are additional costs. In other words, it is assumed that all of these energy efficiency measures are carried out at the same time as other renovations are taking place in the building. If these energy efficiency measures cannot be carried out at the same time as other renovations, then they are referred to as direct costs. As outlined in Figure 65, the cost per unit of heat saved is approximately double for direct energy efficiency measures as for additional energy efficiency measures. If these costs were assumed in this study, then the investment costs for energy efficiency measures in the EU-EE scenario would be approximately B 600/year instead of B 300/year. In reality, it is likely that the actual costs for energy efficiency measures will be somewhere between these two cost curves. In the beginning there will be a lot of opportunities to implement energy efficiency measures so these can be done at the same time as the buildings are renovated for other purposes. Fewer opportunities will be available as more buildings are renovated and eventually, it is likely that buildings will have to be renovated specifically for the purpose of energy efficiency measures. Hence, the costs will move from additional costs to direct costs. This is also highlighted in the EU Energy Roadmap report, which concludes that A clear result concerning the strategic energy efficiency direction is that a substantial speeding up of energy efficiency improvements from historical trends is crucial for achieving the decarbonisation objective [12]. Therefore, the key point here is that 108
110 the costs assumed for energy efficiency measures in this study can be considered conservative, especially for the EU-EE scenario Additional Cost of Energy Efficiency Measures ( /kwh) Direct Cost of Energy Efficiency Measures ( /kwh) 5.00 Cost ( /kwh) % 10% 20% 30% 40% 50% 60% 70% 80% Heat Demand Reduction (%) Figure 65: Additional and direct costs for energy efficiency measures that reduce the heat demand by different percentages based on Danish buildings (scenario C) [43]. Similarly, low-temperature district heating in low heat density areas is assumed when estimating the distribution cost of all additional district heating added to the HRE-EE scenario (see Table 20). The highest marginal distribution cost for low-temperature district heating is approximately seven times more expensive per unit of heat delivered than conventional district heating (see Table 19). Even with substantial energy savings, many high-density urban areas will have heat demands which are similar to those in conventional district heating networks today (see Figure 15). Therefore, the costs of these district heating networks are likely to be much lower than assumed in this study, so this can also be considered as a very conservative estimate from a HRE-EE perspective. To illustrate these sensitivities, the heating and cooling costs have been recalculated assuming an equal share of additional and direct energy efficiency measures in 2050, along with a higher share of conventional district heating: it has been increased from a share of 20% in the original HRE-EE scenario to a share of 40% based on the heat densities forecasted for the EU27 using the European Heat Atlas (see Figure 14). This reduces the cost of district heating pipes in the HRE-EE scenario by 20%, but since the district heating pipes account for a relatively small proportion of the total heating costs (see Figure 52), the overall heating system costs are only reduced by 2%. Based on this sensitivity analysis, the results presented in Figure 66 indicate that: 109
111 1. The total heating and cooling costs savings reported here for the HRE-EE scenario are conservative: in 2050 the HRE-EE scenario is ~15% but with a more pessimistic outlook for energy efficiency costs and optimistic outlook for district heating costs, the cost savings in the HRE-EE scenario would be ~22%. 2. The total heating and cooling costs are very sensitive to variations in the costs for energy efficiency, but very robust against costs for district heating pipelines. Therefore, utilising a combination of energy efficiency and district heating reduces the economic risks for the EU27. Energy Efficiency Investments Cooling System Investments Heating System Investments Centralised Electricity & Heat Plants Total Costs for Heating and Cooling in the Residential and Services Sectors (B /year) Fuel No DH Expansion Marginal Efficiency Costs High DH Expansion Costs# Marginal Efficiency Costs CO2 No DH Expansion Direct & Marginal Efficiency Costs* Realistic DH Expansion Costs^ Direct & Marginal Efficiency Costs* EU-EE HRE-EE EU-EE HRE-EE Original Scenarios Sensitivity Analysis Figure 66: Total annual costs for heating and cooling in the residential and services sectors for the EU-EE and HRE-EE scenarios in 2050 for different energy efficiency and district heating cost assumptions. *Represents a scenario with 50% additional energy efficiency costs and 50% direct energy efficiency costs (see Figure 65). # Assumes that all additional district heating in the EU27 is in areas with a heat density less than 50 TJ/km 2. ^Based on forecasted heat densities in the European Heat Atlas (Figure 14). Finally, from a technical point of view, the HRE-EE scenario also provides a more robust alternative. In the EU-EE scenario, the CO 2 emission target for 2050 is highly dependent on the implementation of significant energy savings. As outlined in the EU Energy Roadmap report, Energy efficiency tends to show better results in a model than in reality. Energy efficiency improvements are often hampered by split incentives, cash problems of some group of customers; imperfect knowledge and foresight leading to lock-in of some outdated technologies [11]. This indicates that the EU-EE scenario will be extremely difficult to implement in reality. In contrast, the HRE-EE scenario will rely on putting district heating in the houses as well as energy efficiency measures. Therefore, if the district heating targets 110
112 cannot be achieved, then more energy efficiency measures can still be implemented. Similarly, if the energy efficiency measures cannot be achieved, then more district heating can be added. As discussed in sections 3.4 and 5.4, there is potentially more heat available from unconventional heat resources such as large-scale solar thermal and geothermal than is utilised in the HRE-EE scenario here. If more district heating is required, there are thus a number of opportunities still available to supply this heat with carbon neutral resources. In this way, the HRE-EE scenario is a technically a more reliable and easier solution to implement than the EU-EE scenario. Aarhus case study The case study quantifies the energy flows and costs related to establishing an individual or collective heating supply system in the Danish city of Aarhus. This was done by using GIS data on the existing supply system, demands and buildings in combination with related cost data. The analyses were carried out in four scenarios; two district heating and two individual heating scenarios. Another difference between the scenarios was the extent to which heat savings were implemented, with either 55% or 77% reductions in the annual building heat demands. They were labelled as: Scenario 1: District heating with 55% reduction Scenario 2: Individual heating with 55% reduction Scenario 3: District heating with 77% reduction Scenario 4: Individual heating with 77% reduction The results show that, with a reduced heat demand, the extent to which CHPs can be used in district heating areas is reduced, minimizing the benefits of district heating. On the other hand, the electricity demand is not reduced to the same extent, giving an additional demand of electricity production capacity in all scenarios. This is especially seen in the individual scenarios in which compression heat pumps are added to cover the heat demand. The overall fuel consumption is therefore lower in the two district heating scenarios, with the lowest consumption in Scenario 3 due to the larger heat reductions. These demand reductions are, however, associated with a higher investment cost than the reductions in Scenario 1. Therefore, the main result shows that implementing heat savings is feasible to some degree in combination with district heating, but the benefits achieved by applying Scenario 3 are more costly than Scenario 1. The individual scenarios are both more costly than the district heating scenarios, due to the large investments in individual heat pumps and additional electricity production capacity. There is, however, a tendency that, with large reductions in heat demand, heat pumps become a more attractive solution, but this is still more costly than the district heating scenarios. The Aarhus case study underlines some of the points made in the main Heat Roadmap Europe study: 1. District heating is an attractive solution in areas with a high heat density. 2. District heating can be seen as an efficiency measure similar to reductions in heat demand, because it enables the use of fuels in a more efficient way. 3. Heat reductions in buildings can be combined with district heating in a way which makes it competitive with individual solutions both in regard to resource use and costs. 111
113 7 CONCLUSIONS Based on the urban heat densities identified in the new EU Heat Atlas developed in this study (see Figure 14), a district heating share of 50% is feasible for buildings in the EU by This is even feasible if significant heat savings are implemented in the buildings. Overall, in the EU-EE scenario considered in this study, there is a 60% reduction in space heating and a 55% reduction in hot water demand between 2015 and 2050 (see Figure 40). These heat demand reductions will be very difficult to implement in reality, which is also acknowledged in the Energy Roadmap 2050 report: Energy efficiency tends to show better results in a model than in reality. Energy efficiency improvements are often hampered by split incentives, cash problems of some group of customers; imperfect knowledge and foresight leading to lock-in of some outdated technologies [11]. This level of energy efficiency measures will also be very expensive to implement. In this study, an indicate cost curve is created to estimate these costs based on previous work by the Danish Building Research Institute (Statens Byggeforskningsinstitut) for Danish buildings [43]. Using this curve, the estimated cost of the 60% reduction in the heat demands implemented in the EU-EE scenario is ~B 300/year (which is approximately 600/person in Europe each year). Since these energy efficiency measures will be difficult to implement and they are relatively expensive, the idea of this study HRE-EE is to illustrate and quantify how the same goals for CO 2 -emssion reductions can be reached by replacing some of the most expensive and most difficult energy conservation measures by district heating efficiency measures, which is both cheaper and easier to implement. Two expensive conservation measures have been identified in the EU-EE scenario: One is the assumed reduction in the hot water demand of Europe for the following reasons: The EU population will grow by 3.2% between 2010 and According to a number of interviews with industry experts, people tend to wash more today than they did in the past, which is likely to continue into the future. In other words, individuals are likely to take more showers and baths in the future than they do today. People are not expected to live with one another as much in the future. Hence, there will a larger number of people living in their own houses rather than living together. This is also expected to increase the demand for hot water for an individual. At present, there are regions in Europe where the use of hot water is limited due to technical and financial limitations. As these regions become wealthier, the demand for hot water is expected to rise in these regions. The building area for residential and non-residential buildings is expected to grow by 32% and 42% respectively between 2015 and 2050.Therefore, in the new heat demand for the HRE-EE scenario, the hot water demand is not reduced, but instead it is increased by ~15% between 2015 and The second change is that the space heating demand is not reduced as much in the HRE-EE scenario as in the EU-EE scenario. The most ambitious energy efficiency scenario from a recent report carried out by Ecofys for EURIMA, which is called the Deep Renovation scenario, concluded that a 47% reduction in EU space heating demands is feasible between 2010 and 2050 [42]. Therefore, a 47% reduction in 112
114 space heating is assumed here instead of the 62% reduction assumed in the EU-EE scenario. The energy efficiency measures in the HRE-EE scenario are still extremely ambitious, but less than in the EU-EE scenario. Based on these new assumptions, the total heat demand in the HRE-EE scenario is ~70% more in 2050 than in the EU-EE scenario (see Figure 48). However, since the heat demand is higher, the cost of the energy efficiency measures in the HRE-EE scenario is only B 130/year, instead of the B 300/year for the EU-EE scenario. The HRE-EE scenario has higher heat demands than the EU-EE scenario, but in doing so, the HRE-EE scenario has saved ~B 170/year. The key challenge now is to establish if these savings can be spent on new production technologies elsewhere in the energy system to enable the same reductions in CO 2 emissions as the original EU-EE scenario. The supply side of the heating system for residential and services buildings have therefore been redesigned in the HRE-EE scenario by carrying out the following steps: 1. Individual boilers are replaced by district heating. In 2030, district heating meets 30% of the heat demand and in 2050 it meets 50% of the heat demand in residential and services buildings. Individual coal, oil, gas, biomass, and direct electric heating systems are replaced, but individual heat pumps are not since these are also considered a key technology to decarbonise the EU energy system. It is assumed here that these individual heat pumps are installed outside the urban areas that contain district heating. 2. Individual cooling units are replaced with district cooling. 10% of the cooling demand for residential and services buildings is provided using district cooling in 2030 and 20% in the year District cooling is supplied from both natural cooling and from absorption heat pumps, which require heat from the district heating network. 3. To supply the heat for these new district heating demands, new production units are added to the HRE-EE scenario. Some existing condensing power-plants are converted to CHP plants and new decentralised natural gas plants are constructed. Centralised boilers, heat pumps, and thermal storage facilities are also added. 4. With district heating now installed, additional resources can be utilised in the HRE-EE scenario that could not be utilised in the EU-EE scenario. These include more wind power of the largescale heat pumps, large-scale solar thermal plants, geothermal heat, surplus industrial heat, and heat from waste incineration. Therefore, heat from each of these resources is also added to the HRE-EE scenario. 5. After these measures are implemented, the HRE-EE scenario consumed slightly less biomass than the EU-EE scenario. Therefore, the biomass consumption was increased in the HRE-EE scenario until it was at the same level as the EU-EE by replacing some natural gas in the centralised district heating boilers. 6. Finally, the HRE-EE scenario is more flexible than the EU-EE scenario since it integrates the electricity and heating sectors. To exploit the benefits of this, wind power is increased in the HRE-EE scenario until there is the same level of critical excess electricity production (CEEP) in the HRE-EE scenario as the EU-EE scenario. After implementing these changes, the primary energy supply (PES) and the CO 2 emissions can be compared between the HRE-EE scenario in the years 2030 and As displayed in Figure 61, the PES is slightly larger in the HRE-EE scenario (~2%), but the fossil fuel and biomass consumption in both scenarios is the same (<1% difference). As a result, the carbon dioxide emissions in both scenarios are also the same. The slightly larger PES in the HRE-EE scenario is due to the additional resources utilised 113
115 in the district heating network such as waste incineration, geothermal, and large-scale solar thermal. If district heating is not included in the EU energy system, these resources will be wasted. The HRE-EE scenario can also utilise approximately 5% more wind power than the EU-EE scenario due to the additional flexibility introduced into the system by integrating the electricity and heat sectors. Even though the heat demands in buildings are much higher in the HRE-EE scenario (see Figure 48), these additional heat demands can be met using CO 2 neutral resources, as outlined in Figure 62. Once again, these results indicate that both the EU-EE and HRE-EE scenarios have the same level of biomass and fossil fuel consumption in 2030 and 2050, so the additional heat demands in the HRE-EE scenario are met using heat from waste incineration, industry, geothermal, large-scale solar thermal, and heat pumps. As already discussed, the HRE-EE scenario has lower investment costs in energy efficiency measures than the EU-EE scenario. However, these savings then need to be reinvestment in redesigning the heating sector in the HRE-EE scenario, so the same CO 2 reductions can be obtained as the EU-EE scenario. However, these reinvestments in the HRE-EE scenario are less than the initial savings realised due to less energy efficiency measures, which means that the overall energy costs for the EU energy system are reduced by approximately 7-8% (see Figure 63). For the heating and cooling of buildings, the total costs are reduced in the HRE-EE scenario by ~15% compared to the EU-EE scenario (see Figure 64). The cost savings realised in the HRE-EE scenario are very dependent on the costs assumed for the energy efficiency measures, which will need to be investigated in more detail in the future. However, the conclusion in this study is relatively robust since the energy efficiency costs assumed here are relatively low and the district heating costs assumed are relatively high. In contrast, the costs assumed for district heating are relatively high in the HRE-EE scenario. To illustrate this, a sensitivity analysis is completed assuming more probably costs for both energy efficiency and district heating. The results in Figure 66 indicate that the savings for the heating and cooling sector would be ~22% if these costs assumptions are used instead. Therefore, the cost savings for the original HRE-EE scenario can be considered as conservative. Although the EU27 is a very large area, the results presented here have also been supported using on a specific case study based on the city of Aarhus in Denmark. This results from this case study, which allows for more specific demand, supply and cost data to be considered, also indicate that a combination of district heating and energy efficiency is a very efficiency and cost-effective heating strategy. The case study also compared district heating to individual heat pumps in urban areas, which included detached houses, concluding that district heating is a more efficiency and cheaper solution. To conclude, the key points from this study can be summarised as follows: 1. This first pre-study indicates that by adding district heating to a business-as-usual EU energy system (i.e. the CPI scenario which only includes the implementation of existing policies), it is possible to reduce the primary energy supply, reduce CO 2 emissions, and reduce energy system costs. 114
116 2. This second pre-study indicates that by adding district heating to an EU energy system with very low heat demands, it is possible to use the same amount of fossil fuels and biomass as the EU Energy Efficiency (EU-EE) scenario in the Energy Roadmap 2050 report, but the total energy system costs will be approximately 7-8% lower. 3. Energy efficiency measures will provide essential heat demand reductions in buildings in the future EU energy system, but at a certain point, these will become very difficult to implement and very costly. Ambitious energy efficiency targets should be pursued in the EU, but not to the extent that the EU-EE scenario suggests. 4. The HRE-EE scenario uses energy efficiency on both the demand and supply side of the energy system. By adding district heating for buildings, it is possible to utilise surplus heat from power plants, industry, and waste incineration, while also using more renewable energy such as wind power, large-scale solar thermal, and geothermal. 5. The EU-EE scenario relies heavily on heat savings in buildings to reach its CO 2 reduction targets. By introducing more district heating as an alternative energy efficiency measure, the HRE-EE scenario is a safer and more realistic alternative: there are more technologies to choose from, more renewable energy resources to utilise, and the heat demand does not need to be reduced as much. In future research, more information will need to be obtained about the specific energy efficiency measures that are necessary in the EU, the energy efficiency costs, profiling the cooling system, and cooling system costs. Also, a district heating scenario will need to be compared to an all-electric heating scenario and there are many opportunities that could be explored for increasing intermittent renewable energy (such as reducing baseload CCS and nuclear). 115
117 8 REFERENCES [1] Connolly D, Mathiesen BV, Østergaard PA, Möller B, Nielsen S, Lund H, Trier D, Persson U, Nilsson D, Werner S. Heat Roadmap Europe: First pre-study for EU27. Aalborg University, Halmstad University, and Euroheat & Power, Available from: [2] Population Division, Department of Economic and Social affairs, United Nations. World Urbanization Prospects: The 2009 Revision. (Data in digital form POP/ DB/WUP/Rev.2009).. Population Division, Department of Economic and Social affairs, United Nations, Available from: [3] International Energy Agency. Energy Balances of Non-OECD Countries. International Energy Agency, Available from: [4] Dyrelund A, Lund H. Heat Plan Denmark 2010 : a road map for implementing the EU directive on renewable energy (Varmeplan Danmark). Rambøll and Aalborg University, Available from: % d-8f23-45d5-804f-90dde1f5cde6%29.html. [5] Dyrelund A, Lund H, Möller B, Mathiesen BV, Fafner K, Knudsen S, Lykkemark B, Ulbjerg F, Laustsen TH, Larsen JM, Holm P. Varmeplan Danmark (Heat plan for Denmark). Ramboll Denmark and Aalborg University, Available from: [6] Stadtwerke München. Fernwärmeversorgung bis 2040 zu 100% aus erneuerbaren Energien. Euroheat & Power 41:4, 32-34, [7] Persson U. Realise the potential! Cost effective and energy efficient district heating in European urban areas. Licentiate thesis, Chalmers University of Technology, Gothenburg, Sweden, Available from: [8] Werner S, Persson U. Halmstad University District heating and Cooling Database. Halmstad University, [9] European Commission. Energy Roadmap European Commission, Available from: [10] European Commission. A Roadmap for moving to a competitive low carbon economy in European Commission, Available from: [11] European Commission. Impact Assessment Accompanying the document Energy Roadmap 2050 (Part 1/2). European Commission, Available from: [12] European Commission. Impact Assessment Accompanying the document Energy Roadmap 2050 (Part 2/2). European Commission, Available from: [13] European Commission. Directive 2010/31/EU of the European Parliament and of the Council of 19 May 2010 on the energy performance of buildings. European Commission, Available from: [14] Buildings Performance Institute Europe. Europe s buildings under the microscope: Country-by-country review of the energy performance of Europe's buildings. Buildings Performance Institute Europe, Available from: [15] European Commission. Energy efficiency: delivering the 20% target. European Commission, Available from: [16] Lund H. Renewable Energy Systems: The Choice and Modeling of 100% Renewable Solutions. Academic Press, Elsevier, Burlington, Massachusetts, USA, ISBN:
118 117 [17] Aalborg University. EnergyPLAN: Advanced Energy System Analysis Computer Model. Available from: [accessed 14th September 2010]. [18] Lund H, Munster E. Modelling of energy systems with a high percentage of CHP and wind power. Renewable Energy 2003;28(14): [19] Lund H, Aalborg University. EnergyPLAN: Advanced Energy Systems Analysis Computer Model. Aalborg University, Available from: [20] Sundlöf C. Svenska Värmenät - Potential för utökat värmeunderlag för kraftvärme och spillvärme genom sammanbyggand av fjärrvärmenät (Swedish Heat Grids - Potential for more aggregated heat loads for higher utilisation of combined heat and power and industrial excess heat by extended heat grids). The Swedish District Heating Association, Available from: [21] Möller B, Lund H. Conversion of individual natural gas to district heating: Geographical studies of supply costs and consequences for the Danish energy system. Applied Energy 2010;87(6): [22] McKenna RC, Norman JB. Spatial modelling of industrial heat loads and recovery potentials in the UK. Energy Policy 2010;38(10): [23] Department of Energy and Climate Change (UK). UK CHP Development Map. Department of Energy and Climate Change (UK), Available from: [24] Department of Energy and Climate Change (UK). UK National Heat Map. Department of Energy and Climate Change (UK), Available from: [25] Kjärstad J, Johnsson F. The European power plant infrastructure Presentation of the Chalmers energy infrastructure database with applications. Energy Policy 2007;35(7): [26] Werner S. ECOHEATCOOL: The European Heat Market. Euroheat & Power, Available from: [27] GISCO. GEOSTAT 2006 grid dataset. European Commission (Eurostat, Joint Research Centre and DG Regional Policy - REGIO-GIS), Available from: [28] European Environment Agency. Corine land cover 2000 (CLC2000) seamless vector database. European Environment Agency, Available from: [29] European Environment Agency. The GMES Urban Atlas. European Environment Agency, Available from: [30] eurostat. Landfill still accounted for nearly 40% of municipal waste treated in the EU27 in eurostat, Available from: [31] Persson U, Werner S. District heating in sequential energy supply. Applied Energy 2012;95(0): [32] Bentsen NS, Felby C. Biomass for energy in the European Union - a review of bioenergy resource assessments. Biotechnology for Biofuels 2012;5(25). [33] Lund H, Mathiesen B, Christensen P, Schmidt J. Energy system analysis of marginal electricity supply in consequential LCA. The International Journal of Life Cycle Assessment 2010;15(3): [34] European Geothermal Energy Council. Deep Geothermal Market Report. European Geothermal Energy Council, Available from:
119 [35] Trier D. Overview of existing and planned solar collector fields connected to district heating systems in Denmark. PlanEnergi, Available from: [36] Östergaard JS, Ulbjerg F, Danish Technological Institute. Store solvarmeanlaeg med höje daekningsgrader (Large solar heating systems with high degree of coverage). Danish Technological Institute, [37] Sunstore 4. The existing and the new energy system in Marstal (The SUNSTORE 4 Concept). Sunstore 4, Available from: [38] European Environment Agency. The European Pollutant Release and Transfer Register (E-PRTR). European Environment Agency, Available from: [39] International Energy Agency. Energy Balances of Non-OECD Countries. International Energy Agency, Available from: [40] International Energy Agency. Energy Balances of OECD Countries. International Energy Agency, Available from: [41] Persson U, Werner S. Heat distribution and the future competitiveness of district heating. Applied Energy 2011;88(3): [42] Boermans T, Bettgenhäuser K, Offermann M, Schimschar S. Renovation Tracks for Europe up to 2050: Building renovation in Europe - what are the choices? Ecofys, Available from: [43] Kragh J, Wittchen KB. Danske bygningers energibehov i 2050 (Danish Buildings Energy Demand in 2050). Statens Byggeforskningsinstitut (Danish Building Research Institute), Aalborg University, Available from: [44] Dalla Rosa A, Li H, Svendsen S. Method for optimal design of pipes for low-energy district heating, with focus on heat losses. Energy 2011;36(5): [45] Danish Energy Agency and Energinet.dk. Technology Data for Energy Plants: Individual Heating Plants and Technology Transport. Danish Energy Agency and Energinet.dk, Available from: [46] Tvärne A, Frohm H. Why Europe Needs to Consider District Cooling. Euroheat & Power (Eng. ed) 2013;10: [47] Danish Energy Agency and Energinet.dk. Technology Data for Energy Plants: Generation of Electricity and District Heating, Energy Storage and Energy Carrier Generation and Conversion. Danish Energy Agency and Energinet.dk, Available from: [48] Riviere P. ENTR Lot 6 Air Conditioning and Ventilation Systems: Executive Summary. MINES ParisTech, BRE, and VHK, Available from: [49] Gadd H, Werner S. Daily Heat Load Variations in Swedish District Heating Systems. In Review [50] Mathiesen BV, Lund H, Connolly D. Limiting biomass consumption for heating in 100% renewable energy systems. Energy 2012;48(1): [51] Blarke MB, Lund H. The effectiveness of storage and relocation options in renewable energy systems. Renewable Energy 2008;33(7): [52] Blarke MB. Towards an intermittency-friendly energy system: Comparing electric boilers and heat pumps in distributed cogeneration. Applied Energy 2012;91(1): [53] E3MLab of the Institute of Communication and Computer Systems at the National Technical University of Athens. PRIMES Model: Version used for the 2010 scenarios for the European Commission including new sub-models. European Commission, Available from: 118
120 119 df. [54] Connolly D, Lund H, Mathiesen BV, Leahy M. A review of computer tools for analysing the integration of renewable energy into various energy systems. Applied Energy 2010;87(4): [55] National Technical University of Athens. Energy - Economics - Environment Modelling Laboratory Research and Policy Analysis. Available from: [accessed 26th April 2009]. [56] Capros P, Mantzos L, Papandreou V, Tasios N. Energy and Transport Outlook to Update European Communities, Available from: [57] Commission of European Communities. Impact Assessment: Package of Implementation measures for the EU's objectives on climate change and renewable energy for Commission of European Communities, Available from: [58] Bulteel P, Belmans R, Dolben G, Garcia Madruga M, Kallstrand B, Lace I, Livrieri A, Nahon C, Virkkala Nekhaev E, Papageorgi A, Saraiva F, Stridbaek U, Theis K, Van Vliet E, Wunnerlich M. The Role of Electricity: A New Path to Secure, Competitive Energy in a Carbon-Constrained World. eurelectric, Available from: [59] Capros P, Kouvaritakis N, Mantzos L. Economic Evaluation of Sectoral Emission Reduction Objectives for Climate Change: Top-down Analysis of Greenhouse Gas Emission Reduction Possibilities in the EU. National Technical University of Athens, Available from: [60] Connolly D, Mathiesen BV, Dubuisson X, Lund H, Ridjan I, Finn P, Hodgins J. Limerick Clare Energy Plan: Climate Change Strategy. Aalborg University and Limerick Clare Energy Agency, Available from: [61] Herold A. Comparison of CO2 emission factors for fuels used in Greenhouse Gas Inventories and consequences for monitoring and reporting under the EC emissions trading scheme. European Topic Centre on Air and Climate Change, Available from: [62] Danish Energy Agency, Energinet.dk. Technology Data for Energy Plants. Danish Energy Agency, Energinet.dk, Available from: DK/Info/TalOgKort/Fremskrivninger/Fremskrivninger/Documents/Teknologikatalog%2 0Juni% pdf. [63] Lund H, Möller B, Mathiesen BV, Dyrelund A. The role of district heating in future renewable energy systems. Energy 2010;35(3): [64] Gonzalez A, Ó'Gallachóir B, McKeogh E, Lynch K. Study of Electricity Storage Technologies and Their Potential to Address Wind Energy Intermittency in Ireland. Sustainable Energy Authority of Ireland, Available from: udy_of_elec_storage_technologies_their_potential_to_address_wind_energy_interm ittency_in_irl. [65] Pöyry Energy Consulting. Low Carbon Generation Options for the All-Island Market. EirGrid, Available from: [66] International Energy Agency. ETSAP: Energy Technology Systems Analysis Programme. Available from: [accessed 22nd February 2009]. [67] COWI. Alternative drivmidler. Energistyrelsen (Danish Energy Agency), Available from:
121 120 [68] Danish Energy Agency. Forudsætninger for samfundsøkonomiske analyser på energiområdet (Assumptions for socio-economic analysis on energy). Danish Energy Agency, Available from:
 885 Objective: The scenarios in Energy Roadmap 2050 investigate the possibilities")
122 9 ANNEX I: REVIEW OF EXISTING ENERGY STRATEGIES In the following pages is seen a description of a selection of some of the most recent energy scenarios. Title: Energy Roadmap 2050 Year of publication: Organization: 2011 European Commission Outlook year: 2050 COM (2011) 885 Objective: The scenarios in Energy Roadmap 2050 investigate the possibilities for moving towards decarbonisation of the energy system. The Energy Roadmap 2050 does not replace national, regional and local improvements of the energy supply, but seeks to develop a technology-neutral framework and argues that compared to parallel national schemes, a European approach to the energy challenge will increase security and solidarity and lower costs by providing a wider and flexible market for new products and services. How buildings are insulated/heated: Short-term opportunity to reduce emissions is first and foremost through improvement of the energy performance of buildings. The analysis shows that emissions in this area could be reduced by around 90% by New buildings built from 2021 onwards should be nearly zero-energy buildings. Heat pumps and storage heaters based on electricity and renewable energy such as solar heating, biogas and biomass also provided through district heating systems, should be used. How district heating is mentioned: Energy Roadmap 2050 describes seven scenarios. Two of them assuming current trends and fixed political, economic, and technical limitations. These are called current trend scenarios. The other five are called decarbonisation scenarios and use different measures to reduce the greenhouse emissions of Europe. The report focuses on electricity to play a much greater role in all scenarios. However it states that future modelling improvements could consider better representation of the impacts of climate change itself, as well as energy storage and smart grid solutions for distributed generation. CHP and district heating are only mentioned briefly. In the decarbonisation scenarios there is seen a transition of the energy system from low capital costs and high fuel and operational costs to high capital costs and low fuel costs. The increase of capital costs is due to investments in power plants and grids, industrial energy equipment, smart meters, insulation material, more efficient low carbon vehicles, RES equipment (such as solar collectors) etc. Link to report: 121
123 Title: Impact assessment accompanying document to Energy Roadmap 2050 Year of publication: Organization: 2011 European Commission Outlook year: 2050 SEC(2011) 1565 Objective: (Energy Roadmap 2050) How buildings are insulated/heated: Coal and oil hold a share of around 25% of final energy used for heating and cooling of the built environment. In the reference scenario this decreases to around 15% in 2050 and practically disappears in the decarbonisation scenarios. Gas decreases from around 45% today to around 30% by 2050 in the decarbonisation scenarios in the context of global climate action. The share of electricity increases from currently less than 10% to more than 20% in the decarbonisation scenarios, and the share of biomass from currently over 10% to over 25%. Due to the efficiency gains the increase of biomass corresponds more or less to a stagnation of biomass used for space heating in absolute terms. Distributed heat maintains its current share of less than 10% by How district heating is mentioned: District heating is not included in detail (e.g. described by fuel type) in the modelling. It is stated in the Impact Assessment document accompanying the report A Roadmap for moving to a competitive low carbon economy in 2050 [51] that potential break-through technologies depending on unforeseeable structural change have not been taken into account. A particular example is the limitations in terms of modelling energy storage and smart grid solutions that would enable very wide scale deployment of distributed generation. However district heating represents different actual quantities of energy depending on the scenario, but is in general not considered playing a major role in the residential and service sector in the long run. A table from the report shows that there is not that big a difference in the share of district heating for this sector in the scenarios. However it is important to note that the energy consumption is not the same in the different scenarios. The final energy demand is in the decarbonisation scenarios 8%-14% lower in 2030 compared to the reference and 34%-40% lower in Share of distributed heat in total heating for residential and tertiary: Year CPI 11.6% 12.0% 12.0% Energy Efficiency 12.0% 12.8% 13.3% Div. Supply Technology 11.6% 12.4% 13.4% High RES 11.6% 11.4% 8.5% Delayed CCS 11.6% 12.4% 12.4% Low Nuclear 11.6% 12.5% 13.7% Link to report: 13 This is from the Impact Assessment document (report reference no. SEC(2011) 288) accompanying the report A Roadmap for moving to a competitive low carbon economy in 2050, but though they are separate documents, they are referring to the same scenarios and are all published by the European Commission in 2011: 122

124 Title: Roadmap 2050 A practical guide to prosperous low-carbon Europe Technical analysis Year of publication: Organization: 2010 The European Climate Foundation (ECF), McKinsey & Company, Outlook year: KEMA, 2050 The Energy Futures Lab at Imperial College London, Oxford Economics Objective: The mission of the Roadmap 2050 project is to provide a practical, independent and objective analysis of pathways to achieve a low-carbon economy in Europe, in line with the energy security, environmental and economic goals of the European Union. The focus is on the description of a plausible way to realize an economywide GHG reduction of 80%, and the development and assessment of pathways to decarbonize the power sector. How buildings are insulated/heated: The report mentions that an urgent implementation challenge is to make a large scale fuel shift possible. In terms of the building sector it suggest more heat pumps both for individual and in district heating applications, and district heating based on industry excess heat, biomass or alternatively geothermal heat. How district heating is mentioned: The report addresses the implications of electrification in buildings and transport on the final energy demand. However it does not provide a detailed analysis on the issues. The report does mention district heating as part of the system and discuss the entire emission scope in general, but focuses particularly at the power sector. Out of scope is i.a. detailed trade-offs in the decarbonisation of building heat via electrification, biomass/biogas, zero carbon district heating schemes or other options. District heating with large scale heat pumps is assumed where building density is high. Alternatives are biomass or biogas fired CHP or district heating plants, or biogas fired boilers in homes. Link to report: 123

 climate policy objectives.")
125 Title: Year of publication: Governing the transition to low-carbon futures: A critical survey of energy scenarios for 2050 Organization: 2011 Luleå University of Technology Economics Unit Outlook year: 2050 Lund University Dept. of Political Science and Environmental, Energy System Studies and AgriFood Economics Center Objective: The article addresses the role of energy future studies in providing insights on the societal transitions that are implied by contemporary visions of low-carbon futures. The analysis is based on a critical review of 20 scenario exercises of relevance for meeting long-term (i.e., 2050) climate policy objectives. How buildings are insulated/heated: Not described. How district heating is mentioned: District heating, cogeneration and CHP are not mentioned directly. Link to report: - Title: Providing all global energy with wind, water, and solar power (part I and II) Year of publication: Organization: 2010 Stanford University Dept. of Civil and Environmental Outlook year: Engineering 2050 University of California at Davis Institute of Transportation Studies Objective: In the article the feasibility of providing worldwide energy for all purposes (electric power, transportation, heating/cooling, etc.) from wind, water, and sunlight (WWS) is analyzed. How buildings are insulated/heated: The article proposes air- and ground-source heat-pump water and air heaters and electric resistance water and air heaters. For high-temperature industrial processes, we propose that energy be obtained by combustion of electrolytic hydrogen. It is assumed that 5% of fuel use for space heating and 20% of fuel use for appliances (mainly cooking) are not electrified. How district heating is mentioned: The article focuses distinctly on electricity and does not cover district heating. Link to report: - 124

126 Title: The energy report 100% renewable energy by 2050 Year of publication: Organization: 2011 WWF International Outlook year: 2050 ECOFYS OMA (Office for Metropolitan Architecture) Objective: WWF has a vision of a world powered by 100% of renewable energy sources by the middle of this century. The Energy Scenario in the report includes an energy system (global) with 95% of renewable energy in How buildings are insulated/heated: Existing buildings should be insulated and new buildings should be constructed to use as little energy as possible. Heating needs can be reduced by 60% in all existing buildings by 2050 if 2-3% of the total floor area is retrofitted with extra insulation each year. Solar and geothermal sources, as well as heat pumps should provide a large share of heat for buildings and industry. Almost no energy will be needed for heat and cooling in all new buildings by How district heating is mentioned: The report only mentions district heating briefly when referring to the potential of geothermal heating. In does not mention large scale CHP and focuses mainly on electricity. In the scenario geothermal and solar are mentioned in a general way without going into details if it implies large or small scale units. The report describes a scenario where the world as far as possible use electrical energy rather than solid and liquid fuels. Wind, solar, biomass and hydropower are the main sources of electricity, with solar and geothermal sources, as well as heat pumps providing a large share of heat for buildings and industry. Link to report: 125
 policy makers who need to be able to identify the role of new")
127 Title: Energy Technology Perspectives 2010 Scenario and strategies to 2050 (part 1 and 2) Year of publication: Organization: 2010 IEA (International Energy Agency) Outlook year: 2050 Objective: The goal of the book is to contribute to the reduction in carbon dioxide emissions by acting as a reference point for (among others) policy makers who need to be able to identify the role of new technologies, potential technical and political barriers, and to provide the measures to overcome them. How buildings are insulated/heated: In the short run low-cost energy efficiency options will reduce carbon dioxide emissions caused by the building sector. In the longer term highly efficient heat pumps for heating and cooling, solar thermal space and water heating, and small scale CHP systems with hydrogen fuel cells are some of the main technologies to decarbonise the energy consumption of buildings. The book states that CHP can be an attractive abatement option in buildings, but that the use of it depends on the application and location. How district heating is mentioned: The book examines the fuels and technologies that are likely to be important in a) a Baseline scenario and b) in a range of scenarios, in which global carbon dioxide emissions are reduced by 50% from 2005 levels by 2050, called the BLUE Map scenario and a series of variants of it. However district heating is only occasionally mentioned and CHP/district heating is described as playing an important, but small role. The use of CHP approximately triples in the BLUE Map scenario in absolute terms between 2007 and The share of CHP in power generation increases to 13% over this period, up from 10% in the Baseline scenario. It is mentioned that Denmark, Finland and the Netherlands already have high share of CHP and that many other countries have significant potential to expand their use of CHP, if they take steps to address barriers such as unfavourable regulatory frameworks in the form of buy-back tariffs, exit fees, and backup fees, challenges in locating suitable heat users, and the relative cost-ineffectiveness of CHP units of less than 1 MW capacity. The book describes that thermal storage is likely to become increasingly important in the long term as thermal loads begin increasingly to use electricity generated through heat pump technologies and as CHP plays a stronger role. Besides this, it explains that for CHP plants the desired energy output can be difficult to control since the ratio of electricity and heat most often is not perfectly matching the demand. However CHP units can store excess heat energy for use at a later time in response to heat demand by responding to electricity system signals. Link to report: 126
. However compared to ETP 2010, the scenarios in this version of the WEO are updated, i.a. to include the most recent policies (and in one scenario to assume that announced political commitments will be enforced though not finally decided yet).")

128 Title: World energy outlook 2011 Year of publication: Organization: 2011 IEA (International Energy Agency) Outlook year: 2035 Objective: The IEA World Energy Outlook scenarios are in general in accordance with the Energy Technology Perspectives (ETP). However compared to ETP 2010, the scenarios in this version of the WEO are updated, i.a. to include the most recent policies (and in one scenario to assume that announced political commitments will be enforced though not finally decided yet). The most ambitious scenario is called the 450 Scenario, which sets out an energy pathway consistent with the goal to limit the concentration of greenhouse gases in the atmosphere to 450 parts per million of CO 2 -equivalent and the increase in global temperature to 2 C. How buildings are insulated/heated: Not described in detail. How district heating is mentioned: Not mentioned in detail. Link to report: - Title: Deciding the Future Energy Policy Scenarios to 2050 Year of publication: Organization: 2007 World Energy Council (WEC) Outlook year: 2050 Objective: The study seeks to - better understand possible energy futures - assess the challenges presented in these energy futures - identify the role that policy may play to help or hinder the achievement of WEC s Millennium Goals of Accessibility, Availability, and Acceptability. It is not a theoretical study, but a product of several workshops held to discuss energy policies for different regions of the world. How buildings are insulated/heated: Advanced building technologies produce major energy savings and buildings might even become net energy producers rather that consumers. However these technologies have not been implemented in old buildings and in the developing world, either because the technology has not been made available or it is too expensive. 127
129 How district heating is mentioned: District heating, cogeneration and CHP are not mentioned directly. Link to report: 128
130 10 ANNEX II: REVIEW OF FUTURE HEAT DEMANDS WITHIN VARIOUS ENERGY STRATEGIES 10.1 ENERGY ROADMAP 2050 (EU COMMISSION) Heat sector in general The main focus is on electrification, the use of heat pumps and extensive savings in the demand. There will be a need for significant increase in capital costs for the energy system due to investments in power plants and grids, in industrial energy equipment, heating and cooling systems (including district heating and cooling), smart meters, insulation material, more efficient and low carbon vehicles, devices for exploiting local renewable energy sources (solar heat and photovoltaic), durable energy consuming goods etc. In the table below is seen the development in heat demand for the residential and service sector compared to 2015 for the different scenarios. It is seen that there is a decrease of 53-60% from in decarbonisation scenarios (all but the reference and CPI scenario). Heat demand development Reference -3% -14% -19% -24% CPI -13% -19% -22% -26% Energy Efficiency -17% -31% -45% -60% Diversified Supply Technology -12% -24% -37% -55% High RES -12% -21% -34% -53% Delayed CCS -12% -24% -41% -55% Low Nuclear -12% -25% -37% -55% Heat savings The prime focus is on energy efficiency. Higher energy efficiency in new and existing buildings is essential in the decarbonisation scenarios. Nearly zero energy buildings are assumed to become the norm after Besides this, products and appliances will have to fulfil highest energy efficiency standards (which reduces the total energy demand of the residential sector, but does not decrease the need for heating). The energy efficiency scenario includes more stringent minimum requirements for appliances and new buildings, high renovation rates of existing buildings and establishment of energy savings obligations on energy utilities. This is expected to lead to a decrease in energy demand of 41% by 2050 as compared to the peaks in Incentives to change behaviour (e.g. taxes, grants or on-site advice by experts) are required in order to make households and companies invest in the energy system transformation. Greater access to capital for consumers and innovative business models are needed. With smart meters and smart technologies the energy consumption will be a continuously hands-on-experience for the consumers. Sufficient interconnection capacity and a smarter grid to manage the variations of wind and solar power could diminish the need for storage, backup capacity and baseload supply. 129
131 How is the heat produced? In all scenarios electricity plays a much greater role than now (almost doubling its share in final energy demand to 36-39% in 2050) and contributes to the decarbonisation of transport and heating/cooling. Renewables is assumed to move from small-scale, subsidised technology developments to competitive, large-scale mass production in the entire energy system. This requires changes in policies parallel to their further development. In terms of heating and cooling, a shift in energy consumption towards low carbon, locally produced energy sources (incl. the use of heat pumps and storage heaters) and renewable energy such as solar heating, geothermal, biogas and biomass are needed (i.a. included through district heating systems). In the short to medium term gas is assumed to help reduce emissions and the consumption stays high in the power sector over longer period until at least Though the gas consumption in the residential sector is believed to decrease in some member states, it is said to have a possible growth potential in others due to the higher energy efficiency compared to electric heating (based on fossil fuels) or other types of fossil fuel heating IMPACT ASSESSMENT ACCOMPANYING THE ENERGY ROADMAP 2050 Heat sector in general As mentioned for the Energy Roadmap 2050, electricity becomes in general the most important final energy source. The goal of decarbonisation in 2050 requires an almost carbon free electricity sector in the EU, and around 60% CO 2 reductions by Heat savings Since the space demand is assumed to increase (from 2.4 inhabitants per household in 2005 to 2.0 in 2050 and from 87 m 2 per household to 113 m 2 in the same period) the savings have to be made through changes in a) the energy efficiency of the building itself (particularly in the thermal insulation) and b) the efficiency and fuel mix of the heating and cooling equipment for buildings. The Efficient Energy scenario is driven by a political commitment of very high primary energy savings by It includes further and more stringent minimum requirements for appliances and new buildings (all new houses after 2020 comply with passive house standards around kwh/m 2 depending on the country). energy generation (e.g. obligation of utilities to achieve energy savings in their customers' energy use over 1.5% per year up to 2020). transmission and distribution (all scenarios will reflect significant development of electrical storage and interconnections). high renovation rates for existing buildings (due to better/more financing tools and planned obligations for public buildings). the establishment of energy savings obligations on energy utilities. the full roll-out of smart grids, smart metering and highly decentralised RES generation to build on synergies with energy efficiency. How is the In the report s own words the high renovation rates for existing buildings which in the Energy Efficiency scenario is (more than 2% refurbishment per year) pushes the limits of what the chosen measures can achieve. This indicates that this assumption is foreseen to be quite a challenge to achieve. In the reference and CPI scenarios there is seen an increase in demand for distributed heat based 130
132 heat produced? on biomass and gas based CHP between 2005 and In the longer run this development slows down in the tertiary and residential sectors due to the trend towards electrification (i.e. the use of heat pumps) and higher energy efficiency which limits the overall demand for heating. In the industry sector the increase in demand for distributed steam is projected to continue in the future especially for chemicals, food, tobacco, and engineering. However in the decarbonisation scenarios the demand for distributed heat is lower due to the shift towards electricity use for heating reducing especially district heating from fossil fuels. It is stated that though CHP leads to emission reductions compared to conventional systems, it is only decarbonized when fired with biomass which in the Primes model is used elsewhere in the energy system. In other words CHP plants and district heating boilers is not allowed to use biomass in the model and district heating is on this basis assumed to decrease throughout the projection period. For the decarbonisation scenarios, locally produced heating from solar, geothermal, biogas and biomass installations is needed in the short-to-medium term and in the long run especially heat pumps for the low amount needed for the nearly zero-energy buildings are assumed. In the table below is seen the share of renewables in the final heating and cooling demand. There is not provided a breakdown into fuels of the demand. Share of RES in gross final consumption of heating and cooling CPI 20.9% 22.7% 23.8% Energy Efficiency 21.0% 23.3% 44.9% Diversified Supply Technology 20.9% 23.8% 44.0% High RES 20.9% 26.8% 53.5% Delayed CCS 20.9% 24.2% 44.9% Low Nuclear 20.8% 24.3% 44.6% 131
133 10.3 ROADMAP 2050 (EUROPEAN CLIMATE FOUNDATION) Heat sector in general It is stated that the report addresses the implications of electrification in buildings and transport on final power demand, but it does not attempt to provide a detailed analysis of the decarbonisation pathways for either sector. An extensive expansion of the interregional transmission grid across Europe is assumed in order to electrify most of the energy sector to reach 80% emission levels compared to 1990 by This however means that there is a large amount of backup power needed and the assumed investments in the grid has in other reviews been deemed suspiciously low to maintain an acceptable security of supply. It is stated that a detailed assessment of distribution system investments is outside the scope of the report and that grid investments required are around 10% of generation investments. Though this still is a substantial cost, it should be considered that if the necessary grid investments are not made, the result can in practice be an increase in backup and operational costs amounting to far more than the grid investments saved. The electrification of buildings (vs. biogas heating or zero-carbon district heating) can be viewed as a conservative case for the electricity demand. The report states that if other (non-electric) decarbonisation solutions should emerge for some portion of either sector, these will only make the power challenge more manageable. In other words the report focuses on electrifying the energy sector and though some CHP/district heating is included, it does not seem to be aimed at its maximum potential. Heat savings How is the heat produced? The scenario does not rely on technology breakthroughs, but improvements in existing technologies. The savings are not described in detail separately, but it is deemed necessary to take political action to include a complex mix of different incentives and top-down regulations. Coordinating support for development and deployment of energy efficiency technologies, CCS (also for gas), PV, offshore wind, biomass, electric vehicles, integrated heat pump and thermal storage systems, smart grids that allow demand response, and networked HVDC technologies (incl. using adoption of common standards) are requested. The target of 80% reduction in GHG emissions is shown to be reachable by different variations of the use of RES, CCS (e.g. in combination with gas power plants) and nuclear. A fuel shift in the building sector is required. In the short term a ramp-up in the application of heat pumps (both in individual premises and in district heating applications), along with biomass district heating or CHP from the industry is needed. In dense areas there are assumed to be district heating based on large heat pumps and (to a small extent) biomass/biogas fired CHP/district heating plants or biogas fired boilers in homes. In 2050 almost 90% of the heat demand in buildings is covered by electricity. 132
134 10.4 THE ENERGY REPORT 100% RENEWABLE ENERGY BY 2050 (WWF) Heat sector in general Heat savings Compared to today s level the heat demand in the building sector decreases below 10% per floor area and the floor area is assumed to increase around 70% compared to today. The electricity consumption for heat pumps are however not included in this demand and since new buildings are thought to be all-electric i.e. without any fuel consumption, the increase of around 50% in residential electricity demand per unit floor area indicates that the actual development in the heat demand depends on the assumed COP of the heat pumps. The overall result of the Energy Scenario is that energy demand can be reduced over the next four decades while providing more energy services to more people. This is primarily achieved through the aggressive roll-out of the most efficient technologies. It is assumed that all existing buildings will be retrofitted by 2050 to ambitious energy efficiency standards based on retrofit rates of up to 2.5% of floor area per year, which is explained as high compared to current practice, yet feasible. For a given retrofit, it is assumed that, on average, 60% of the heating needs could be abated. The buildings will have an energy use at levels comparable to the passive house standard developed in Germany and this will apply to 100% of new buildings by How is the heat produced? As far as possible, electricity is used. Wind solar biomass and hydro are the main producers of electricity. Solar and geothermal sources as well as heat pumps provide a large share of heat for buildings (and industry). Solar thermal is projected to have a potential share of around 10% of current heat demand in buildings, i.e. a large share of the solar potential is to be covered by solar electricity. Energy efficiency is the key requisite to meeting our future energy needs from sustainable sources. A quarter of the remaining heating and hot water in existing buildings (after the retrofitting) need would be met by local solar thermal systems, the rest by heat pumps. For the (residual) heat demand of the near zero energy use buildings passive solar, internal gains, solar thermal and/or heat pumps are used. No fuel supply of any kind, i.e. it is all-electric buildings in terms of energy supply from outside the building itself. Cooling is mentioned to be provided by local, renewable solutions where possible. The current use of traditional biomass will be phased out and only a small share deemed sustainable (up to 30% of the current amount) will be used in latter decades. In the last part of the projection period towards 2050 this demand for biomass is phased out completely. Concentrating solar heating (CSH) is included in very small scale as a conservative assumption because the technology is said no to be on the market yet. It is stated that further study on the distribution of the industrial heat demand and the availability of nearby CSH sources is recommended. 133
135 10.5 RE-ENERGISING EUROPE PUTTING THE EU ON TRACK FOR 100% RENEWABLE ENERGY (WWF) Heat sector in general The report follows up on The Energy Report 100% renewable energy by 2050 from 2011 (see above). It is produced to describe what should be achieved in the EU by 2030 to secure a 100% renewable European energy system by 2050, which in brief is stated to require the following: 38% primary energy savings (compared to a business as usual projection). 41% share of renewable energy in total consumption. 50% cut in energy-related GHG emissions (compared to 1990). As seen in the table below indicating the development in the fuel and heat supply for buildings (i.e. mainly space and water heating), the energy savings are dominating the path towards reducing GHG emissions. [EJ/a] Building fuels and heat in total Total renewable energy Fossil fuels Heat savings The largest energy savings are seen in the building sector (26% from ) and in industry (31% from ). In buildings the heat demand in 2030 is said to be 40% (commercial) to 50% (residential) of 2005 levels. Electricity is 90% (commercial) to 120% (residential) of 2005 levels. This is to be obtained by retrofitting the existing building stock (75% of European buildings in 2030) at rates of up to 2.5% a year. By 2030 approximately 45% of the Europe s existing buildings are assumed to be retrofitted. The term retrofitting is defined as: 60% of heating needs abated by insulation and ventilation systems with heat recovery mechanisms. 25% of remaining heating and hot water need met by local solar thermal systems, the rest by heat pumps. Cooling provided by local, renewable solutions where possible. Electricity needs increase per floor area due to increased cooling demand. (In line with The Energy Report from WWF.) Besides this, new building stock (25% of European buildings in 2030) is assumed to be much more energy efficient and are defined as follows: By 2030 all new buildings will use energy at levels comparable to the German passive house standard and will be powered only by electricity. Residual heat demand will be met by passive solar, internal gains, solar thermal installations and heat pumps. There will be some increase in electricity use in buildings because of greater use of appliances and in order to power heat pumps. The increase is only partially offset by more efficiency in these technologies. How is the heat produced? In % of the final heat demand is met by means of renewables. For electricity the share is 65%. For the building sector the share of renewables increases from 19% in 2010, to 29% in 2020 and 49% in Biomass is assumed to continue to be the main RES used in industry and buildings. For electricity production, wind power (mainly onshore) takes over from hydro as the main RES by
136 10.6 ENERGY TECHNOLOGY PERSPECTIVES 2012 (IEA) Heat sector in general It is stated that heating and cooling remain neglected areas of energy policy and technology, but their decarbonisation is a fundamental element of a low-carbon economy. In EU the energy consumption of buildings is assumed to be almost constant between 2015 and The decrease seen in the residential sector is approximately compensated by the increase seen in the service sector. The heat demand in the industry sector decreases towards Some of the main trends determining future demand for heating and cooling, and the technologies that can deliver these services are described to be: The future need for thermal comfort in residential and commercial buildings Radiators do not need to use high grade energy and high temperatures when the same comfort can be reached with lower temperatures. This statement underlines the need for the development of low temperature district heating. Rate and pattern of urbanisation in emerging economies Due to the projected urbanisation (globally 6.3 billion people living in cities in 2050 from 3.5 billion today) district heating becomes feasible because distribution networks are shorter and heat-generating infrastructure is more compact. Compact urban development can compromise the desired use of natural lighting, ventilation and decentralised use of solar energy, and higher densities limit the potential of groundsource heat pumps (because there are limits to the rate at which heat can be extracted). This statement underlines the need for district heating in order to decarbonise the heating sector. Heat demand from industry Due to a future decrease in construction activity plus further improvements in energy efficiency, the scenarios project a decline in heat demand beyond 2020, particularly from higher-temperature industries. Heat savings In the most ambitious scenario (2DS), investments in the buildings sector dominates in all countries compared to the 6DS scenario (current trends), highlighting importance of energy efficiency. Higher investments will be needed for more efficient HVAC systems and building shell improvements. It is stated that around 60% of today s residential dwellings in the OECD will still be standing in 2050 and must be refurbished to low-energy standards (output energy needs of approximately 50 kwh/m 2 per year for heating and cooling). In the short term the level of investment is higher in OECD countries, because existing building stock requires significant retrofitting. In the residential subsector of EU more than twice the additional investment needs of the commercial subsector is required. The energy demand for space heating in these countries is expected to remain flat and begin a declining trend in 2020, as a result of the new energy efficient buildings in combination with an ambitious annual retrofit of 2.5% for existing buildings. Barriers such as split incentives between tenants and landlords, lack of awareness of efficient technologies and high initial investment costs is needed to be addressed by governments. At national and sub-national level governments are urged to require all new buildings, as well as buildings undergoing renovation, to meet energy codes and minimum energy performance standards. 135
137 support and encourage construction of buildings with net-zero energy consumption. implement policies to improve the energy efficiency of existing buildings especially during renovations. develop building energy performance labels or certificates that provide information to owners, buyers and renters. establish policies to improve the energy efficiency performance of critical building components in order to improve the overall energy performance of new and existing buildings. How is the heat produced? Heat pumps for space and water heating is assumed. In some places the space heating demand is deemed to be fully met with solar photovoltaic (PV) and some form of storage, or with a lowcapacity heat pump. However also industrial excess heat and heat from thermal power generation are included in high-density areas where demands are concentrated and diverse. In the report it is recognised that these networks offer larger potential for other, low-grade heat resources including renewable heating and cooling technologies and large-scale heat pumps. Besides this a widespread deployment of solar thermal systems is deemed needed to achieve the 2DS targets. For the 2DS scenario the CO 2 intensity of the district energy networks is reduced to one sixth of today in 2050 by use of mainly biomass and excess heat (and due to improvements in the efficiency of the building stock). Besides this gas represents around 30%. The share of district energy networks in useful energy demand in buildings is doubled in the period from 2010 to WORLD ENERGY OUTLOOK, 2012 (IEA) Heat sector in general As in most other reports, the energy consumption is defined for the sectors industry, transport and buildings and the heat demand is not a specific focus area. Looking at the building sector, the energy consumption covers energy for heating, cooling, lighting, refrigeration and for powering electrical appliances. However the change in demand for space and water heating from 2010 to 2035 is provided separately for the residential sector and shows a reduction of more than 60% for the most ambitious scenario ( Efficient World Scenario ). For the New Policies Scenario which takes broad policy commitments and plans that have already been implemented as well as those that only have been announced into account, the development in space and water heating demand shows an increase close to 50%. Looking at Europe separately, the space heating demand accounts for 43% of the savings in the residential sector in 2020 in the Efficient World Scenario compared to the New Policies Scenario (and 42% in 2035). Heat savings In the New Policies Scenario several political initiatives are assumed. For Europe some of these are: The Energy Efficiency Directive. Building energy performance requirements for new buildings (zero-energy buildings by 2021) and for existing buildings when extensively renovated. (A 3% renovation rate of central government buildings is assumed.) Mandatory energy labelling for sale or rental of all buildings and some appliances, lighting and equipment. In the 450 scenario, which sets out an energy pathway that is consistent with a 50% chance of 136
138 meeting the goal of limiting the increase in average global temperature to 2 C (compared with pre-industrial levels), the zero-carbon footprint for all new buildings is assumed already from Besides energy efficiency measures, an important way to achieve GHG emission reductions is by introducing more renewables. However in 2020, almost three-quarters of the emissions saved originate from energy efficiency, including electricity savings, end-use efficiency and power plant efficiency. In other words, energy savings are seen as the main way to achieve the GHG reductions. How is the heat produced? Since the report covers the entire world, there is a large variation on the way to supply the heat demand. Electricity s dominance of energy use in buildings grows, mainly at the expense of traditional biomass, which becomes a less important energy source for households in developing countries. The share of electricity in building energy use continues to grow strongly in both the New Policies Scenario and the Efficient World Scenario. In the latter case it increases from 29% in 2010 to 36% in The use of oil in buildings worldwide is expected to decline, due to the use of more efficient appliances and increasing substitution with electricity and gas. In the New Policies Scenario, worldwide use of gas for power (and delivered heat) increases by half between 2010 and 2035 (an average rate of 1.6% per year). The gas consumption in buildings for space and water heating grows at 1.3% per year on average over the projection period. The building sector remains the largest end-use sector for gas (43% in 2035), even though, in many OECD countries, most of the scope for switching from heating oil and other fuels to gas is said to be exhausted. The use of modern renewables to produce heat almost doubles, from 337 Mtoe (14.11 EJ) in 2010 to 604 Mtoe (25.29 EJ) in This heat is used mainly by industry (where biomass is used to produce steam, in co-generation and in steel production) but also by households (where biomass, solar and geothermal energy are used primarily for space and water heating). It is stated that lack of data makes analysis of CHP on a global level difficult. In the IEA s statistics, the heat produced by CHP installations is measured only if the heat is sold by the producer to another entity. Heat produced in an industrial CHP facility and used by the same firm is not reported and only the corresponding fuel consumption is accounted for. This makes it difficult to analyse the current extent of CHP use globally, and to model its future development. 137
139 10.8 DESERT POWER 2050: PERSPECTIVES ON A SUSTAINABLE POWER SYSTEM FOR EUMENA (DII) Heat sector in general The heating sector is not considered separately. The demand which the report addresses is the electricity demand. In this, the electricity used for heating is included, but it does not explain to what extent the heating and cooling demand is expected to be based on electricity. The report refers to EU energy trends 2030 Update 2009 (renewable energy sources electricity scenario) regarding the electricity demand of EU27 (+2) assuming that the total electricity demand in the year 2010 stagnates until It is stated that the idea that renewable electricity should be produced in areas with optimal resources and exported to regions with high demand has become known as the Desertec vision. The primary purpose of the study is to analyse whether an EUMENA wide power system integration is able to deliver advantages in terms of system cost and security of supply and it concludes that a power system based on more than 90% renewable energy is technically possible and economically viable. Heat savings How is the heat produced? In the Low Demand Connected Scenario it is assumed that there will be an implementation of energy efficiency measures, energy efficient/generating buildings (especially with regard to the electricity need for heating/air conditioning) and the expansion of distributed PV, possibly in combination with decentralized storage. All of these enable consumers to consume their own electricity and thus reduce demand for power from the transmission grid. This scenario does not assume a given self supply rate. Disregarded. 138
140 10.9 POLICY REPORT CONTRIBUTION OF ENERGY EFFICIENCY MEASURES TO CLIMATE PROTECTION WITHIN THE EUROPEAN UNION UNTIL 2050 (FRAUNHOFER) And the Scientific Support in the Preparation of Proposals for an EU Energy Roadmap (March 2012) accompanying the report mentioned above Heat sector in general The energy system is described in sectors, where the heat demand is not indicated separately. In a comparison of different reports a conclusion underlines the need for further investigations: On the basis of this analysis of different energy scenarios, a strong need for a more in-depth analysis of single energy efficiency technologies is identified. In order to exploit the energy saving potential that is advocated as an important option in the whole set of all decarbonisation scenarios, concrete technologies need to be evaluated regarding their potential and their costeffectiveness. Heat savings In terms of the household sector demand, the baseline final energy demand is said to decline after 2015 reaching today s level by 2040 and that it is possible to reduce it by 71% by 2050 compared to the baseline. Half of the savings relate to the building shell refurbishment of existing buildings and efficiency options such as refurbishment, replaced heating systems, implementing highly efficient new buildings are said to be able to trigger 80% of the cumulative energy cost reduction. 100% conversion efficiency is assumed for all renewable energy carriers (apart from biogenic sources) and this way renewables have a significant impact not only on the reduction of primary energy demand, but also on lowering GHG emissions. By 2050, 25% of the projected primary energy demand is deemed possible to reduce via the shift towards a highly efficient power sector, and an additional 42% from final energy related efficiency measures. How is the heat produced? Be electrifying the heating sector and including a lot more heat pumps, the GHG emission reductions rely on the decarbonisation of the power generation sector. 139
141 10.10 RETHINKING 2050 A 100% RENEWABLE ENERGY VISION FOR THE EU (EREC) Heat sector in general The report states under the headline Heating and Cooling Measures to Awaken the Sleeping Giant that Most people, including some decision makers, underestimate the share of energy used for heating purposes. Additional policy support for district heating infrastructure and CHP systems based on renewable energy sources is deemed needed to unfold the full potential of the heating and cooling sector. New policy initiatives in this field need to address the key barriers to growth, including often high upfront investment costs particularly for households. The aim is to reach 100% renewable energy in 2050 stating that the precise mix of renewable energy technologies is not forecasted but rather seen as a prognosis, within which a wide range of options exist. Hence, the aim of the report is not to discriminate between the various RES technologies, but rather to keep a focus on remaining on the overall 100% RES pathway, showing that both in technical and economic terms, it is feasible to get to a fully sustainable energy system based on renewable energy in the EU by As a sector, heating and cooling remains the largest contributor to final energy demand. The heating and cooling demand accounts for 49% of the overall final energy demand in the EU and is assumed most likely to remain a high share of the final energy demand in the future to come. Heat savings How is the heat produced? In the report net- or nearly-zero-energy buildings are mentioned as the norm from Besides this, the European Union is said to have to develop a strategy that ensures that all existing buildings after 2030 and all buildings (existing and new constructions) become net-zero/positive energy buildings as of To meet the overall target of at least 20% by 2020, the share of renewable heating and cooling could almost triple compared to the current share of about 10%. Most of the growth is suggested to be based on biomass. In 2030, solar thermal comes second with a contribution of 48 Mtoe (2.0 EJ) and geothermal third with 24 Mtoe (1.0 EJ). In the long run solar thermal will make up a share of about 20% of total RES heat contribution, while geothermal will increase to about 10%. By 2050, biomass is projected to contribute with Mtoe (8.98 EJ), while geothermal could account for Mtoe (5.70 EJ) and solar thermal for 122 Mtoe (5.11 EJ) supplying about 26% of the EU s total heat consumption. Between 2020 and 2050, RES-heating and cooling will see an increase of about 30% amounting to around 470 Mtoe (19.68 EJ) in It will reach a share of almost 30% of total heat consumption by 2020 and cover more than half of the EU s heat demand by By 2050 renewable heating and cooling will provide 100% of the consumption assumed in the 2050 scenario. Thermally-driven cooling technologies are assumed to play a major role in the future, thereby helping to reduce electricity peaks in summer. 140
142 10.11 EU ENERGY POLICY TO 2050 ACHIEVING 80-95% EMISSIONS REDUCTIONS (EWEA) Heat sector in general The study focuses on the policies which in EWEA s opinion are to be promoted/implemented in order to achieve emission reductions of 80-95% with main focus on the electricity grid. The heating sector is not dealt with separately. Heat savings Not described. How is the heat produced? Not described RENOVATION TRACKS FOR EUROPE UP TO 2050 (EURIMA/ECOFYS) Heat sector in general The aim of the study is to evaluate different building renovation strategies at the EU level with respect to the speed of renovation and the future ambition level. Besides this it relates the results to existing and newly discussed targets with a view to create and support a common understanding of the mechanisms and implications (achieving or missing long-term targets and their financial consequences). Heat savings Heat savings are included by renovating building stock with retrofit rates of % per year. How is the heat produced? Since the target of the report is the renovation possibilities and not the energy sector (outside the buildings) the focus is not on the produced heat. For the shallow renovation the future heating systems for retrofits are based on 75% Gas condensing boiler 15% Oil condensing boiler 3% Air-water heat pump 3% Ground-water heat pump 4% Biomass boilers (And no solar thermal systems for domestic hot water.) For the scenario Shallow renovation + REN the future heating systems for retrofits is based on: 40% Air-water heat pump 40% Ground-water heat pump 15% Biomass boilers 5% District heat (with growing share of renewable energy) 80% of all retrofits have solar thermal systems for domestic hot water with maximum domestic hot water coverage of 60%. For the deep renovation scenario the future heating systems for retrofits is based on 35% Air-water heat pump 35% Ground-water heat pump 15% Biomass boilers 15% District heat (with growing share of renewable energy) 80% of all retrofits have solar thermal systems for domestic hot water with maximum domestic hot water coverage of 60%. 141
143 10.13 EUROPE S BUILDINGS UNDER THE MICROSCOPE A COUNTRY-BY-COUNTRY REVIEW OF THE ENERGY PERFORMANCE OF BUILDINGS (BPIE) Heat sector in general The report only focuses on buildings. A renovation model has been specifically developed to illustrate the impact on energy use and CO 2 emissions at different rates (percentage of buildings renovated each year) and depths of renovation (extent of measures applied and size of resulting energy and emissions reduction) from now up to Two decarbonisation pathways are considered: A slow pathway based on what has been witnessed since 1990 and a fast pathway based on what is needed to achieve the levels of carbon reduction assumed in the EU 2050 Roadmap. All but one scenario assume that a building will be renovated once between 2010 and The so-called two-stage scenario even allows for a second renovation during the period. Individual scenarios combine different speeds and depths, and are compared to a business-as-usual scenario, which assesses what would happen if there were no changes from the approach taken today. Heat savings A key driver for implementing energy efficiency measures are the building energy codes, through which energy-related requirements are incorporated during the design or retrofit phase of a building. However the current EU legislation is said only to partially cover the field of buildings renovation. The EPBD stipulates the implementation of energy saving measures only in case of deep renovation of the building without specifying the depth of renovation measures. More targeted measures are deemed required for fostering the deep renovation of the existing building stock. However the recast EPBD which should also gradually converge to nearly zero energy standards is predicted to implement major changes through the application of a cost-optimality concept in energy performance requirements for new buildings from 2020 onwards. The ambition is to see all EU buildings renovated between now and It can be seen that, in order to achieve 100% renovation within 40 years, an average renovation rate of 2.5% p.a. needs to be attained. However, with current rates as low as 1%, levels of activity need to more than double to achieve the required annual rate. In the deep and two-stage scenarios there is a 71-73% CO 2 emission reduction even under the slow decarbonisation assumption, a figure which is close to the CO 2 emission reduction for the slow and shallow scenario under the fast decarbonisation assumption. This highlights the role of renovation measures in the decarbonisation strategy. How is the heat produced? Not described. Referring to Eurostat and Primes forecasts and targets of A Roadmap for moving to a competitive low carbon economy in
144 10.14 POWER CHOICES PATHWAYS TO CARBON-NEUTRAL ELECTRICITY IN EUROPE BY 2050 (EURELECTRIC) Heat sector in general Heat savings How is the heat produced? The heating sector is not a focus area. The main focus is on electrifying the final energy usage (and then use either heat pumps or direct electricity for heating). Heat savings are not mentioned in detail besides the fact that it will require improved building insulation. A major reason for the decrease in primary energy consumption is the considerably lower demand in the residential sector due to substitution of (inefficient) oil and gas to electricity and improvement in building insulation. Besides this, more efficient electric appliances are mentioned as a contributor to the decrease in demand for the residential sector. However a point not mentioned in the report is that this will in fact not help to decrease the heat demand, but just the opposite. The heating is supplied mainly by means of heat pumps or direct electric heating and to some extent direct use of solar thermal and biomass. Some DH/CHP is assumed co-generation is assumed to double from 2010 to 2020 and represent almost 20% of power generation by 2030 (both for industrial and district heating uses, mainly through gas and biomass plants). However the development slows down thereafter because CHP is said not to be unable to deliver a fully decarbonised output. This indicates implicitly that the report deem it undesirable (or at least unfeasible) to combine CHP with CCS. Due to already made decisions on investments in gas power plants and carbon prices, the use of gas is assumed to increase in the short-term future, but after CCS is believed to be commercial in 2020, gas plants with CCS is said to be less competitive than coal fired power plants with CCS. Since around 60% of the power generation is assumed to come from gas, nuclear, solids and oil in 2050 the report strongly depends on the predicted competitiveness of CCS (by ). 143
145 11 ANNEX III: PROFILING BOILERS IN THE EU27 AND EVALUATING THE FUTURE HEAT DEMANDS Report by Ecofys By: Jan Grözinger Thomas Boermans Michelle Bosquet (Ecofys Germany GmbH) David Connolly (Aalborg University) Date: 28 February 2013 Project number: BUIDE13319 Ecofys 2013 by order of: Aalborg University 144
146 Table of Contents 11.1 Overview of investment costs Overview of investment costs per heating system Impact of reduced heat load Building stock floor area in 2012 and Number of boilers in 2012 and Recommended boiler efficiencies WP 3b: Evaluation of the used scenarios Energy roadmap 2050 the high efficient scenario [European Commission, 2011a; European Commission, 2011b] Renovation tracks for Europe, up to Building renovation in Europe what are the choices? [EURIMA, 2012] Recommendations for possible adaptations of the energy efficiency scenario References
147 11.1 OVERVIEW OF INVESTMENT COSTS Overview of investment costs per heating system Data assessment Information on investment costs for replacement of heating systems in buildings are mainly based on the BMVBS-online publication Nr. 07/2012. The project was executed by the Institute of Wohnen und Umwelt (IWU) [BMVBS (Hrsg.), 2012]. The study investigated the investment costs of building and equipment components. Additional cost data was gathered from producers such as Windhager, Viessmann, Brötje, Weishaupt, Buderus. It is important that costs for boilers in case of small boilers (up to 40 kw) are not significantly dependent from the system size. The IWU in its study calculates cost curves that are floor area dependent. The reason is that in case of small systems, the share of installation costs in the total costs is relatively high. In large buildings with boilers larger than 40kW, the dependency on floor area is not so strong anymore; the costs are more dependent on system size. The costs from IWU have been adapted to consider this phenomenon, taking into account costs from the producers for different size of boilers. The developed investment costs per system represent the purchase price for consumers (excluding taxes) and comprise the costs of the system (including fuel and thermal storage), the installation and other costs (average costs of necessary grid connections, storage, chimneys and disposal costs). The costs do not include maintenance and operation costs. Based on country factors [Baukosteninformationszentrum Deutscher Architektenkammern (BKI), 2011] the cost data for Germany were extrapolated to the other Member States. 146
148 Costs for replacement of heating systems in all EU27 countries Table 26: Costs (in Euro) for replacement of gas heating systems in EU27, by ranges 8-20 kw kw kw kw AUSTRIA 6,025 8,996 17,310 21,554 BELGIUM 4,903 7,322 14,088 17,542 BULGARIA 2,243 3,349 6,444 8,024 CYPRUS 3,698 5,523 10,626 13,231 CZECH REPUBLIC 3,269 4,881 9,392 11,695 DENMARK 7,373 11,009 21,184 26,377 ESTONIA 3,531 5,273 10,146 12,634 FINLAND 5,405 8,070 15,528 19,335 FRANCE 5,906 8,818 16,967 21,127 GERMANY 5,965 8,907 17,139 21,341 GREECE 3,603 5,380 10,352 12,890 HUNGARY 3,072 4,587 8,827 10,990 IRELAND 5,100 7,616 14,654 18,246 ITALY 3,925 5,861 11,277 14,042 LATVIA 4,122 6,155 11,843 14,746 LITHUANIA 3,669 5,478 10,540 13,124 LUXEMBOURG 5,082 7,589 14,602 18,182 MALTA 3,197 4,774 9,186 11,439 NETHERLANDS 6,389 9,540 18,356 22,856 POLAND 3,537 5,282 10,163 12,655 PORTUGAL 2,941 4,391 8,449 10,521 ROMANIA 2,273 3,394 6,530 8,131 SLOVAKIA 3,454 5,157 9,923 12,356 SLOVENIA 3,770 5,629 10,832 13,487 SPAIN 4,068 6,075 11,689 14,554 SWEDEN 7,188 10,733 20,652 25,715 UNITED KINGDOM 5,774 8,622 16,590 20,
149 Table 27: Costs (in Euro) for replacement of oil heating systems in EU27, by ranges 8-20 kw kw kw kw AUSTRIA 7,112 10,739 21,575 25,819 BELGIUM 5,788 8,740 17,559 21,013 BULGARIA 2,648 3,998 8,032 9,612 CYPRUS 4,366 6,592 13,244 15,849 CZECH REPUBLIC 3,859 5,827 11,706 14,009 DENMARK 8,704 13,142 26,403 31,596 ESTONIA 4,169 6,294 12,646 15,133 FINLAND 6,380 9,633 19,354 23,160 FRANCE 6,971 10,526 21,148 25,308 GERMANY 7,042 10,632 21,361 25,563 GREECE 4,253 6,422 12,902 15,440 HUNGARY 3,626 5,476 11,001 13,165 IRELAND 6,021 9,091 18,264 21,857 ITALY 4,633 6,996 14,056 16,821 LATVIA 4,866 7,347 14,761 17,664 LITHUANIA 4,331 6,539 13,137 15,721 LUXEMBOURG 6,000 9,059 18,200 21,780 MALTA 3,774 5,699 11,450 13,702 NETHERLANDS 7,542 11,387 22,878 27,378 POLAND 4,176 6,305 12,667 15,159 PORTUGAL 3,472 5,242 10,531 12,603 ROMANIA 2,683 4,051 8,139 9,740 SLOVAKIA 4,077 6,156 12,368 14,801 SLOVENIA 4,450 6,720 13,500 16,156 SPAIN 4,802 7,251 14,569 17,434 SWEDEN 8,485 12,812 25,741 30,804 UNITED KINGDOM 6,816 10,292 20,678 24,
150 Table 28: Costs (in Euro) for replacement of pellet heating systems in EU27, by ranges 8-20 kw kw kw kw AUSTRIA 15,160 20,939 30,451 47,425 BELGIUM 12,338 17,041 24,783 38,598 BULGARIA 5,644 7,795 11,336 17,655 CYPRUS 9,306 12,854 18,692 29,113 CZECH REPUBLIC 8,225 11,361 16,522 25,732 DENMARK 18,552 25,624 37,264 58,038 ESTONIA 8,886 12,273 17,848 27,798 FINLAND 13,599 18,783 27,315 42,542 FRANCE 14,860 20,524 29,848 46,486 GERMANY 15,010 20,732 30,149 46,956 GREECE 9,066 12,522 18,210 28,361 HUNGARY 7,730 10,677 15,527 24,182 IRELAND 12,833 17,725 25,778 40,147 ITALY 9,876 13,641 19,838 30,897 LATVIA 10,372 14,326 20,833 32,447 LITHUANIA 9,231 12,750 18,542 28,878 LUXEMBOURG 12,788 17,663 25,687 40,006 MALTA 8,045 11,112 16,160 25,168 NETHERLANDS 16,075 22,204 32,290 50,290 POLAND 8,901 12,294 17,878 27,845 PORTUGAL 7,400 10,221 14,864 23,149 ROMANIA 5,719 7,899 11,487 17,890 SLOVAKIA 8,691 12,004 17,456 27,187 SLOVENIA 9,486 13,102 19,054 29,676 SPAIN 10,237 14,139 20,562 32,024 SWEDEN 18,087 24,982 36,330 56,582 UNITED KINGDOM 14,529 20,068 29,184 45,
151 Table 29: Costs (in Euro) for replacement of air heat pumps in EU27, by ranges 8 kw 15 kw 20 kw 30 kw 150 kw 300 kw AUSTRIA 14,456 18,193 20,862 26,201 90, ,342 BELGIUM 11,765 14,806 16,979 21,324 73, ,635 BULGARIA 5,382 6,773 7,766 9,754 33,603 63,414 CYPRUS 8,874 11,168 12,806 16,084 55, ,566 CZECH REPUBLIC 7,843 9,871 11,319 14,216 48,975 92,423 DENMARK 17,690 22,264 25,530 32, , ,458 ESTONIA 8,473 10,663 12,228 15,357 52,907 99,844 FINLAND 12,967 16,319 18,714 23,503 80, ,802 FRANCE 14,169 17,832 20,449 25,682 88, ,969 GERMANY 14,313 18,013 20,655 25,941 89, ,655 GREECE 8,645 10,880 12,476 15,668 53, ,868 HUNGARY 7,371 9,276 10,638 13,360 46,025 86,858 IRELAND 12,237 15,401 17,660 22,180 76, ,200 ITALY 9,418 11,852 13,591 17,069 58, ,975 LATVIA 9,890 12,447 14,273 17,925 61, ,541 LITHUANIA 8,802 11,078 12,703 15,954 54, ,723 LUXEMBOURG 12,194 15,347 17,598 22,102 76, ,694 MALTA 7,672 9,655 11,071 13,904 47,902 90,399 NETHERLANDS 15,329 19,292 22,122 27,783 95, ,630 POLAND 8,487 10,681 12,249 15,383 52, ,013 PORTUGAL 7,056 8,880 10,183 12,789 44,059 83,147 ROMANIA 5,453 6,863 7,870 9,884 34,050 64,258 SLOVAKIA 8,287 10,429 11,960 15,020 51,745 97,652 SLOVENIA 9,046 11,384 13,054 16,395 56, ,590 SPAIN 9,761 12,285 14,087 17,692 60, ,023 SWEDEN 17,247 21,705 24,890 31, , ,230 UNITED KINGDOM 13,855 17,436 19,994 25,111 86, ,
152 Table 30: Costs (in Euro) for replacement of brine heat pump systems in EU27, by ranges 8 kw 15 kw 20 kw 30 kw 150 kw 300 kw AUSTRIA 23,108 31,467 37,438 49, , ,807 BELGIUM 18,807 25,610 30,469 40, , ,600 BULGARIA 8,603 11,714 13,937 18,383 71, ,415 CYPRUS 14,185 19,316 22,982 30, , ,238 CZECH REPUBLIC 12,538 17,073 20,313 26, , ,733 DENMARK 28,278 38,508 45,815 60, , ,004 ESTONIA 13,544 18,444 21,944 28, , ,931 FINLAND 20,728 28,227 33,583 44, , ,522 FRANCE 22,650 30,844 36,697 48, , ,445 GERMANY 22,879 31,155 37,067 48, , ,126 GREECE 13,819 18,818 22,389 29, , ,348 HUNGARY 11,783 16,045 19,090 25,179 98, ,585 IRELAND 19,562 26,638 31,692 41, , ,748 ITALY 15,054 20,500 24,390 32, , ,227 LATVIA 15,809 21,528 25,613 33, , ,375 LITHUANIA 14,071 19,161 22,796 30, , ,398 LUXEMBOURG 19,493 26,544 31,581 41, , ,643 MALTA 12,263 16,699 19,868 26, , ,316 NETHERLANDS 24,503 33,368 39,699 52, , ,263 POLAND 13,567 18,475 21,981 28, , ,299 PORTUGAL 11,279 15,360 18,274 24,103 94, ,486 ROMANIA 8,717 11,870 14,123 18,627 72, ,256 SLOVAKIA 13,247 18,039 21,462 28, , ,145 SLOVENIA 14,460 19,690 23,426 30, , ,656 SPAIN 15,603 21,248 25,280 33, , ,062 SWEDEN 27,569 37,542 44,666 58, , ,592 UNITED KINGDOM 22,147 30,158 35,881 47, , ,
153 Investments in heating system replacements in Europe in 2012 and 2050 Merging the assessed costs data with information on replacement activities (replacement rates and technology mix based on information from the Ecofys BEAM² model), the average investments in heating system replacements in Europe per year were calculated, see Table 31 and Table 32. Table 31: Investment costs (in Mio Euro) per heating system in EU27 in 2012 Gas Oil Pellet Air heat pump Brine heat pump others Residential 19,990 7,333 6,689 4,091 7, ,265 Total 4,251 1,497 1,103 1,576 3, ,169 Total 24,241 8,830 7,792 5,667 11, ,434 Table 32: Investment costs (in Mio Euro) per heating system in EU27 in 2050 Gas Oil Pellet Air heat pump Brine heat pump others Residential 2, ,300 5,603 15, ,359 Nonresidential Nonresidential Total 7,686 1,064 9,034 16,543 64, ,496 Total 10,521 1,455 14,334 22,146 80, ,
154 Impact of reduced heat load In case of renovation, heat load is reduced. This might result in different impacts on costs for heating systems different, depending on system size and system: - in case of heat pumps the costs are directly dependent on system size, e.g. in case of the brine heat pump every additional kw needed results in higher costs (additional drilling, additional tube). - in case of boilers, the impact depends on the size of the system: o if the system is up to 20 kw (normally installed in single family houses), the costs are the same (e.g. for a 8 kw or for a 15 kw boiler) o if the system size ranges from kw, the costs of boiler are the same as for the boilers of up to 20 kw. However; the study from IWU found out that boilers in the range kw (that are normally installed in small multifamily houses) the companies charge higher installation costs, which increases the total costs o if the size is larger than 40 kw, the costs for boilers increase with increasing power (kw), the share of the installation costs becomes marginal. Table 33 examples for the impact of reduced heat demand on the heating systems costs in Germany for a gas heating system and an air heat pump for a single family, a small multifamily and a large multifamily building: Table 33: Example of effect of reduced heat demand on costs of heating systems in Germany (Euro) Partly renovated Not renovated Capacity in kw Costs of gas heating system Costs of air heat pump Single family building Small multifamily building Large multifamily building Single family building Small multifamily building Large multifamily building < < ,965 8,907 17,139 5,965 8,907 21,341 14,313 (8 kw) 20,655 89,370 18,013 (15 kw) 25, ,

155 Building stock floor area in 2012 and 2050 The following figure illustrates the development of the heated floor areas in the EU27 countries. As for most statistics 1979 is a crucial date (i.e. introduction of the Thermal Insulation Ordinance in Germany) and from then on mandatory requirements for the building shell have been introduced, we distinguish buildings before and after In the deep renovation scenario, the stock is completely renovated by 2045, with a very small share of buildings assumed to have not been renovated. About one quarter of the building stock in 2050 will be new buildings. Figure 67: Heated floor area EU27 track Target Scenario, Deep Renovation [billion m²] 154
156 Number of boilers in 2012 and 2050 The number of boilers is based on the number of buildings. To calculate the number of buildings we made assumptions 14 on reference buildings and on the share of central and decentred heating systems. In 2050 the boiler stock grows by about 46%. Table 34: Number of boilers in the EU in 2012 and in 2050 in Mio units 2012 Gas Oil Pellet Heat pump el-direct and coal* Residential Total Total 2050 Residential Nonresidential Nonresidential Total * it was assumed that in 2050 the number of coal heating system will be insignificant 14 We made assumptions regarding the share of central and decentred boilers and on geometries of the reference residential and non-residential buildings. For single family buildings that is safer than for nonresidential buildings. In comparison, the uncertainty for non-residential buildings grows. 155
157 Recommended boiler efficiencies Illustrated the recommends boiler efficiencies for EnergyPLAN in Energy Efficiency Scenario. Table 35: Recommended boiler Efficiencies for EnergyPLAN in Energy Efficiency Scenario Solids 70% 70% 70% Oil cond. 95% 95% 95% Oil non-cond. 80% 80% 80% Gas cond. 98% 98% 98% Gas non-cond. 80% 80% 80% Biomass 75% 75% 75% Solar 100% 100% 100% Electricity 100% 100% 100% Geothermal 100% 100% 100% Heat Pumps ground water 300% 300% 300% Heat Pumps air 250% 250% 250% 156
158 11.2 WP 3B: EVALUATION OF THE USED SCENARIOS The scenarios from the Energy Roadmap 2050 report have been used during the first pre-study to describe the demand side of the EUs building sector. However; uncertainties remain about the suitability of the scenarios (are they ambitious enough/overambitious?) and related estimated investment costs. This chapter first summarizes the basic assumptions of the high energy efficient scenario of the Energy Roadmap 2050 and then looks into previous work by Ecofys with the BEAM² model for a study for Eurima: Renovation tracks for Europe, up to 2050 [EURIMA, 2012]. The scenarios will be compared with focus on underlying assumptions and on the calculated outcome (heating demand) in order to afterwards evaluate the suitability of the high energy efficiency scenario (scenario 2). On that basis, recommendations on possible adaptations of the scenarios for the second pre-study will be made Energy roadmap 2050 the high efficient scenario [European Commission, 2011a; European Commission, 2011b] Assumptions The objective of the study is to shape a vision and strategy of how the EU energy system can be decarbonised by 2050 while taking into account the security of supply and competitiveness objectives [European Commission, 2011a]. The study modelled different scenarios: - Business as usual (BAU, Reference scenario) - Current Policy Initiatives CPI scenario (updated Reference scenario) - Decarbonisation Scenarios - High Energy Efficiency - Diversified supply technologies - High RES - Delayed CCS - Low nuclear The BAU and CPI scenarios are built on a modelling framework including PRIMES, PROMETHEUS, GAINS, and GEM-E3 models (see [European Commission, 2011a] for more information). Since the objective of this task is the evaluation of the energy efficient scenario, the focus is on this scenario. Main assumptions of the reference and the high efficient scenario are summarized in Table
159 Table 36: Short description of the business as usual and the high energy efficiency scenario This scenario is based on the scenarios up to 2030 published in the report Energy Trends to 2030: update 2009, but extends the projection period to 2050 Business as usual (Reference scenario) The Reference scenario includes current trends and long-term projections on economic development (GDP growth 1.7% pa). It takes into account rising fossil fuel prices and includes policies implemented by March The 2020 targets for GHG reductions and RES shares will be achieved but no further policies and targets after 2020 (besides the ETS directive) are modelled. Sensitivities for higher/ lower GDP growth rates and energy import prices are modelled. The scenario focuses on direct impacts on final energy demand. High Energy Efficiency (Scenario 2) This scenario is driven by a political commitment of very high primary energy savings by 2050 and includes a very stringent implementation of the Energy Efficiency plan. It includes further and more stringent minimum requirements for appliances and new buildings; energy generation, transmission and distribution; high renovation rates for existing buildings (more than 2% refurbishment rate); the establishment of energy savings obligations on energy utilities; the full roll-out of smart grids, smart metering and significant and highly decentralised RES generation to build on synergies with energy efficiency and passive house standards after 2020 (all new buildings comply with the passive house standard kwh/m² (depending on the country). The EU-EE scenario includes the following energy efficiency measures, with some of them occurring in other sectors than buildings, such as electricity and transport. Details of macroeconomic and demographic assumptions, assumptions on energy import prices, policy assumptions, assumptions on energy infrastructure development, technology assumptions and any other assumptions are found in [European Commission, 2011a; European Commission, 2011b] Heat demands The assumptions relating to the future heat demand in the EU27 are of critical importance when analysing the future role of district heating. In Heat Roadmap Europe 1, the results indicated that under existing policies (i.e. the CPI scenario), the heat demand will be sufficient for district heating to be implemented at a cheaper cost than a business-as-usual scenario. Hence, a key motivation for choosing the Energy Efficiency (EE) scenario in this study was to investigate the feasibility of district heating if the heat demands are reduced significantly compared to the business-as-usual scenario. To begin, the first step is to analyse the scale of energy efficiency measures being implemented in the EU- EE scenario. As outlined in Figure 68, the total heat demand in the EU-EE scenario is expected to drop by approximately 60% between 2015 and This is a much larger reduction than in the CPI scenario: by 2050, the total heat demand in the EU-EE scenario is approximately 50% of the heat demand in the CPI scenario. 158
160 CPI Scenario Energy Efficiency Scenario Space and Hot Water Heat Demands in the Energy Efficiency Scenario (TWh) 4,000 3,500 3,000 2,500 2,000 1,500 1, Figure 68: Total heat demand in the EU-CPI and EU-EE scenarios for This total heat demand can be broken down into a number of key sectors: firstly the heat demand provides two distinct services, hot water and space heating. Figure 69 outlines how the total heat demand in the EU-EE scenario is divided between these two services, which indicates that the space heating demand is expected to drop by approximately 60% and the hot water demand by 55% between 2015 and Space and Hot Water Heat Demands in the Energy Efficiency Scenario (TWh) 4,500 4,000 3,500 3,000 2,500 2,000 1,500 1, Space Heating Hot Water Total Figure 69: Space heating and hot water demand in the Energy Efficiency scenario between 2015 and
161 Secondly, the heat demand can be divided in terms of two distinct sectors, residential and nonresidential/services. Figure 70 indicates that the heat demand will reduce by approximately 60-62% in both of these sectors between 2015 and 2050, similar to the overall trend in the total heat demand. However, it is important to recognise that there are other dynamics involved in these changes also such as the population and the building stock. Space and Hot Water Heat Demands in the Energy Efficiency Scenario (TWh) 4,500 4,000 3,500 3,000 2,500 2,000 1,500 1, Residential Services Total Figure 70: Residential and services heat demand in the Energy Efficiency scenario between 2015 and While the heat demand is reducing in the EU-EE scenario, both the population and the building stock experience an increase. Table 37 summarises the changes assumed in population in the EU-EE scenario, suggesting a 3.2% overall growth in population between 2010 and Table 38 presents similar statistics for the building stock in Europe: the total building stock is expected to grow by 35% between 2015 and 2050, which includes a growth of 42% for the residential sector and 32% for the services sector. 160
162 Table 37: Population assumptions in the Energy Efficiency scenario between 1990 and 2050 [European Commission, 2011]. Year Population (Million) Population 1-Year Change (%) Population 5-Year Change (%) Population 20- Year Change (%) Population 40- Year Change (%) Start Start % 1.4% % 0.9% % 1.7% % 2.1% Start Start % 1.7% % 1.2% % 0.8% % 0.4% 4.1% % 0.1% % -0.1% % -0.3% % -0.6% -0.9% 3.2% Table 38: Estimated building floor are for the residential and non-residential/service sectors in the EU27 between 2015 and PRIMES Estimate* [9] Ecofys Estimate [42] Floor area in Mio m² Residential 21,724 23,579 25,066 26,387 27,343 28,053 28,515 28,730 Change per year in% Residential Non- Residential 17,498 (in 2012) 8,642 (in 2012) 1.7% 1.2% 1.0% 0.7% 0.5% 0.3% 0.2% *In 2050, Ecofys estimated the residential floor area to be 15% lower than PRIMES. 24,198 12,233 This data is significant since it means that the specific heat demand reductions (i.e. kwh/m 2 ) are even larger than the absolute heat demand reductions portrayed in Figure 69 and Figure 70. Overall, Figure 71 shows that the specific heat demand reduction is very similar for both services and both sectors considered here, with a 70% reduction (+/-3%) for each between 2015 (2012) and
163 Space Heating Hot Water Total Residential Services 160 Specific Heat Demand (kwh/m2) Figure 71: Specific heat demand in the Energy Efficiency scenario for the residential and nonresidential/services sectors, as well as for the space heating, hot water, and total heat demand Investment costs The costs for the EE scenario are then divided into three types: Capital Energy purchases Direct efficiency investments The costs related to the scenario are summarized in Table 39. Table 39: Results for 2050 for residential and tertiary sector Capital cost * [BN EUR 08] Fuel and electricity costs Average annual direct efficiency investment costs** [BN EUR 08] Reference scenario 955 1, High energy efficiency scenario , Additional costs [BN EUR 08] Additional costs [%] 17% -24% 954% * Costs for energy installations such as power plants and energy infrastructure, energy using equipment, appliances and vehicles [European Commission, 2011a]. ** direct efficiency investment costs include costs for house insulation, double/triple glazing, control systems, energy management and for efficiency enhancing changes in production processes not accounted for under energy capital and fuel/ electricity purchase costs. It is assumed here that a lot of the energy efficiency costs are accounted for under capital costs rather than direct efficiency investments. For example, better appliances, new electric grids, the smart grid, 162
164 and more renewable energy generation are assumed to be under capital costs. Hence, it is assumed that direct efficiency investments relates to the implementation of space and hot water savings in the buildings sector, which amounts to B 295/year. This may not be the case so the cost of energy efficiency measures may be over-estimated based on this. In any case, other reports based on the Danish building stock also report a significant increase in energy efficiency costs when you reach this scale of energy savings [Kragh,Wittchen, 2010]. Therefore, the costs assumed here may not be correct, but the scale of the costs for energy efficiency measures seems to be correct. The aim in designing a new "enhanced energy efficiency" scenario in HRE-EE is to identify if the same objectives in the EU-EE scenario, in terms of energy and emission reductions, can be achieved in a way that is both cheaper and easier to implement. To achieve such an objective, the strategy is to replace some of the energy efficiency measures which are either very expensive and/or difficult to implement. In line with this, the following two subjects have been investigated further in the EU-EE scenario: The high reductions in the hot water end use seem very difficult to implement. The reduction per unit of space heating demand, below a total average reduction of 40-50% of the existing level, seems to be very ambitious in terms of implementation and also very expensive Renovation tracks for Europe, up to Building renovation in Europe what are the choices? [EURIMA, 2012] Assumptions This study analyses and compares the possible tracks for the renovation of the EU building stock, quantifying and illustrating graphically energy savings and avoided CO 2 emissions, financial impacts and employment effects. The study examines three renovation scenarios from 2012 to 2050, which are characterized by parameters: speed of renovation (= renovation rate) and ambition level regarding energy efficiency improvement and use of renewable energy. The different scenarios are designed to indicate the likely implications of using different approaches to meet the 2050 targets. Track 1: Shallow renovation: - Retrofit rate: 3% per year - Retrofit standard (demand side): Average standard, accompanied by market failures where certain measures are not carried out due to perceived barriers (Market failures described effects, where e.g. measures that are in principle financially feasible from a lifecycle perspective are not carried out, due to various barriers (e.g. high upfront investment/ financing needs, lack of information, aesthetics/tradition, investor user conflict, technical limitations etc.). - Renewable energy: Low contribution, no ventilation systems with heat recovery - Solar thermal systems for domestic hot water: none Track 2: Shallow renovation + RES: 163
165 - Doubling of renovation rate & average ambition level + market failures; no focus on energy efficiency; use of renewable energy - Retrofit rate: 2.3% per year (which is approximately a doubling of the current renovation rate). - Retrofit standard (demand side): accompanied by market failures where certain measures are not carried out due to perceived barriers. The demand side level (related to the building envelope) of the shallow renovation is the same level as applied in Track 1 (shallow renovation) - Renewable energy: high contribution, all retrofits with ventilation systems and heat recovery - Solar thermal systems for domestic hot water (max. DHW coverage 60%): 80% of all retrofits have solar thermal systems installed. Track 3: Deep renovation: - Doubling of renovation rate & high ambition level; focus on energy efficiency; use of renewable energy - Retrofit rate: 2.3% per year (which is approx. a doubling of the current renovation rate). - Retrofit standard (demand side): Very ambitious standard (reflects the level of Passive House standard for the building envelope - Renewable energy: high contribution, all retrofits with ventilation systems and heat recovery - Solar thermal systems for domestic hot water (max. domestic hot water coverage of 60%): 33% of all retrofits have Solar Thermal systems installed. - It is important to note that all three scenarios assume renovation rates of no more than 3% taking into account normal renovation cycles (30 to 40 years), which enables to connect the measures with already anticipated and (also non-energy related) renovation activities. The renovation rate in Tracks 2 and 3, namely 2.3% per year (which is approx. a doubling of the current renovation rate) still ensures that the building stock is renovated before New building standards: High ambition level for new buildings: - New building rate: 1.0% per year - New building standard (demand side): Ambitious standard (typically with final energy demand for heating and cooling below 15 kwh/m²a.) - Renewable energy: High contribution - All new buildings with ventilation systems and heat recovery - Solar thermal systems for domestic hot water (maximum DHW coverage 60%): 66% of all new buildings have solar thermal systems installed. The calculations are based on the five climate zones within the EU27. Important other assumptions: 164
166 - Retrofitting activities (according to the three defined scenarios) are implemented in the market from All 3 scenarios assume a small fraction of buildings will not be improved in the time period (e.g. monument type of buildings or due to compliance issues) - Energy uses of space heating and domestic hot water are included - Not included: cooling energy, lighting (for non-residential buildings) and auxiliary energy - New construction rate: 1.0%, demolition rate: 0.1% Heat demands Cooling, lighting and auxiliary energy are not included in this assessment. Energy consumption for hot water has been assessed. Following Table 40 gives an overview of the useful space heating demand. Table 40: Overview of the useful space heating demands in 2012 and 2050 for the three scenarios Scenario Retrofit rate Useful space heating demand 2012 [TWh] Useful space heating demand 2050 [TWh] Reduction in 2050 compared to 2012 [%] Shallow renovation 3% 2,562 2,870 12% Shallow renovation +RES 2.3% 3,364 2,397-6% Deep renovation 2.3% 3,364 1,208-47% Investment costs Based on investment costs for windows, insulation and building equipment (heating systems, etc.), the following Figure 72 and Figure 73 show the total investment costs per year required for the different scenarios. Figure 72: Annual investment costs for insulation and windows in the three scenarios created by Ecofys for energy efficiency in the EU27 [Boermans, Bettgenhäuser et al., 2012]. 165
167 In the shallow renovation scenario (Track 1), higher investments are necessary (lower investments per building but more renovations per year assumed) until approximately After that time, the whole building stock is retrofitted in the shallow renovation scenario and investment costs are dropping. Just the part for new buildings is remaining. For the Target scenarios (Tracks 2 and 3) retrofit activities continue to The deep renovation scenario shows higher investments in the building envelope. Figure 73 shows the investments for heating and ventilation systems. Figure 73: Investments for heating and ventilation systems per year EU27 [billion /a] Related to heating and ventilation system, the shallow renovation scenario (Track 1) shows lower necessary investments. This is a result of staying with standard fossil systems and not implementing ventilation systems in a large scale. The following graph shows the total investment necessary for the different scenarios. 166
168 Figure 74: Investments for building envelope (insulation + windows) and heating + ventilation systems per year EU27 [billion /a]. The shallow renovation scenario shows lower investments due to less extensive measures that are not overcompensated in terms of investments by the higher speed of implementation. Around 2044, the shallow renovation scenario drops in investments, because most retrofit activities will have finished, except at a low (shallow) ambition level. The shallow renovation + renewables track shows approximately 50 billion EURO of additional investments per year compared to the shallow renovation track, while the deep renovation track triggers additional investments of approximately 80 billion EURO per year compared to the shallow renovation track. Based on the assumption of approximately 17 jobs created per million invested 15 that would lead to 0.9 Million additional jobs (compared to the shallow renovation scenario) created and maintained in the shallow renovation + high use of renewable energy scenario and 1.4 million additional jobs in the deep renovation scenario. After 2044, the difference will get even more significant, when investments drop in the shallow renovation scenario while renovations continue for the other tracks. 15 Source: Urge-Vorsatz, D. (2011) et al. Employment Impacts of a Large-Scale Deep Building Energy Retrofit Programme in Hungary. Centre for Climate Change and Sustainable Energy Policy - Central European University & European Climate Foundation. 167
169 Recommendations for possible adaptations of the energy efficiency scenario Hot water demand The hot water demand should not be reduced in this study for the following reasons: 1. Table 37 indicates that population will grow by 3.2% between 2010 and According to a number of interviews with industry experts, people tend to wash more today than they did in the past, which is likely to continue into the future. In other words, individuals are likely to take more showers and baths in the future than they do today. 3. Families are not expected to live with one another as much in the future. Hence, there will a larger number of people living in their own houses rather than living with their family. This is also expected to increase the demand for hot water for an individual. 4. At present, there are regions in Europe where the use of hot water is limited due to technical and financial limitations. As these regions become wealthier, the demand for hot water is expected to rise in these regions. 5. The building area for residential and non-residential buildings is expected to grow by 32% and 42% respectively between 2015 and 2050 (see Table 38). For these reasons, the hot water demand is not expected to decrease in this study, even with appliances that use less water, pipes with more insulation, and better hot water management in buildings. Therefore, it is assumed here that the hot water will increase rather than decrease. It is unlikely that the hot water demand will increase as fast as the building area, since people will live in larger houses and use the hot water more efficiently. However, it is unlikely that the hot water demand will increase at a lower rate than the population, for the reasons outlined in 1-4 above. Therefore, it is assumed here that the hot water demand will grow at a rate between the residential floor area and the population, see Figure 75. Residential floor area Non-Residential Floor Area Population EE Hot Water HRE2 Hot Water 2.0% Annual Average Growth Rate (%/year) 1.0% 0.0% -1.0% -2.0% -3.0% -4.0%
170 Figure 75: Average annual growth rates for the residential floor area, non-residential floor area, population, the original EE scenario hot-water demand, and the new hot water demand assumed in this study (which is based on the average annual growth rate for the residential floor area and the population). The hot water demand in the new scenario is assumed to grow by 16% between 2015 and 2050 instead of reducing by 55% as in the original hot water demand projection for the EE scenario, as outlined in Figure 76. The specific hot water demand is assumed to drop from approximately 27 kwh/m 2 in 2015 to 23 kwh/m 2 in 2050, instead of from 27 kwh/m 2 to 9 kwh/m 2 as in the EE scenario (Figure 76). Hot Water Demand (TWh/year) EE Hot Water HRE2 Hot Water EE Hot Water HRE2 Hot Water 1, Figure 76: Original hot water demand in the EE scenario and the new hot water demand which is used in this study, along with the corresponding specific hot water demands (dotted lines). 6 0 Specific Hot Water Demand (---, kwh/m2) Space heating demand The space heating demand reductions calculated in the EE scenario seem very ambitious. For example, a quite ambitious scenario for energy efficiency measures presented in a recent report by EURIMA (European insulation Manufacturers Association) [Boermans, Bettgenhäuser et al., 2012], outlines that with deep renovations in the EU27, a space heating reduction of 47% or specific space heating demand (i.e. kwh/m 2 ) reduction of 62% will be possible between 2015 and In the assessed deep renovation scenario bad performing buildings achieve savings of around 75% while the energy demand for the total stock is reduced by the mentioned 47%. Reasons for this are that the deep renovation scenario also takes into account new buildings. By 2050 the building stock will increase by about one third. Additionally, the scenario considers that buildings have been partly renovated which limits the saving potential. Finally, the scenario takes also into account the limitations in renovation for some 16 The specific heat reduction (i.e. kwh/m 2 ) is greater than the absolute reduction (i.e. kwh) in space heating since the building area increases in combination with a decrease in the absolute heat demand. 169
171 buildings (e.g. some buildings will not be renovated due to cultural heritage, etc.). All these effects have an impact on the overall saving potential. It is important to note that one significant difference between the Deep Renovation scenario and the EE scenario is the heat demand in As outlined in Figure 77, this is approximately 2,560 TWh in the Deep Renovation scenario, but it is approximately 3,220 TWh in the EE scenario. Looking at actual historical data from the International Energy Agency (IEA) indicates that the total heat demand for both space heating and hot water in 2010 was approximately 3,500 TWh. Data from the EE scenario estimates that this includes approximately 800 TWh of hot water demand (see Figure 76), which suggests that the space heating demand is approximately 2,700 TWh. Although this means that the heat demand in the Deep Renovation scenario is more likely closer to the current situation in Europe than the EE scenario, the HRE2 heat demand created for this study uses the same starting point as the EE scenario. This is to make the results of this study comparable to the analysis in the EE scenario since the principal objective here is to compare a scenario with energy efficiency only to a scenario with both energy efficiency and district heating. The final space heating demand assumed in the new HRE2 scenario is outlined in Figure 77. 3,500 Deep Renovation (Ecofys) Energy Efficiency Scenario HRE2 Scenario 3,217 Space Heating Demand (TWh) 3,000 2,500 2,000 1,500 1, ,569 1, Figure 77: Space heating in the EE scenario from the Energy Roadmap 2050 [9], the Deep Renovation scenario form Ecofys [Boermans, Bettgenhäuser et al., 2012], and the new space heating demand assumed in this study. The final total heat demand for the new scenario assumed in this study is outlined in Figure 78: there is a total reduction of 34% between 2015 and 2050 in the HRE2 scenario instead of 61% as originally proposed in the EE scenario. 170
172 4,500 HRE2 Scenario Energy Efficiency Scenario Total Heat Demand (TWh/year) 4,000 3,500 3,000 2,500 2,000 1,500 1, Figure 78: Total heat demand for the new scenario assumed in this study and the EE scenario for Costs of the measures The cost of the energy efficiency measures in the EE scenario are estimated for three categories (costs for capital, energy purchases and for direct efficiency investments). We assume that a lot of the costs that refer to the measures of the EE scenario such as for example better appliances, new electric grids, the smart grid, and more renewable energy generation are counted for under capital costs. In consequence, the direct efficiency investments (B 295/year) would account for measures such as e.g. better insulation etc. The remaining question would then be where more efficient heating systems are accounted for. The deep renovation track scenario includes investment costs for windows, insulation and building equipment (heating systems, etc.). The annual average investment costs for the energy efficiency measures in the Deep Renovation scenario completed by Ecofys for EURIMA are approximately B 160/year, although as outlined in Figure 72 these vary over the 45-year period including a steep drop in the last few years. It is difficult to make a definite conclusion from the comparison of the two calculations since there are a lot of unknown assumptions behind the cost data in each report. We recommend to adjust the cost for the energy efficiency measures downwards from the B 295/year in the EE scenario, since there are now less energy efficiency measures in the HRE2 heat demand forecast. To do so, an energy efficiency cost curve, which is displayed in Figure 79, has been utilised. This cost curve was developed based on data from the Danish Research Building Institute [Kragh,Wittchen, 2010] and a Danish Heat Atlas [Möller, 2008; Sperling,Möller, 2012]. The costs reflect the additional cost of energy efficiency measures, which means that they are implemented at the same 171
173 time as other renovations are taking place in the building. Assuming a 3% interest rate and an average lifetime of 30 years for the energy efficiency measures, indicative annual costs of implementing energy efficiency measures in the EU27 have been estimated in Figure 80. These are indicative only since they reflect total energy savings and not the reduction in specific heat demand. However, these results demonstrate how the unit cost of energy savings increases as more savings are implemented. For example, the first B 200/year on energy savings in Europe will achieve savings of approximately 53%, while investments of B 400/year will only 22% more at 75%. Additional Cost ( /kwh/year) % 10% 20% 30% 40% 50% 60% 70% 80% Heat Demand Reduction (%) Figure 79: Additional costs for energy efficiency measures that reduce the heat demand by different percentages based on Danish buildings [Kragh,Wittchen, 2010]. As displayed in Figure 69, there is a total reduction of approximately 70% in the specific heat demand in the EE scenario, equating to total savings of 2,460 TWh. Assuming a cost of 2.4/kWh (18 DKK/kWh) based on the data in Figure 79, a 3% interest rate, and an average lifetime of 30 years for the energy efficiency measures, the annual costs of implementing the energy efficiency measures in the EE scenario are calculated as approximately B 303/year. This is very similar to the costs suggested in the EU Energy Roadmap report of B 295/year, although as mentioned previously the B 295/year may include savings in other sectors such as electricity and transport. 172
174 Annual Additional Costs of Energy Savings in the EU27 (B /year) % 10% 20% 30% 40% 50% 60% 70% 80% Total Energy Savings (%) Figure 80: Annual additional costs for energy efficiency measures that reduce the heat demand by different percentages based on Danish buildings [Kragh,Wittchen, 2010], an interest rate of 3%, and assuming an average lifetime of 30 years. These are indicative only as they not consider the change in specific heat demand, but instead it considers the change in total heat demand. Using the same assumptions, the costs for the energy efficiency measures in the new HRE2 heat demand scenario can also be estimated. In the HRE2 scenario, there is a 51% reduction in the specific heat demand between 2015 and 2050, equating to a total energy saving of 1,215 TWh. Assuming a cost of 1.9/kWh (14 DKK/kWh), this means that the total annual costs for energy efficiency measures in this scenario are approximately B 133/year. Comparing this to the annual investment costs estimated by Ecofys in the EURIMA report [Boermans, Bettgenhäuser et al., 2012] suggests that this is a 17% underestimation of the total energy efficiency costs required. As displayed earlier in Figure 72, the average annual investments required in the Deep Renovation scenario (for a 47% reduction in space heating) are approximately B 160/year. This difference warrants further investigation in the future, but based on these comparisons, the indicate costs provided by the unit costs in Figure 79 are deemed an adequate representation of the variation in costs as more energy efficiency measures are implemented. Overall, the EE scenario is extremely ambitious in terms of energy efficiency. Hence, a new HRE2 heat demand has been created for this study, which is also very ambitious in terms of energy efficiency since it follows the space heating recommendations of the Deep Renovation scenario created for EURIMA [Boermans, Bettgenhäuser et al., 2012]. This new HRE2 heat demand will be used to investigate the feasibility of district heating in a scenario with very low heat demands. 173
175 11.3 REFERENCES European Commission (2011). Energy Roadmap Baukosteninformationszentrum Deutscher Architektenkammern (BKI) (2011). Kostenplaner 14 und BKI Baukostendantebank 2011/ Software zur sicheren Baukostenermittlung. BKI GmbH Stuttgart BMVBS (Hrsg.) (2012). Kosten energierelevanter Bau- und Anlagenteile bei der energetischen Modernisierung von Wohngebäuden. BMVBS-Online-Publikation 07/2012. Verfügbar: < nline/2012/on html> (Letzter Zugriff: ). Bundesministerium für Verkehr, Bau und Stadtentwicklung (BMVBS), Berlin, EURIMA (2012). Renovation Tracks for Europe up to Building Renovation in Europe - What are the Choices? Verfügbar: < 0_2012_web_Final.pdf> (Letzter Zugriff: ). Brussels, Belgium. European Commission (2011a). Impact assessment - Accompanying document to the Communication from the Commission to the European Parliament, the Council, the European Economic and Social Committee and the Committee of the Regions: Energy Roadmap 2050; Part 1/2. Verfügbar: < (Letzter Zugriff: ). European Commission (2011b). Impact assessment - Accompanying document to the Communication from the Commission to the European Parliament, the Council, the European Economic and Social Committee and the Committee of the Regions: Energy Roadmap 2050; Part 2/2. Verfügbar: < (Letzter Zugriff: ). Möller, B. (2008). A heat atlas for demand and supply management in Denmark. Management of Environmental Quality 19(4): Sperling, K.,Möller, B. (2012). End-use energy savings and district heating expansion in a local renewable energy system A short-term perspective. Applied Energy 92(0):
176 12 ANNEX IV: LOCAL CONDITIONS ILLUSTRATED BY MAPS 12.1 MAJOR COMBUSTION INSTALLATIONS FOR POWER AND HEAT GENERATION Figure 81: Major combustion installations above 50 MW for power and heat generation in Europe. Source: The E-PRTR database at EEA in Copenhagen. 175
177 12.2 WASTE-TO-ENERGY Figure 82: Locations of 410 waste incineration plants in Europe. Sources: CEWEP, E-PRTR, ISWA, and some national sources for Sweden, Denmark, and France. 176
178 12.3 INDUSTRIAL EXCESS HEAT Figure 83: Locations of major energy intensive industries with considerable volumes of excess heat. Source: The E-PRTR database at EEA in Copenhagen. 177
179 12.4 GEOTHERMAL HEAT Figure 84: Identified geothermal heat resources by temperature at 2000 m depth by NUTS3 region. Source: European Commission, Atlas of Geothermal Resources in Europe. Publication EUR 17811, Luxembourg
180 12.5 BIOMASS Figure 85: A qualitative map of local biomass availability based on a weighted overlay using forestry and agricultural statistics, forest density and land use for agriculture. Source: European Forest Institute. 179
181 12.6 SOLAR THERMAL HEAT Figure 86: Annual solar irradiation on a south-oriented tilted surface at optimal angle by NUTS3 region. 180
182 12.7 NUTS3 REGION HOT SPOTS FULL LIST NUTS3 region NUTS3 region Name Country Code Population [Mn] Land area [km 2 ] Population density [n/km 2 ] Heat demand [PJ] Excess heat [PJ] Excess heat ratio [-] AT312 Linz-Wels AT AT315 Traunviertel AT BE211 Arr. Antwerpen BE BE221 Arr. Hasselt BE BE234 Arr. Gent BE BE236 Arr. Sint-Niklaas BE BE251 Arr. Brugge BE BE254 Arr. Kortrijk BE BE322 Arr. Charleroi BE BE323 Arr. Mons BE BE332 Arr. Liège BE CZ042 Ústecký kraj CZ CZ080 Moravskoslezský kraj CZ DE122 Karlsruhe, Stadtkreis DE DE126 Mannheim, Stadtkreis DE DE211 Ingolstadt, Kreisfreie Stadt DE DE219 Eichstätt DE DE21J Pfaffenhofen an der Ilm DE DE712 Frankfurt am Main, Kreisfreie DE DE929 Region Hannover DE DEA11 Düsseldorf, Kreisfreie Stadt DE DEA12 Duisburg, Kreisfreie Stadt DE DEA13 Essen, Kreisfreie Stadt DE DEA14 Krefeld, Kreisfreie Stadt DE DEA17 Oberhausen, Kreisfreie Stadt DE DEA19 Solingen, Kreisfreie Stadt DE DEA1A Wuppertal, Kreisfreie Stadt DE DEA1C Mettmann DE DEA1D Rhein-Kreis Neuss DE DEA1F Wesel DE DEA23 Köln, Kreisfreie Stadt DE DEA24 Leverkusen, Kreisfreie Stadt DE DEA27 Rhein-Erft-Kreis DE DEA31 Bottrop, Kreisfreie Stadt DE DEA32 Gelsenkirchen, Kreisfreie Stadt DE DEA36 Recklinghausen DE DEA46 Minden-Lübbecke DE DEA51 Bochum, Kreisfreie Stadt DE DEA54 Hamm, Kreisfreie Stadt DE DEA55 Herne, Kreisfreie Stadt DE DEA5C Unna DE DEB34 Ludwigshafen am Rhein, DE FR232 Seine-Maritime FR FR301 Nord (FR) FR FR302 Pas-de-Calais FR FR411 Meurthe-et-Moselle FR FR511 Loire-Atlantique FR FR824 Bouches-du-Rhône FR Italy, Poland, and United Kingdom continue on next page. 181
183 NUTS3 region NUTS3 region Name Country Code Population [Mn] Land area Population density Heat demand Excess heat Excess heat ratio [-] ITC11 Torino IT 2.29 [km 2 ] 6830 [n/km 2 ] 341 [PJ] 49.1 [PJ] ITC15 Novara IT ITC16 Cuneo IT ITC41 Varese IT ITC45 Milano IT ITC46 Bergamo IT ITC48 Pavia IT ITD31 Verona IT ITD36 Padova IT PL227 Rybnicki PL PL22A Katowicki PL PL22B Sosnowiecki PL PL522 Opolski PL UKC11 Hartlepool and Stockton-on- UK UKC12 South Teesside UK UKD21 Halton and Warrington UK UKD22 Cheshire CC UK UKE13 North and North East UK UKL21 Monmouthshire and Newport UK UKL22 Cardiff and Vale of Glamorgan UK Total
![13 ANNEX V: THE PRIMES MODELLING TOOL Title: PRIMES model Description from: Organization: [53, 54] National Technical University of Athens, Department of Outlook year: Electrical and Computer](/docs-images/92/110421724/images/184-0.jpg "Engineering (E3MLab) n/a Objective: Used for the 2010 scenarios for the European Commission. Overview: PRIMES simulates a market equilibrium solution for energy supply and demand [55].")
184 13 ANNEX V: THE PRIMES MODELLING TOOL Title: PRIMES model Description from: Organization: [53, 54] National Technical University of Athens, Department of Outlook year: Electrical and Computer Engineering (E3MLab) n/a Objective: Used for the 2010 scenarios for the European Commission. Overview: PRIMES simulates a market equilibrium solution for energy supply and demand [55]. It has been developed by the National Technical University of Athens (NTUA) since 1994, but it is not sold to third parties. Instead, the tool is used within consultancy projects undertaken by NTUA and partners. The equilibrium used in PRIMES is static (within each time period) but repeated in a time-forward path, under dynamic relationships. In the Energy Roadmap 2050 project, PRIMES was used to model the period , in time steps of 5 years. For the years 1990, 1995, 2000 and 2005 the model results are calibrated to Eurostat statistics. For the year 2010, the model results are semi-calibrated by taking into account the latest statistics and short-term expectations. All thermal, renewable, storage/conversion, and transport technologies can be simulated except battery energy storage, compressed-air energy storage, intelligent battery-electric-vehicles, and hybrid vehicles. PRIMES is organized in sub-tools, each one representing the behaviour of a specific demander and/or a supplier of energy. PRIMES simulates time-of-use varying load for network-supplied energy carriers to synchronize electricity, gas and steam/heat in all sectors of demand, supply and trading. To do this, load curves are computed by the model in a bottom up manner depending on the load profiles of individual uses of energy. The tool can support policy analysis in the following fields: (1) standard energy policy issues: security of supply, strategy, costs (includes all costs), etc., (2) environmental issues, (3) pricing policy and taxation, standards on technologies, (4) new technologies and renewable sources, (5) energy efficiency in the demand-side, (6) alternative fuels, (7) conversion to decentralisation and electricity-market liberalisation, (8) policy issues regarding electricity generation, gas distribution, and new energy forms. PRIMES is organised by an energy production sub-system for supply consisting of oil products, natural gas, coal, electricity and heat production, biomass supply, and others, and by end-use sectors for demand consisting of residential, commercial, transport, and nine industrial sectors. Some demanders may also be suppliers, as for example industrial cogenerators of electricity and steam. PRIMES has previously been used to create energy outlooks for the EU [56], develop a climate change action and renewable energy policy package for the EU [57] and also, to analyse a number of different policies to reduce GHG in the EU25 by 2030 [58, 59]. Finally, PRIMES has been used for several EU governments as well as private companies. How district heating is mentioned: The optimisation is simultaneous for power, CHP, distributed steam, distributed heat, district heating and industrial boilers. The optimisation is inter-temporal (perfect foresight) and solves simultaneously a unit commitment-dispatching problem; a capacity expansion problem; and a DC-linearized optimum power flow 183
185 problem (over interconnectors). Promotion of CHP and micro-generation: priority grid access for CHP, CHP values representing marginal benefits for CHP can be introduced. Micro-generation is included only in the low voltage grid, reducing the transmission costs. The use of biomass is optimally allocated endogenously and might therefore not be used for CHP. Link to reports:
186 14 ANNEX VI: CHARACTERISTICS OF A SUITABLE ENERGY SYSTEMS ANALYSIS In 2009 the European Council made the objective for the EU to decarbonisation its energy system to at least 80% below the 1990 level by 2050, without affecting general economic growth. One can imagine that there are a number of measures and technologies that could contribute to such a goal. The question is with which scenarios one could achieve these goals? We believe that any scenario developed for this objective should include the following two key elements: A. An energy system in 2050 with 80% lower CO 2 -emissions than 1990 will require radical technological changes, for both energy consumption and production compared to the energy system in the EU today. B. This CO 2 reduction should be achieved with the lowest socio-economic costs. Initially one should ask, which analysis and scenarios one wants to conduct? In Heat Road Map Europe 2, the aim is to analyse feasible and sustainable pathways to make energy efficient buildings and supply them with heat in the future as part of the overall target of the European Council. Also the scenarios conducted represent radical technological change compared to today, as the system changes from a predominately centralised system to a system with much more distributed and fluctuating energy sources. To conduct such analyses a number of key principles for choosing the tool used in the analyses have been considered, which EnergyPLAN is able to meet [60]. The tool should: 1. Include integrated analyses of the electricity and heat sector, in order to be able to identify synergies between these sectors and preferably also include other sectors such as transport. 2. Use hour-by-hour simulations in order to take into account that the increasing amounts of fluctuating renewable energy in the European energy system changing from the current centralised energy system. 3. Be able to include changes in the energy demand hour-by-hour when implementing heat demand savings, since savings will reduce peak demands significantly. 4. Be able to identify energy systems with low socio-economic costs by implementing different technological alternatives. Key principles 1-3 relate to the radical technological change principal in point A above. Key principle 4 relates to point B, which is to complete the analysis from a socio-economic perspective: this ensures that the cost burden on European citizens and businesses is comparably lower, which enables stronger economic development in the EU. In Connolly et al. [54], a review of the different computer tools that can be used to analyse the integration of renewable energy was conducted. The paper provides the information necessary to direct the decision-maker towards a suitable energy tool for an analysis that must be completed. 68 tools were initially considered, but 37 were included in the final analysis which was carried out in collaboration with the tool developers or recommended points of contact. The typical applications for the tools reviewed ranges from analysing single-building systems to analysing national or international energy systems. Table 41 lists the tools that are included in the review along with a brief overview of how the models are defined. The different categories of tools are described in the paper as follows: 185
187 A simulation tool simulates the operation of a given energy-system to supply a given set of energy demands. Typically a simulation tool is operated in hourly time-steps over a one-year time-period. A scenario tool usually combines a series of years into a long-term scenario. Typically scenario tools function in time-steps of 1 year and combine such annual results into a scenario of typically years. An equilibrium tool seeks to explain the behaviour of supply, demand, and prices in a whole economy or part of an economy (general or partial) with several or many markets. It is often assumed that agents are price takers and that equilibrium can be identified. A top-down tool is a macroeconomic tool using general macroeconomic data to determine growth in energy prices and demands. Typically top-down tools are also equilibrium tools (see 3). A bottom-up tool identifies and analyses the specific energy technologies and thereby identifies investment options and alternatives. Operation optimisation tools optimise the operation of a given energy-system. Typically operation optimisation tools are also simulation tools (see 1) optimising the operation of a given system. Investment optimisation tools optimise the investments in an energy-system. Typically optimisation tools are also scenario tools (see 2) optimising investments in new energy stations and technologies. 186
188 Tool Table 41: List and type of each tool reviewed in [54]. Type Simulation Scenario Equilibrium Top-Down Bottom-Up Operation Optimisation Investment Optimisation AEOLIUS Yes Yes - - BALMOREL Yes Yes Partial - Yes Yes Yes BCHP Screening Tool Yes Yes Yes - COMPOSE Yes Yes Yes E4cast - Yes Yes - Yes - Yes EMCAS Yes Yes - - Yes - Yes EMINENT - Yes - - Yes - - EMPS Yes - EnergyPLAN Yes Yes - - Yes Yes Yes energypro Yes Yes Yes Yes ENPEP-BALANCE - Yes Yes Yes GTMax Yes Yes - H2RES Yes Yes - - Yes Yes - HOMER Yes Yes Yes Yes HYDROGEMS - Yes IKARUS - Yes - - Yes - Yes INFORSE - Yes Invert Yes Yes - - Yes - Yes LEAP Yes Yes - Yes Yes - - MARKAL/TIMES - Yes Yes Partly Yes - Yes Mesap PlaNet - Yes - - Yes - - MESSAGE - Yes Partial - Yes Yes Yes MiniCAM Yes Yes Partial Yes Yes - - NEMS - Yes Yes ORCED Yes Yes Yes - Yes Yes Yes PERSEUS - Yes Yes - Yes - Yes PRIMES - - Yes ProdRisk Yes Yes Yes RAMSES Yes Yes Yes - RETScreen - Yes - - Yes - Yes SimREN SIVAEL STREAM Yes TRNSYS16 Yes Yes - - Yes Yes Yes UniSyD3.0 - Yes Yes - Yes - - WASP Yes Yes WILMAR Planning Tool Yes Yes - From the methodology in the review paper a number of advantages can be identified using the EnergyPLAN tool compared to the other tools reviewed: It is a simulation and scenario tool that simulates the operation of a given energy system to supply a given set of energy demands. Conducts analyses in hourly time-steps over a one-year time-period. Uses bottom-up inputs for specific energy technologies and can identify investment options and alternatives. Can use different regulation strategies in order to optimise the operation of a given energy system. Can optimise investments in new energy technologies on the consumption and production side. Includes all sectors (electricity, heat, transport and gas). 187
189 Has been used to conduct many energy system analysis of large-scale integration of renewable energy sources as well as energy savings, including case-studies of 100% renewable energy systems. The tool conducts either technical energy system analyses that seeks to make efficiency improvements in the energy conversion to reduce the primary energy supply. The tool conducts market economic system optimisation showing the socio-economic results regarding cost for the society analysed. The tool is open source, transparent, free of costs and all analyses and documentation is available online for previous analyses. When analysing energy systems such as in this reports, EnergyPLAN, and other tools that have these properties, can avoid a lock-in to the existing technologies and markets. General equilibrium tools typically include current market conditions and current technologies that can make it difficult to identify new technological regimes and energy system designs. Such tools seek to explain the behaviour of supply, demand, and prices in the entire economy or part of an economy (general or partial) with several or many markets. It is often assumed that agents are price takers and that equilibrium can be identified. Having such agents included in the tool means that different current market designs are included and hence part of the analyses when looking at new scenarios. Such a methodology however can make it difficult to get the tool to identify and analyse new combinations of technologies or new uses of known technologies. In addition, general equilibrium tools as well as topdown tools (which use general macroeconomic data to determine growth in energy prices and demands) can make it hard to identify the lowest socio-economic costs of energy systems due to the fact that such approaches assume current market conditions and profit of agents (sometimes also assuming perfect market structures). 188
190 15 ANNEX VII: KEY ASSUMPTIONS WHEN MODELLING THE ENERGY EFFICIENCY SCENARIO While transferring the original EU Energy Efficiency (EU-EE) scenario statistics from the Energy Roadmap 2050 report [9] into the EnergyPLAN tool, a number of issues were identified. Below is an overview of these issues along with the assumptions made to overcome them. In the majority of cases, these issues simply reflect a misunderstanding in relation to, or a lack of information about, the original EU-EE scenario HOT WATER DEMAND IS REDUCED BY 50% BETWEEN 2015 AND 2050 This is discussed in section 5.1 of the main report MISMATCH IN THE TOTAL CO 2 EMISSIONS The gross inland consumption from the Energy Efficiency scenario for 2010, 2030, and 2050 is outlined in the table below: Table 42: Gross inland consumption for the Energy Efficiency scenario from the original statistics [9]. Unit Energy Efficiency Scenario TWh PES / Gross Inland Consumption 20,391 16,883 12,610 Solids 3,269 1, Oil 7,385 5,764 1,948 Gas 5,150 4,041 2,986 Nuclear 2,733 1,878 1,700 Electricity Renewable Energy 1,844 3,692 5,491 Some of this energy is not burned, but instead it is used for non-energy use purposes such as fertiliser production, plastics and road cover material. The total amount of energy utilised for non-energy purposes is available from the EU Energy Roadmap [12]: this is 1300 TWh (112 Mtoe) in 2010, 1400 TWh (121 Mtoe) in 2030, and 1140 TWh (98 Mtoe) in However, it is not possible to determine from the data available what type of fuel this is. Therefore, it is assumed that all of this is oil in 2010, 10% of this is gas and 90% is oil in 2030, while 50% is gas and 50% is oil in Originally, it was assumed to be all oil in all years, but with this assumption the total oil in the gross inland consumption would then be exceeded in Hence, a 50% split with gas is assumed in 2050 and 10% in This non-energy use consumption is then subtracted from the gross inland consumption to estimate the CO 2 emissions for the EU Energy Efficiency (EU-EE) scenario. The following CO 2 emission factors are assumed in line with those reported by the European Topic Centre on Air and Climate Change [61]: coal 95 kg/gj; oil 73 kg/gj; and gas 56 kg/gj. Nuclear, biomass, waste, and renewable energy are assumed to have no carbon dioxide emissions. Using these emission factors, the total CO 2 emissions are 3755 Mt in 2010, 2492 Mt in 2030, and 1026 Mt in 2050 (see Table 189
191 43). Using this methodology, the CO 2 emissions have been estimated accurately for 2030 and 2050, but there is a 7% error for the year This has been compensated for in this study by assuming that CCS captures less CO 2 than in the original Energy Efficiency scenario. Since it is assumed that CCS captures the same amount of CO 2 in all scenarios for each of the years, this will have very little impact on the results when comparing the EU-EE scenario with the HRE-EE scenario. Table 43: Carbon dioxide emissions for the Energy Efficiency scenario [9]. Unit Energy Efficiency Scenario Mt Final CO 2 Emissions from the Energy Efficiency (Ref Approach) 3,757 2, CO 2 Captured by CCS in the Energy Efficiency Scenario Total CO 2 in the Energy Efficiency Scenario 3,757 2,502 1,105 Total CO 2 Estimated Here for the EU-EE scenario 3,755 2,492 1,026 Difference Difference (%) 0% 0% 7% 15.3 ASSUMPTIONS FOR THE HOURLY BALANCING ARE AMBITIOUS As outlined in Figure 87, the EU-EE scenario has more electricity from intermittent renewable energy (+15%) and CCS (+13%) than the CPI scenario, while at the same time there is less electricity from nuclear (-7%) and CHP (-7%). Nuclear and CCS are typically operated as baseload technologies which means there is a net difference of ~6% in baseload electricity production between the EU-EE and the EU-CPI scenarios. Overall, this means that more intermittency has been added to the EU-EE scenario, more baseload has been added, and a flexible technology in the form of CHP has been reduced. However, the statistics also report that the annual trade of electricity is the same in both the CPI and EU-EE scenarios at a net export of TWh. According to [12], Electricity balancing and reliability is ensured endogenously by various means such as import and export flows (in case of high RES it is facilitated by expanding interconnections), investment in flexible thermal units, pumped storage and if required hydrogen based storage. Therefore, it may be possible to have the same net export of electricity in the EU-EE and EU-CPI scenarios, but it likely to be extremely expensive considering the additional technologies in the EU-EE scenario. 190
192 Percentage (%) Efficiency for thermal electricity production (%) 15 EE 2010 CPI 2050 EE CHP indicator (% of electricity from CHP) CCS indicator (% of electricity from CCS) nuclear in electricity generation (%) renewable energy in electricity generation (%) Figure 87: Indicators for gross electricity production in the EU-CPI scenario from the first pre-study [1] and the EU-EE scenario used in this study. This problem is also evident in the results from the EnergyPLAN tool when modelling the EU-EE scenario. As outlined in the results for 2050 in Annex VIII, there is 100 TWh of net exports in the EU-EE scenario instead of the 31 TWh reported in the original statistics. This is due to imbalances between the hourly demand and supply of electricity. This indicates that the original statistics may not consider some of the issues that occur on an hourly level in the energy system, which can be essential for outlining the importance of district heating especially in relation to renewable energy. In this study, the annual export of electricity has been reduced by assuming that the CCS plants can operate in a flexible manner MISMATCH IN THE BIOMASS/WASTE STATISTICS It is not possible to match the biomass statistics in the gross inland consumption figures with the breakdown of biomass from the Energy Roadmap 2050 report. For example, Table 44 outlines the breakdown of biomass/waste based on bottom-up statistics, while Table 45 represents an estimate of the biomass/waste consumption based on a top-down approach using the gross inland consumption. According to Table 44, there is a biomass/waste consumption of 2,995 TWh in 2050, but according to Table 45 it is 2,809 TWh. It is assumed here that the bottom-up approach in Table 44 is correct, but by doing so it is not possible to match the gross inland consumption statistics for biomass/waste, which can be seen Annex VIII. This error is either a reporting error or a misinterpretation of some statistics from the Energy Roadmap 2050 report. Therefore, it is not due to the EnergyPLAN model, but due to an error in the inputs. Overall, the difference is only approximately 5% of the biomass/waste consumed so it will not have a significant impact on the results. 191
193 Fuel (TWh) Table 44: Breakdown of fuel consumption in 2050 for the EU-EE scenario Total Final Consumption incl. Industry CHP Elec & Heat Production Boilers Total Consumption Solids Oil 1, Natural Gas 1, Biomass/Waste 1, Table 45: Gross inland consumption for renewable energy in the Energy Efficiency scenario Year Total for Renewable Energy 1,844 3,692 5,491 Hydro Wind ,423 PV, tidal, etc Geothermal for PP Geothermal for Buildings Solar for Buildings Total IRES 612 1,799 2,682 Total Remaining for Biomass/Waste 1,232 1,893 2, BIOMASS AND WASTE ARE RECORDED TOGETHER IN THE STATISTICS Biomass and waste are recorded as one entity in the Energy Efficiency scenario statistics. This is not a major concern for the current energy system, but in the 2050 EU-EE scenario biomass/waste accounts for almost 25% of all energy (see Table 44 and Table 42). Therefore, it becomes important to know how much is waste and how much is biomass separately. According to the latest EU27 energy balance from the International Energy Agency, 182 TWh of waste was used in In this study, it is assumed that waste does not increase significantly between now and 2050 since district heating does not increase significantly in the EU-EE scenario. Therefore, it is assumed that there is approximately 200 TWh of waste in 200 TWh of waste in 2030 and 230 TWh of waste in 2050 in the EU-EE scenario ELECTRICITY LOSSES ARE VERY HIGH IN 2050 It is assumed that any difference between total electricity production and total electricity consumption in the statistics is caused by electricity losses. As outlined in Table 46, this means that 25% of all electricity produced is lost. This seems too high, but it is assumed here that in addition to transmission and distribution losses, the additional electricity required to CCS is also included here which explains the relatively high figure. 192
194 Table 46: Electricity consumption and production in the Energy Efficiency scenario. Unit Energy Efficiency Scenario TWh Electricity Consumption (TWh) 2,818 3,003 3,204 Electricity Losses (TWh) ,077 Electricity Losses (% of consumption) 18% 15% 34% Electricity Losses (% of production) 15% 13% 25% Total Electricity Production 3,319 3,444 4, FUEL CONSUMPTION IN POWER PLANTS IS REPORTED BY TYPE RATHER THAN BY MODE The Energy Efficiency scenario statistics report the total fuel consumed for power plants and CHP plants separately. However, the fuel consumed by a CHP plant could occur while the CHP plant is in condensing mode i.e. producing electricity only. As a result, it is not possible to determine from the statistics how much fuel is required while plants operate in back-pressure mode separately to the fuel required while plants operate in condensing mode. This is important to determine the amount of fuel consumed by CHP plants for district heating. To verify that the statistics make sense, the average heat efficiency of CHP plants is estimated based on the total fuel consumed and the total heat produced by CHP plants. For 2030 the average heat efficiency for CHP is 46% and in 2050 it is 44%. These are realistic values and so no changes were necessary DISTRICT HEATING HAD TO DIVIDED BETWEEN INDUSTRY AND BUILDINGS (I.E. RESIDENTIAL AND SERVICES) The focus in this study is on the role of district heating for buildings for the residential and services sectors. However, statistics relating to district heating, CHP capacities, and boilers in the Energy Efficiency scenario statistics do not distinguish between these two forms. Therefore, to extract the statistics for the residential and services sectors separately, all of these statistics were divided based on the percentage of the total district heating demand required for the residential and services sectors. As outlined in Table 47, 25% of the district heating demand is for the residential and services sectors in 2030, while it is 17% in This means that the majority of district heating in the Energy Efficiency scenario is for the industrial sector in 2030 and
195 Table 47: Heat consumption by sector in the Energy Efficiency scenario. Unit Energy Efficiency Scenario TWh Industry Households Tertiary Energy branch Residential and Services (% of industry and energy branch) 45% 25% 17% 15.9 ELECTRICITY FOR HEATING IS NOT DIVIDED FOR DIRECT ELECTRIC HEATING AND HEAT PUMPS To estimate the heat demand for individual units, the total fuel consumed is identified and then the heat demand is estimated based on average boiler efficiencies. In this study, the average boiler efficiencies in Table 48 have been used based on recommendations by Ecofys in Annex III. Table 48: Average boiler efficiencies assumed in the Energy Efficiency scenario. Boiler Solids 70% 70% 70% Oil. 88% 88% 88% Gas 89% 89% 89% Biomass 75% 75% 75% Solar 100% 100% 100% Direct Electricity 100% 100% 100% Geothermal 100% 100% 100% Heat Pumps 275% 275% 275% For electricity this methodology could not be used directly as electricity consumption for heating purposes is not divided between direct electricity and heat pumps. To divide these, the total heat demand in the years 2030 and 2050 was aligned with the statistics by adjusting the proportion of electricity used in direct electric heating and in heat pumps. For 2030, 40% of heat demand from electricity is provided by direct electric heating and 60% is provided by heat pumps. In 2050, this is 25% by direct electric heating and 75% from heat pumps. With these assumptions the total heat demand assumed here is the same as that reported in the statistics. 194
196 16 ANNEX VIII: DATA INPUT FOR MODELLING THE ENERGY EFFICIENCY SCENARIO The tables in this annex summarises some of the key used when transferring the original Energy Efficiency scenario into the EnergyPLAN tool. For each piece of data, a value is provided from the original statistics, a value outlining how this was interpreted to create the reference, and finally the resulting value from the final EnergyPLAN model created. 195
197 Unit Year 2010 Energy Efficiency Scenario TWh Data Statistics Reference EnergyPLAN Electricity 2,818 Plus Additional Losses 502 3,319 3,319 Including Electric Heating Including Electric Cooling District Heating for Residential & Services Plus Additional Losses District Heating for Industry Plus Additional Losses Total District Heating Consumption Total District Heating Production Power Plants (excl. Waste & Nuclear) 3,137 Power Plants Operating in Condensing Mode - 3,447 3,433 CHP Extraction Plants (excl. Waste & Nuclear) 762 Fuel Consumed in Back Pressure CHP Mode Centralised Peak Boilers (excl. Waste) Centralised Heat-Only Boilers (excl. Waste) Nuclear Power Plants 2,733 2,733 2,733 Demands Fuel for Electricity & District Heating for Residential & Services Final Energy Consumption (excluding electricity & district heating) Total Fuel (excluding fuel for nonenergy use) CCO 2 (Mt) Hydroelectricity Intermittent RE: Wind, Solar PV, Wave, Tidal Fuel Refinery Losses & Energy Industry Own Use* * 657 Industry 2,158 Industry CHP & Boilers 889 3,126 3,782 Agriculture / Fishing (excluding oil) 80 Residential 2,503 Services 861 3,365 3,365 Transport 4,487 4,487 Jet Fuel Petrol 1,215 1,215 1,215 Diesel 2,193 Agricultural Oil Consumption 184 2,377 2,377 Gas LPG Electricity Biofuels Coal 3,269 3,269 3,262 Oil 6,083 6,083 6,078 Gas 5,150 5,150 5,135 Biomass/Waste 1,306 # 1,305 1,844 Renewables Nuclear 2,733 2,733 2,733 Total 19,080 19,153 19,126 Energy System 3,757 3,755 3,749 Assuming CO 2 Captured by CCS *Based on the difference between final energy consumption and gross inland consumption minus fuel for non-energy use in the EU-EE statistics. # Assuming that biofuels are counted in the primary energy supply and not the biomass required when creating those biofuels. See Annex VII for an explanation of the difference between the statistics and the reference. 196
198 Unit Year 2030 Energy Efficiency Scenario TWh Data Statistics Reference EnergyPLAN Electricity 3,003 Plus Additional Losses 442 3,444 3,444 Including Electric Heating Including Electric Cooling District Heating for Residential & Services Plus Additional Losses District Heating for Industry Plus Additional Losses Total District Heating Consumption ,203 Total District Heating Production 1,118 1,118 1,118 Power Plants (excl. Waste & Nuclear) 1,238 Power Plants Operating in Condensing Mode - 1,238 1,201 CHP Extraction Plants (excl. Waste & Nuclear) 501 Fuel Consumed in Back Pressure CHP Mode Centralised Peak Boilers (excl. Waste) Centralised Heat-Only Boilers (excl. Waste) Nuclear Power Plants 1,878 1,878 1,879 Demands Fuel for Electricity & District Heating for Residential & Services Fuel for Electricity Imbalance Final Energy Consumption (excluding electricity & district heating) Total Fuel (excluding fuel for non-energy use) CCO 2 (Mt) Hydroelectricity Intermittent RE: Wind, Solar PV, Wave, Tidal 1,100 1,100 1,100 Annual Balance of Electricity (CEEP) Pumped Hydroelectric Energy Storage (PHES) Losses Additional Fuel for Power Plants due to CEEP & PHES Losses Extra Fuel for Power Plants in EnergyPLAN compared the Reference -108 Fuel Refinery Losses & Energy Industry Own Use* * 519 Industry 1,904 Industry CHP & Boilers 1,663 3,621 4,137 Agriculture / Fishing (excluding oil) 54 Residential 1,743 Services 575 2,318 2,318 Transport 4,026 4,026 Jet Fuel Petrol Diesel 1,701 Agricultural Oil Consumption 115 1,816 1,816 Gas LPG Electricity Biofuels Coal 1,531 1,531 1,487 Oil 4,498 4,498 4,498 Gas 3,901 3,901 3,905 Biomass/Waste 1,919 # 1,851 3,692 Renewables 1,799 1,799 Nuclear 1,878 1,878 1,879 Total 15,500 15,527 15,419 Energy System 2,485 2,485 2,462 Assuming CO 2 Captured by CCS *Based on the difference between final energy consumption and gross inland consumption minus fuel for non-energy use in the EU-EE statistics. # Assuming that biofuels are counted in the primary energy supply and not the biomass required when creating those biofuels. See Annex VII for an explanation of the difference between the statistics and the reference. 197
199 Unit Year 2050 Energy Efficiency Scenario TWh Data Statistics Reference EnergyPLAN Electricity 3,204 Plus Additional Losses 1,077 4,281 4,281 Including Electric Heating Including Electric Cooling District Heating for Residential & Services Plus Additional Losses District Heating for Industry Plus Additional Losses Total District Heating Consumption Total District Heating Production Power Plants (excl. Waste, Geothermal & Nuclear) Fuel Assumed for Power Plants Operating in Condensing Mode ,076 CHP Extraction Plants (excl. Waste, Geothermal, & Nuclear) Fuel Assumed for CHP Operating in Back Pressure Mode Centralised Peak Boilers (excl. Waste) Centralised Heat-Only Boilers (excl. Waste) Nuclear Power Plants 1,700 1,700 1,700 Demands Fuel for Electricity & District Heating for Residential & Services Fuel for Electricity Imbalance Final Energy Consumption (excluding electricity & district heating) Total Fuel (excluding fuel for non-energy use) CCO 2 (Mt) Hydroelectricity Intermittent RE: Wind, Solar PV, Wave, Tidal 1,875 1,875 1,875 Annual Balance of Electricity (CEEP) Pumped Hydroelectric Energy Storage (PHES) Losses Additional Fuel for Power Plants due to CEEP & PHES Losses Extra Fuel for Power Plants in EnergyPLAN compared the Reference 129 Fuel Refinery Losses & Energy Industry Own Use* * 166 Industry 1,208 Onsite and Offsite CHP & Boilers for Industrial Heat 1,796 3,068 3,226 Agriculture / Fishing (excluding oil) 64 Residential 790 Services 278 1,069 1,069 Transport 2,679 2,679 2,678 Jet Fuel Petrol Diesel 545 Agricultural Oil Consumption Gas 0 0 LPG Electricity Biofuels Coal Oil 1,378 1,378 1,378 Gas 2,416 2,425 2,535 Biomass/Waste 2,995 # 3,001 5,491 Renewables 2,682 2,682 Nuclear 1,700 1,700 1,700 Total 11,501 11,696 11,816 Energy System Assuming CO 2 Captured by CCS ^ *Based on the difference between final energy consumption and gross inland consumption minus fuel for non-energy use in the EU-EE statistics.; # Assuming that biofuels are counted in the primary energy supply and not the biomass required when creating those biofuels. See Annex VII for an explanation of the difference between the statistics and the reference.; ^The differences in the total CO 2 emissions have een compensated for by assuming less CO 2 is captured by CCS plants (see Annex VII). This does not affect the results since the same amount of CO 2 is captured by CCS in all scenarios. 198
200 17 ANNEX IX: KEY COSTS ASSUMED FOR THE ENERGY SYSTEM ANALYSES Table 49: Key financial inputs assumed for electricity and heat production plants [45, 47, 62-67]. Production Type Unit Investment (M /unit) Lifetime (Years) Fixed O&M (% of Investment) Solar Thermal TWh/year % Small CHP MWe % Heat Pump Group 2 MWe % Heat Storage CHP GWh % Large CHP MWe % Heat Pump Group 3 MWe % Heat Storage Solar GWh % Boilers Group 2 & 3 MWth % Coal Power Plants MWe % Gas Power Plants MWe % Oil Power Plants MWe % Biomass Power Plants MWe % Wind Onshore MWe (see Table 50) % Wind Offshore MWe (see Table 50) % Photovoltaic MWe (see Table 50) % Wave Power MWe % River Hydro MWe % Hydro Power MWe % Hydro Storage GWh % Hydro Pump MWe % Nuclear MWe % Geothermal MWe % Alkaline Electrolyser MWe % SOEC Electrolyser MWe % Hydrogen Storage GWh % Pump MWe % Turbine MWe % Pump Storage GWh % Individual Solar Thermal TWh/year % Waste CHP TWh/year % Absorption Heat Pump MWth % Biogas Plant TWh/year % Gasification Plant MWgas % Biodiesel Plant MW-Bio % Bioethanol Plant MW-Bio % Bio-jetfuel Plant MW % Tidal MWe % 199
201 Table 50: Investment costs assumed for wind and photovoltaic plants in 2010, 2030, and 2050 [47]. Investment Costs (M /MW) Onshore Wind Offshore Wind Photovoltaic Table 51: Fuel prices assumed [68]. /GJ Crude Oil (US$/bbl) Natural Gas Coal Fuel Oil Diesel Petrol/JP1 LPG Biomass Nuclear Table 52: Fuel handling prices assumed [68]. /GJ Centralised Decentralised Power Fuel Power Plants Plants & Industry Consumer Natural Gas Coal Fuel Oil Diesel/Petrol Jet Fuel Straw Wood Chips Wood Pellets Energy Crops Table 53: Carbon prices assumed [68]. Year CO2 Price ( /t) Projected assuming the same trends as in
202 Table 54: Carbon dioxide emission factors assumed [61]. Fuel Coal/Peat Oil Natural Gas Emission Factor (kg/gj)
203 ANNEX X: ENERGYPLAN OUTPUT SHEETS

204 18.1 EU-EE

205 204

206 18.2 HRE-EE

207 206

208 18.3 EU-EE
209 208

210 18.4 HRE-EE
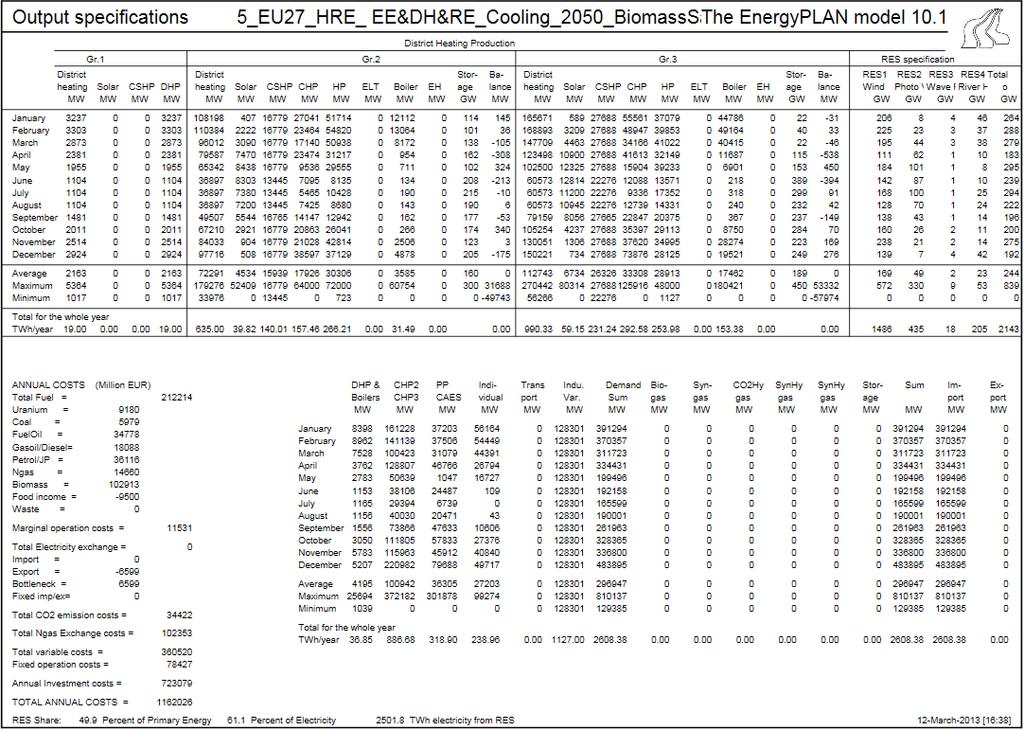
211 210
212 19 ANNEX XI: DATA USED TO CREATE ENERGY-SYSTEMS-ANALYSIS FIGURES Figure 3: Primary energy supply and carbon dioxide emissions in the Energy Efficiency (EU-EE) and Heat Roadmap Europe (HRE-EE) scenarios for the years 2030 and Figure 61: Primary energy supply and carbon dioxide emissions for the EU-EE and HRE-EE scenarios in the years 2030 and Primary Energy Supply (TWh/year) EU-EE HRE-EE EU-EE HRE-EE Nuclear 1,879 1,879 1,700 1,700 Coal 1,487 1, Oil 4,498 4,477 1,378 1,360 Gas 3,905 4,026 2,535 2,612 Biomass 1,643 1,643 2,769 2,769 Waste RES 1,799 1,879 2,682 2,761 Total 15,419 15,756 11,816 12,208 Nuclear, Fossil Fuels & Biomass (TWh/year) 13,412 13,510 8,901 8,961 Carbon Dioxide Emissions (X, Mt/year) 2,462 2, Electricity Exports (, TWh/year)
213 Figure 4: Total annual costs for heating and cooling in the residential and services sectors for the Energy Efficiency (EU-EE) and Heat Roadmap Europe 2 (HRE-EE) scenarios in the years 2030 and Figure 64: Total annual costs for heating and cooling in the residential and services sectors for the EU-EE and HRE-EE scenarios in the years 2030 and Total Costs for Heating and Cooling in the Residential and Services Sectors (B /year) EU-EE HRE-EE EU-EE HRE-EE Energy Efficiency Investments Heating System Investments Cooling System Investments Centralised Electricity & Heat Plants Fuel CO Total Difference Difference (%) -15.9% -14.0% 212
214 Figure 43: Primary energy supply by fuel and the net electricity exports for the EU-EE scenario from the original reference projections and the EnergyPLAN model. Energy Efficiency Scenario Primary Energy Supply (TWh/year) Reference EnergyPLAN Reference EnergyPLAN Reference EnergyPLAN Nuclear 2,733 2,733 1,878 1,879 1,700 1,700 Coal 3,269 3,262 1,531 1, Oil 6,083 6,078 4,498 4,498 1,378 1,378 Gas 5,150 5,135 3,901 3,905 2,425 2,535 Biomass 1,119 1,118 1,711 1,643 2,762 2,769 Waste RES ,799 1,799 2,682 2,682 Total 19,153 19,126 15,527 15,419 11,696 11,816 Electricity Exports (-, TWh/year) Figure 51: Fuel consumption by individual boilers in the EU-EE and HRE-EE scenarios for the years 2030 and Fuel Demand for Heating Individual Residential and Services Buildings (TWh/year) EU-EE HRE-EE EU-EE HRE-EE Solids Oil Gas 1,246 1, Biomass Solar Electricity Total 2,555 2,482 1,
215 Figure 52: Annual investment and operation costs for heating networks and consumer installations for the EU-EE and HRE-EE scenarios in the years 2030 and Annual Costs for Heating Networks and Scenario EU-EE HRE-EE Consumer Installations (B /year) Year Residential Individual Units Residential Central Heating Systems Services Individual Units Services Central Heating Systems District Heating Network Total Figure 59: Heat demand by fuel for residential and services buildings in the EU-EE and HRE-EE scenarios for the years 2030 and Heat Demand for Residential and Services Buildings (TWh/year) EU-EE HRE-EE EU-EE HRE-EE District Heating 270 1, ,324 Solids Oil Gas 1,109 1, Biomass Solar Direct Electricity Heat Pumps Geothermal Total 2,715 3,477 1,584 2,
216 Figure 60: District heating production by plant type in the EU-EE and HRE-EE scenarios for the years 2030 and Note: some of the district heating is used by absorption heat pumps to provide cooling as discussed in section 5.2. District Heating Supply for Residential and Services Buildings (TWh/year) EU-EE HRE-EE EU-EE HRE-EE CHP Boiler Heat Pumps Solar Geothermal Waste Industry Total 337 1, ,
217 Figure 62: Primary energy supply for heating and cooling in residential and services buildings in the EU-EE and HRE-EE scenarios for the years 2030 and Primary Energy Supply for Heating and Cooling in Residential and Services Buildings (TWh/year) EU-EE HRE-EE EU-EE HRE-EE Coal Oil Gas 1,649 1, Biomass Waste Wind Power Solar Thermal Surrounding Heat for HPs 179 1, ,802 Geothermal for DH Industry Surplus Heat Total 3,467 5,411 2,051 4,173 Figure 63: Total annual energy system costs for the EU-EE and HRE-EE scenarios in the years 2030 and Total Costs (B /year) EU-EE HRE-EE EU-EE HRE-EE Investment Fuel Fixed O&M Variable O&M CO Total 1, , , ,
218 Figure 66: Total annual costs for heating and cooling in the residential and services sectors for the EU-EE and HRE-EE scenarios in 2050 for different energy efficiency and district heating cost assumptions. *Represents a scenario with 50% additional energy efficiency costs and 50% direct energy efficiency costs (see Figure 65). # Assumes that all additional district heating in the EU27 is in areas with a heat density less than 50 TJ/km2. ^Based on forecasted heat densities in the European Heat Atlas (Figure 14). Original Scenarios Sensitivity Analysis EU-EE HRE-EE EU-EE HRE-EE Total Costs for Heating and Cooling in the Residential and Services Sectors (B /year) Marginal Efficiency Costs No DH Expansion Additional Efficiency Costs High DH Expansion Costs# Direct & Additional Efficiency Costs* No DH Expansion Direct & Additional Efficiency Costs* Realistic DH Expansion Costs^ Energy Efficiency Investments Heating System Investments Cooling System Investments Centralised Electricity & Heat Plants Fuel CO Total Difference Difference (%) -14.0% -21.5% 217

219 20 ANNEX XII: AARHUS CASE STUDY 20.1 PURPOSE WITH THE CASE STUDY This case study has several purposes. The first is to examine the technical and economic consequences of supplying a larger urban area with district heating, based on information on the heat demands, the size of the grid and the supply units in an actual area. The second is to examine the consequences of reducing the heat consumption of buildings in the area, and the third is to compare the district heating solution to an individual heat pump solution. Aarhus was chosen as a good case, because it currently has a large share of district heating, a large variation in building types, and access to excess heat from waste incineration and industry STRUCTURE OF THE CASE STUDY The case study is structured as illustrated in Figure 88. Figure 88: Case study structure. First, the reference system is described with an emphasis on the boundaries of the study and the production units in the area. The reference system is used as the basis for the analyses in the case study. This is followed by a section about the demands in the reference system for both heat and electricity. The demand section is followed by a section about the implemented savings, which will have an effect on the design of the supply systems in each scenario. In the following sections, supply systems are designed for both scenarios. From this, the results in the form of heat and electricity production, fuel use, and economy will be presented. Finally, the discussion and conclusions are presented GEOGRAPHIC BOUNDARIES AND ENERGY DEMANDS The geographic boundaries of the case study are defined in Figure 1. The reason for working with these specific boundaries is that the properties of the district heating network within this area were 218

220 available, since the grid within this area is operated by one company, the municipality owned district heating company in Aarhus. There are other areas connected to the Aarhus district heating grid, but these are excluded from this analysis, since network data is not available for these. The areas used in the case study represent approximately 82.4% of the heat demand in Aarhus municipality and the area is around 110 km 2. Figure 89: Geographic boundaries used in the case study. In the reference, the total heat demand of buildings is 2,323 GWh/year and, by including a 20% grid heat loss, the final energy consumption is assumed to be 2,904 GWh/year. The heat demand density in Aarhus is high compared to a large share of the European cities. Figure 90 illustrates the population density and heat demand density for European cities that are included in the urban morphological zone dataset [1], which includes cities with more than 17,300 inhabitants. The information on population and heat demands are from the heat atlas described in chapter 3 of the main report. 219
221 Population density [Inh./km2] 14,000 12,000 10,000 8,000 6,000 4,000 2,000 Pop density Aarhus Heat demand density Pop density, cities Heat demand density Aarhus Heat demand denisty [TJ/km2] ,000, ,000, ,000, ,000,000 Cumulative population Figure 90: Population and heat demand density in European Cities based on [1]. The population density of Aarhus is in the lower end with around 2,000 inhabitants per km 2, but the heat demand density is high with around 70 TJ/km 2. Therefore, Aarhus could be seen as a good case of district heating and the results of the case study should reflect this. Since the benefits of district heating are mainly related to the use of combined heat and power (CHP) plants, the electricity demand is included in the case study as well. The electricity consumption of the area is assumed to be 82.4% of the total electricity demand in Aarhus municipality. The current demand in the municipality is estimated at 1,700 GWh/year and 82.4% of this is 1,401 GWh/year METHODS The methods used in the case study consists of two categories; the first is an energy system analysis made in EnergyPRO [2] and the second is a geographic analysis that applies geographic information systems with information about heat demands and district heating networks. In short EnergyPRO is a deterministic model that in this case is used to simulate the case area on an hourly basis, where the heat and electricity demands are fulfilled according to a fixed operation strategy of the energy production units within the area. The reason for including an hourly modelling of the case system is to find the impact from savings on 1) the demand for production capacity 2) the resource use related to the production. These are further on used to find the annual costs of the different Scenarios. 220

222 20.5 REFERENCE SYSTEM The reference system used in this case study is based on the supply system which is expected to be in place in the year 2016, according to the district heating company in Aarhus [3], see Figure 91. Figure 91: Reference system design for the Aarhus case study. The system utilizes a variety of different fuels and production units. As in the major part of larger district heating systems in Denmark, waste incineration plants are used as base-load plants, in this case with a heat production capacity of 112 MW in total. Another large producer that operates as base load is a new straw-fired CHP plant with a heat production capacity of 81.6 MW. In the present 221