nzeb implementation progress and open issues in national applications
|
|
|
- Silvia Beverly Nicholson
- 5 years ago
- Views:
Transcription
1 CLIMA 2016 REHVA nzeb Workshop 23 May 2016, Aalborg nzeb implementation progress and open issues in national applications Jarek Kurnitski Professor, Vice-president REHVA Tallinn University of Technology Aalto University

2 REHVA nzeb Task Force TF prepared nzeb technical definition and set of system boundaries for primary energy indicator and RER calculation in 2011 in 2013 it was revised in cooperation with CEN, resulting in REHVA Report No:4 TF is following nzeb technical, regulatory and policy progress Latest, ongoing analyses on RE contribution and RER indicator based on data from 8 nzeb office and school buildings across the EU
3 Screening of energy frames and nzeb in 2013 Differences in energy frames: Primary energy not yet used in all countries Some countries (Germany, France) use reference building method, fixed values in other countries Both simulation (Estonia, Finland) and monthly methods (Germany, Denmark) used Inclusion of energy uses depends on country: Germany/residential heating energy only (space heating, DHW and heating of ventilation air) Germany/non-residential cooling and lighting also included (appliances not) Denmark appliances and in residential also lighting not included Sweden appliances and user s lighting not included (facility lighting incl.) Estonia, Finland, Norway appliances and lighting included (all inclusive) RES (on site renewable energy production) is not accounted in all countries or is accounted differently

4 European climate zones
5 Region Zone 1-2 (Catania, Athens) Zone 3 (Budapest, Bratislava, Ljubjana) Zone 4 (Paris, Amsterda m Berlin, Brussels, Copenhag en, Dublin, London, Macon, Nancy, Prague, Warsaw) Country Cyprus 180 nzeb Energy performance RES Values Unit Metric Energy uses for: Building type EP calculation nzeb req. 210 Slovakia 54 Belgium BXL Belgium Walloon Belgium Flemish ,5*(V/S) kwh/m 2 /y kwh/m 2 /y kwh/m 2 /y Primary energy Primary energy Primary energy 60 kwh/m 2 /y Primary energy France kwh/m 2 /y kwh/m 2 /y Energy use Primary energy Ireland 45 kwh/m 2 /y Energy load heating, cooling, hot water, lighting Heating, hot water, ventilation, cooling (non-res), lighting (non-res) heating, cooling (non-res), hot water, lighting (non-res), auxiliary electricity heating, hot water, auxiliary electricity Heating, cooling, hot water, ventilation, auxiliary systems heating, ventilation, cooling, hot water, lighting, auxiliary systems heating, ventilation, hot water, lighting Residential Nonresidential Detached Apartment Offices Residential Offices, educational Residential and non-res. Residential Office and school Residential Office Office AC No No N.a. N.a. N.a. Yes Yes 25% 25% 50% 50% 50% N.a. 50% Yes Yes No No No - - >10 kwh/m 2 y >10 kwh/m 2 y Residential N.a Netherlands 0 [-] Energy heating, ventilation, Residential/ perform. cooling, hot water, non-residential coefficien lighting t (EPC) Data from CA EPBD Oct 2013 (Kurnitski et al. REHVA Journal 2/2014) Yes Yes - -
6 Region Country nzeb Energy performance RES Values Unit Metric Energy uses for: Building type EP calculation nzeb req. Zone 5 (Coopenh agen, Tallinn, Helsinki, Riga, Stockholm, Gdansk, Tovarene) Denmark Estonia kwh/m 2 /y kwh/m 2 /y Primary energy Primary energy Latvia 95 kwh/m 2 /y Primary energy heating, cooling, ventilation, hot water, lighting (non-res) heating, ventilation, cooling, hot water, lighting, auxiliary electricity, appliances heating, cooling, domestic hot water, ventilation, lighting Residential Non-residential Detached house Apartment Office Hotel Residential/ nonresidential Yes Yes 51-56% 51-56% Yes - Yes - Yes - Yes - - N.a. - Lithuania <0,25 [-] Energy performance indicator C heating Residential/ not-residential N.a. 50% Data from CA EPBD Oct 2013 (Kurnitski et al. REHVA Journal 2/2014)

7 BPIE factsheet on nzeb definitions

8 BPIE factsheet on nzeb definitions
9 RES in energy frames and nzeb applications (2015 data) In 2013 RES was not yet implemented in present calculation frames in 5 out of 10 countries with nzeb application Most of energy frames were not yet ready to support exported energy: Full utilization on annual bases: Denmark, Estonia, net plus energy program in Germany Monthly bases (limited to the amount of the delivered electricity each month and the rest of exported is not accounted): Germany Not accounted: Finland, Norway, Italy, 8 out of 13 countries have set specific indicator for RES in nzeb application (2015 data) There is no information that nearby RES has implemented in any country, however ongoing in DK, FI but mostly a future issue to be solved with RES inclusion and exported energy
10 Towards nearly zero energy buildings Indicator Denmark Energy frame 2010 Energy frame 2015 Energy frame 2020 Maximum of primary energy to Primary energy factors Residential buildings (houses, hotels, etc.) Non-residential buildings (offices, schools, institutions and other buildings) /A in kwh/m²a /A in kwh/m²a /A in kwh/m²a /A in kwh/m²a 20 kwh/m²a 25 kwh/m²a Electricity District heating
11 Towards nearly zero energy buildings Estonia Primary energy requirements for 9 building types (apply from Jan 9, 2013) nzeb Low energy Min.req. new Min.req. maj.ren. A B C (cost opt.) D (cost opt.) kwh/(m 2 a) kwh/(m 2 a) kwh/(m 2 a) kwh/(m 2 a) Detached houses Apartment buildings Office buildings nzeb and low energy requirements officially given (not yet mandatory) Primary energy factors: Electricity 2.0 Fossil fuels 1.0 District heat 0.9 Renewable fuels 0.75
12 nzeb requirements summary 4/2015 Primary energy and % of minimum EP requirements are used as nzeb EP indicator in most of countries The range of values varies remarkably from positive energy buildings up to 270 kwh/m 2 /y primary energy: from to 20 kwh/m 2 /y to160 kwh/m 2 /y in residential buildings, but usually targets aim at 45 kwh/m 2 /y or 50 kwh/m 2 /y Values from 25 kwh/m 2 /y to 270 kwh/m 2 /y are reported for nonresidential buildings with higher values given for hospitals. Remarkable differences caused mostly due to different energy uses included, but the methodologies/input data have an effect and evidently there are differences in the ambition level nzeb primary energy values show a reduction by factor of 1.6 in Estonia and by 2 in Denmark compared to current EP minimum requirements of office buildings (reduction of 40-50%)
13 Open nzeb issues
14 1. Energy uses accounted: Open nzeb issues major difference if accounting or not appliances & lighting 2. System boundary onsite and nearby RES accounting (follows or not energy meters) 3. Time step: hourly vs. monthly calculation 4. Period and type of balance when accounting RES export Annual or limitations for instance on monthly level 5. Numerical indicators of energy performance Primary energy not yet fully established Qualitative/quantitative RES accounting 6. Building categories Standard uses and requirements for non-residential buildings
15 Energy uses accounted 7 countries out of 13 account appliances (AT, BG, EE, FI, LV, LT, NL), the rest do not 6 countries account lighting in residential buildings (EE, FI, FR, LT, SE, UK) Appliances and lighting correspond to kwh/m 2 y primary energy in residential buildings
16 Inclusion of appliances and lighting EE VV No 68: 2012 Minimum requirements for energy performance Minimum requirements are given for 9 building types, for new buildings and for major renovation nzeb and low energy building requirements officially given together with cost optimal minimum requirements Primary energy factors: Electricity 2.0, Fossil fuels 1.0, District heat 0.9 and Renewable fuels 0.75 nzeb [kwh/m²y] Low energy [kwh/m²y] Min. req. NEW [kwh/m²y] Min. req. Major REN [kwh/m²y] EPC class A B C D Detached houses Apartment buildings 50 (0 a ) (110 a ) (41 a ) (101 a ) 180 Office buildings 100 (62 b ) (128 b ) 210 a without lighting and appliances, b without appliances
17 Building categories Steering to optimal design solutions: define standard use/ nzeb requirement for each building category Usages, intensities and operation times vary a lot between different building categories optimal EE and RES measures differ accordingly EPBD Annex I building categories are relevant except hospitals Hospitals (EE nzeb=270) could be replaced with clinics/healthcare centers (12/24 and 5/7 operation instead of 24/24 and 7/7 operation with high loads from hospital equipment) Industrial buildings (very often without significant heat gains from the process) will deserve a separate category Grocery stores another specific category because EP depends mostly on the refrigeration condensation heat utilization


18 The effect of building categories EE VV No 68: 2012 Full set of EP requirements/standard use input data nzeb Low energy Minimum req. Minimum req. NEW (cost opt.) Major REN EPC class A B C D Building category kwh/(m 2 y) kwh/(m 2 y) kwh/(m 2 y) kwh/(m 2 y) Detached houses Apartment buildings Office buildings Hotels and restaurants Public buildings (theatres, sport halls, museums etc.) Shopping malls Schools Day care centres Hospitals
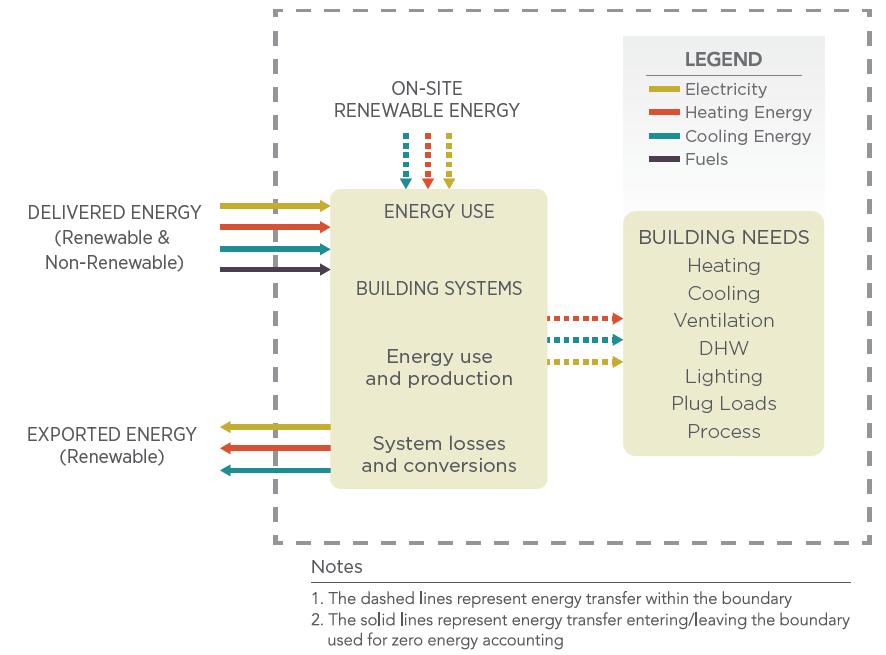
19 nzeb system boundaries 4-level system boundary needed to enable transparent calculation: 1. Energy need 2. Energy use 3. Delivered and exported on-site 4. Nearby RE D. D'Agostino / Journal of Building Engineering 1 (2015) 20 32
20 pren ISO/DIS :2015 system boundary with new nearby definition


21 REHVA system boundaries Primary energy RER System boundaries (SB) for energy need, energy use and delivered and exported energy calculation. The last one may be interpreted as the building site boundary. Demand reduction measures can be distinguished from RE solutions in the energy use SB, not in the delivered/exported energy SB
22 US DOE Site Boundary for ZEB Accounting Launched Sept 15,
23 Renewable energy contribution indicator (RER renewable energy ratio) useful or not
24 REHVA nzeb TF buildings: RER assessment FRA SUI Location Type Data Heating Cooling Renewable Dijon, Free cooling + Office Measured Biofuel PV France chiller Gland, Office Simulated GSHP Boreholes PV Switzerland NL1 Hoofddrop, the Netherlands Office Simulated GSHP GSHP BioCHP+SC FIN Helsinki, Finland Office Simulated District heat Boreholes PV NL2 Haarlem, the Netherlands Primary school Simulated, hourly GSHP GSHP PV+SC SWE1 Stockholm, Sweden Office Simulated, hourly District heat Boreholes Wind SWE2 EST Helsingborg, Sweden Rakvere, Estonia Office Office Measured, hourly Simulated, hourly GSHP Boreholes PV District heat Open wells PV


25 Older nzeb case studies Buildings 1-4 are nzeb office buildings in France, Netherlands, Switzerland and Finland Reported in REHVA Journal (3/2011, 2/2012, 5/2012)


 Construction year")

 without accounting district heat, achieved with nearby wind farm, district heating and boreholes.")
26 nzeb Task Force latest buildings (5-8 in the Table) DSK-II school, Haarlem, the Netherlands Väla Gård office building, Sweden Construction year m 2 Extra nzeb cost 250 /m 2 estimated Construction year m 2 Extra nzeb cost 230 /m 2 estimated General description Energy performance Primary school with zero energy consumption, meaning the total amount of energy used for the building itself on an annual basis is roughly equal to the amount of renewable energy produced on site. Net-zero energy building without accounting small power equipment loads, achieved with large on-site PV, heat pumps and energy wells. Entré Lindhagen office building, Sweden General description Energy performance Skanska office in Helsingborg. A nzeb office building, energy consumption is nearly zero or plus including tenant power over the year. LEED certified Platinum. Net zero energy building (small power equipment loads accounted) or plus energy building w/o small power, achieved with extensive on-site PV, ground source heat pump and boreholes. Rakvere Smart Building Competence Centre office building, Estonia Construction year m 2 Extra nzeb cost 55 /m 2 estimated (w/o wind farm investment) Construction year m 2 Extra nzeb cost /m 2 estimated General description Energy performance Skanska head office, Nordea office nzeb building, energy consumption 55 % less than code requirement, building demonstrates low speed ventilation and Skanska Deep Green Cooling, a ground cooling system without heat pump or chiller. Triple Leed Platinum. For core and shell, for Skanska interior design, for Nordea interior design. Net-zero energy building (small power equipment loads accounted) without accounting district heat, achieved with nearby wind farm, district heating and boreholes. Nearly zero energy building if the share of wind farm is not accounted. General description Energy performance Estonian first nzeb office building, primary energy consumption 60 % less than code requirement, building demonstrates smart building automation systems. Nearly zero energy building (small power equipment loads accounted), achieved with on-site PV, district heating and energy wells.

27 Delivered, on-site and nearby generated, and primary energy FRA SUI NL1 FIN NL2 SWE1 SWE2 EST Heating 10,5 6,0 13,3 38,3 20,5 32,2 10,0 25,0 Cooling 2,4 6,7 3,3 0,3 3,2 1,3 0,5 2,0 Fans & pumps 6,5 8,1 17,5 9,4 11,8 13,2 3,0 9,7 Lighting 3,7 16,3 21,1 12,5 12,5 16,5 12,6 11,3 Appliances 21,2 26,8 19,2 19,3 5,0 16,9 12,6 18,5 On site electricity -15,6-30,9-73,8-7,1-36,5-39,0-19,6 Nearby electricity -47,9 BioCHP fuel 184 Exported heat -50,0 Primary energy Primary energy factors nren ren tot Biofuel District heat Electricity
 correlation between primary energy and RER Not very")
28 RER indicator vs. primary energy Good (negative) correlation between primary energy and RER Not very technology dependent >100% RERp does not allow to draw conclusions on the grid load
29 What additional information RER provides? RER is not very sensitive on the use of total/ren, or nren primary energy factors or calculation without factors Annual RER value does not allow to estimate the grid load W/m 2 delivered and exported electricity indicators (hourly values) provide more information Haarlem Stockholm Helsingborg Rakvere Max delivered, W/m 2 32,6 24,2 27,0 13,9 Max exported, W/m 2-31,6-12,6-34,2-17,5 10th percentile, W/m 2-3,8-6,2-6,5-2,7 90th percentile, W/m 2 15,0 10,9 14,8 8,4

30 Rakennusteollisuus RT ry LVI-talotekniikkateollisuus ry Ympäristöministeriö

31 Rakennusteollisuus RT ry LVI-talotekniikkateollisuus ry Ympäristöministeriö
32 Conclusions To date, an official definition with numeric indicators is available in 15 MS (+ Brussels Capital Region and Flanders) In 3 countries implementation in the legislation is in progress In the remaining 9 MS (plus Norway and the Belgian Region of Wallonia), the definition is still under discussion The most urgent open nzeb issues to be harmonized are energy uses included (to be comparable), system boundaries and RES inclusion (to be transparent) and building categories (to be meaningful for design choices): Exclusion of the energy uses may led to situation where calculated energy use represents only a small fraction of measured energy use in real buildings Requirements set only for residential and non-residential show that majority of countries cannot tackle the eight building categories specified in EPBD recast Annex I nzeb extra cost of about +200 /m 2 remains a challenge, however some examples of /m 2 do exist