Problematica e Tecnologie per la cattura di CO 2 Stefano Consonni Dipartimento di Energetica - Politecnico di Milano
|
|
|
- Nigel Piers Williams
- 5 years ago
- Views:
Transcription


1 Pianeta 3000 La ricerca scientifica per l'ambiente e il Territorio Problematica e Tecnologie per la cattura di CO 2 Stefano Consonni Dipartimento di Energetica - Politecnico di Milano Milano, 12 novembre 2007
2 Outline of this talk 2 The scale of the greenhouse issue: quantitative targets for Carbon Capture & Storage Pre-combustion capture Oxy-fuel Post-combustion capture Performance and economic comparison
3 The greenhouse problem 3 The atmosphere as a bathtub: current inputs and outputs of carbon Fossil Fuel Burning 7 billion tons go in ATMOSPHERE 4 billion tons added every year 800 billion tons carbon Graphic courtesy of Rob Socolow Ocean Land Biosphere (net) = 3 billion tons go out 3 billion tons go out
4 The Wedges approach: past emissions 4 Graphic courtesy of Rob Socolow 14 Billion of Tons of Carbon Emitted per Year 7 Historical emissions
5 The Wedges 5 Graphic courtesy of Rob Socolow 14 7 Billion of Tons of Carbon Emitted per Year Historical emissions Currently projected path Flat path O 14 GtC/y Seven wedges 7 GtC/y
6 What is a Wedge? 6 A wedge is a strategy to reduce carbon emissions that grows in 50 years from zero to 1.0 GtC/yr. Total = 25 Gigatons carbon 1 GtC/yr 50 years Cumulatively, a wedge redirects the flow of 25 Gt(C) in its first 50 years. A solution to the Greenhouse problem should have the potential to provide at least one wedge.

7 Making a Wedge: wind electricity 7 Effort needed by 2055 for 1 wedge: One million 2-MW windmills (for a total of 2000 GW) displacing coal power. Today: 50 GW (1/40) Prototype of 80 m tall Nordex 2,5 MW wind turbine located in Grevenbroich, Germany (Danish Wind Industry Association)


8 Making a Wedge: efficient use of fuel 8 Effort needed by 2055 for 1 wedge: Note: 1 car driven 10,000 miles at 30 mpg emits 1 ton of carbon. 2 billion cars driven 10,000 miles per year at 60 mpg instead of 30 mpg. 2 billion cars driven, at 30 mpg, 5,000 instead of 10,000 miles per year. Property-tax systems that reinvigorate cities and discourage sprawl Video-conferencing
9 Coal electricity Wedge modern (90% capacity factor, 42% efficient) 1-GW coal plants, with CO 2 vented, will emit 1 GtC each year. An electricity-carbon wedge results from not building these plants. The IEA 2004 Reference Scenario showed 1400 GW of new coal plants built between now and 2030; the 2006 Reference Scenario shows 1800 GW. The principal reason for the upward revision: Coal is now expected to have less competition from natural gas.

")
10 The Weiburn project (Canada) 10

11 The In-Salah project (Algeria) 11
")
12 Capture + Enhanced Oil Recovery (EOR) 12


13 Making a Wedge with carbon storage 13 Effort needed by 2055 for 1 wedge: 3500 MtCO 2 /yr 100 x U.S. CO 2 injection rate for EOR A mass flow of CO 2 into the Earth equal to the mass flow of oil out of the Earth today Sleipner project, offshore Norway Graphic courtesy of Statoil ASA Graphic courtesy of David Hawkins
14 Rationale and approaches for CO 2 capture 14 CO 2 capture: a strategy to manage the transition toward carbon-free energy sources and carriers Conceptually, CO 2 capture from fossil fuel-fired power plants can be accomplished in three ways: treat the fuel pre-combustion capture (IGCC with fuel decarbonization) treat the oxidant oxy-fuel treat the flue gases post-combustion capture (amine chemical absorption)

15 CO 2 emissions: coal vs oil and natural gas 15
16 IGCC with fuel decarbonization 16 In an IGCC, coal is converted into a synthetic fuel gas (syngas) in a gasifier; CO 2 capture can be accomplished by syngas Water-Gas Shift (WGS) followed by CO 2 physical absorption Quenched syngas Shift Reactors Fuel Gasification and syngas Qench Heat Recovery oxygen Air ASU Sulphur Removal Unit CO2 Removal nitrogen De-Carbonated syngas Combined Cycle syngas to Gas Turbine Syngas Dilution and Saturation CO2 Liquefaction Plant Liquid CO2


17 IGCC with CO 2 capture and production of hydrogen 17 High temp. WGS reactor Low temp. WGS reactor Solvent regeneration, Claus, SCOT Solvent regeneration Quench + scrubber CO 2 lean exhaust gases H 2 and CO 2 rich syngas H 2 S phys./chem. absorption CO 2 physical absorption CO 2 drying + compression CO 2 to storage CO rich raw syngas H 2 rich syngas O 2 -blown coal gasifier Heat recovery steam generator fuel grade H 2 air 95 % pure O 2 coal slurry Air separation unit air N 2 for NO X control ~ Gas turbine ~

18 IGCC + CCS 18
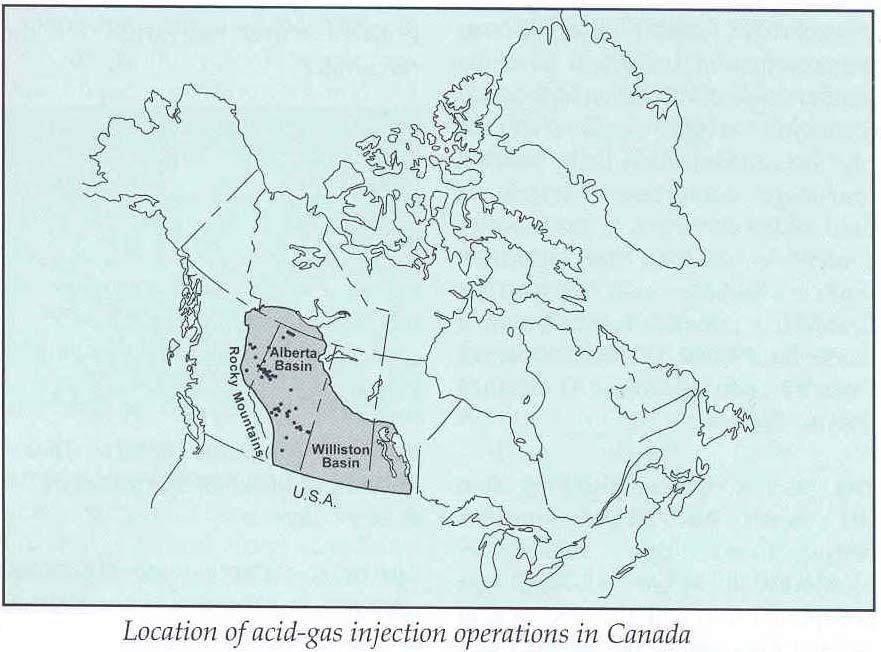
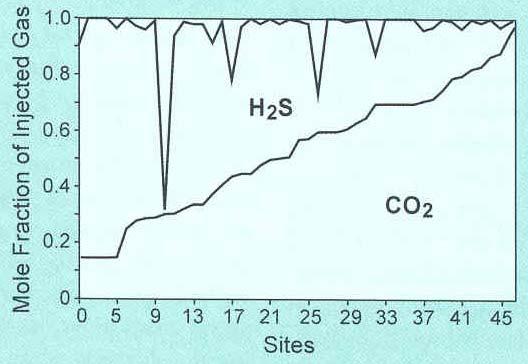
19 Co sequestration of CO 2 and H 2 S 19
20 IGCC + CCS: co-production of electricity and H 2 20 High temp. WGS reactor Low temp. WGS reactor Solvent regeneration, Claus, SCOT Solvent regeneration Quench + scrubber CO 2 lean exhaust gases H 2 and CO 2 rich syngas H 2 S phys./chem. absorption CO 2 physical absorption CO 2 drying + compression CO 2 to storage CO rich raw syngas H 2 rich syngas Pressure swing adsorption pure H 2 O 2 -blown coal gasifier Heat recovery steam generator purge gas air 95 % pure O 2 coal slurry Air separation unit air N 2 for NO X control ~ Gas turbine ~


21 Selexol plant for H 2 production from coal 21 Urea production in Coffeyville, Kansas. GE quench gasifier (former Cool Water)
22 Oxy-fuel 22 The power plant consists of a steam power plant where combustion air is substituted by 95% pure oxygen. Combustion gases are mainly composed of CO 2 and H 2 O. CO 2 can be segregated by simply cooling down the flue gases and knocking out the condensed water Fuel Oxygen Combustion and Steam Generation Flue Gases Treatment Flue Gases Flue Gases Cooling condensate removing Air ASU impure CO2 (86% vol) Condensate Inert Gases Nitrogen and Argon Steam Turbine CO2 Liquefaction Plant Liquid CO2 (96% vol)

23 Vattenfal Oxy-fuel technology 23 Graphic courtesy of John Topper - IEA Clean Coal Centre
24 IGCC with oxy-fuel 24 air separation section driven by gas turbine air compressor e.m. ASU e.m. oxygen compressors waste nitrogen liquefied CO2 to storage 9 condensate 10 CO2 liquefaction e.m. 4 gasifier 6 quench 5 ash coal slurry gasification island IP steam B saturator ~ A 7 sulfur removal semi-closed cycle gas turbine HP steam RH+IP steam steam turbine gaseous CO2 1 LP steam ~ LP bfw B heat recovery steam generator ~ condensate A power island
25 Post-combustion capture 25 This concept consists in treating the flue gas ahead of the stack while leaving the rest of the energy conversion system essentially unchanged Fuel Air Combustion and Steam Generation Flue Gases Treatment Flue Gases CO2 Removal CO2 free Flue Gases Steam Turbine CO2 Liquefaction Plant Liquid CO2
26 Post-combustion capture by chem. absorption 26 Air PreHeater Inlet Air 182 C CO2 free Flue Gases to Stack TAR 230 C 8 bar Tar-Air BOILER ATOM Once Through Boiler HT SH HT RH HT RRH OPEN PASS LT SH RH RRH ECO 345 C FILTER Exhaust Sorbent Recycle AM INE PLANT CO2 to liquefaction Steam to Atomization 230 C 10 bar DSH 600 C 350 bar 600 C 82,8 bar STEAM TURBINE 600 C 22,5 bar 385,5 C 90 bar 415 C 25 bar 32,9 C 0,05 bar Sorbent BFW to ECO LP 3,5 bar Hot Condensate CO2 PLANT Liquid CO2 Condensate

:")
27 Chemical absorption - Malaysia 27 Supplier: MHI, Japan Capacity (flue gas treated): 47,000 m n3 /h
28 Power output and efficiency: current technology 28 Current technology oxy-usc/ wet FGR USC / Amine IGCC with CO2 Plants without CO2 capture USC 600 IGCC F Thermal Power Inlet, MWth (LHV) Steam Turbine Gross Power, MWe Gas Turbine Gross Power, MWe Syngas Expander Power, MWe Power Plant Auxiliaries, MWe ASU, MWe CO2 Liquefaction, MWe Net Power Output, MWe Net Efficiency (LHV) 36.1% 33.5% 37.0% 43.8% 43.2% Specific CO2 emissions, g/kwhe From Consonni S. and Pelliccia G. (2004) "Comparative analysis of low CO 2 emission coal-fired power plants", Energy and Environment 2004, Sorrento (Italy)
29 Costs: current technology 29 oxy-usc/ USC / IGCC with Plants without CO 2 capture wet FGR Amines CO 2 capture USC 600 IGCC F Net Investment Cost before Interest Interest during construction 16.52% 16.52% 16.52% 16.52% 16.52% Net Investment Cost Specific Investment Cost, /kw COE investment, c /kwh Variable Costs CO 2 Disposal, c /kwh O&M and Consumables, c /kwh Fuel, c /kwh COE variable Cost, c /kwh TOTAL COE, c /kwh Cost Avoided CO 2, Capture, /tonco Cost Avoided CO 2, Disposal, /tonco Total Cost Avoided CO 2, /tonco From Consonni S. and Pelliccia G. (2004) "Comparative analysis of low CO 2 emission coal-fired power plants", Energy and Environment 2004, Sorrento (Italy)
30 Conclusion of 2004 study 30 IGCCs with water-gas shift and CO 2 capture by physical absorption can apparently achieve the highest efficiency, the lowest COE and the lowest cost of avoided CO 2 Oxy-fuel USCs exhibit slightly lower performances and slightly higher costs Amine-based systems appear significantly worse from the point of view of both efficiency and costs The gap between IGCCs is not large enough to give a definitive answer about their competition a situation which does not change when going from current to advanced technology. CO 2 capture causes a decrease in net efficiency of about 7 percentage points and a COE increase between 2 and 3 c /kwhe The cost of avoided CO 2 is the range per ton of CO 2
31 Additional considerations 31 For electricity production, may expect tight competition between IGCCs and oxy-fuel Added advantage of oxy-fuel is its applicability to existing plants Added advantage of IGCC is its capability to generate decarbonized hydrogen
32 Conclusions 32 Thank you for your attention!