Flanders. 13,520 km² Low lands near the North Sea : 0-90m above sea level mild oceanic climate dense river network
|
|
|
- Grace Dorsey
- 5 years ago
- Views:
Transcription


1
2

3 Flanders 13,520 km² Low lands near the North Sea : 0-90m above sea level mild oceanic climate dense river network

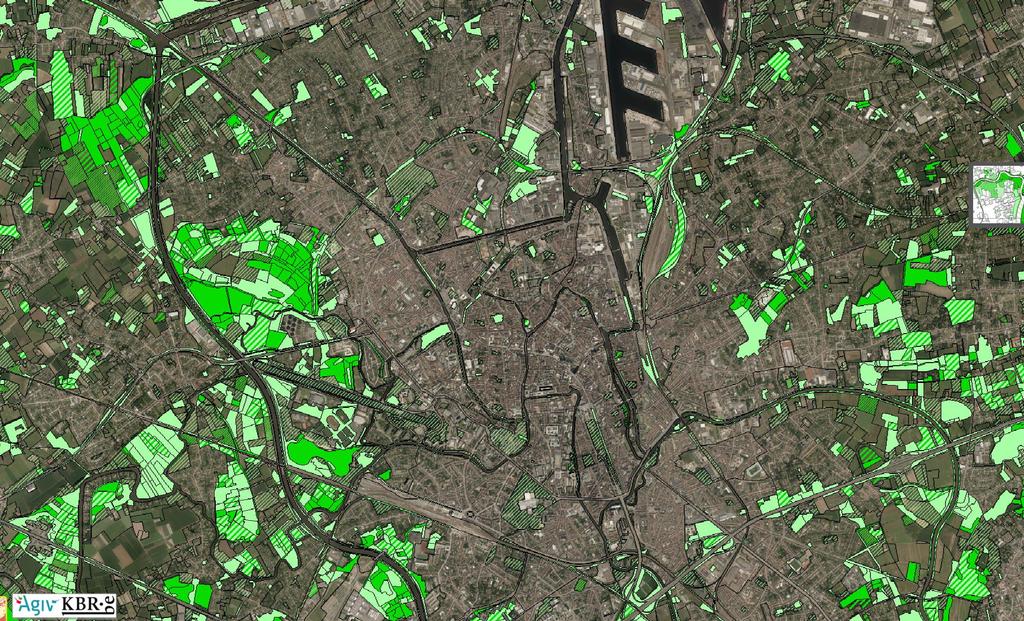
4 Kaartje historisch wetland (Gent) vroeger en nu 1770 We can dream of going back, but not realistic
5

6 Land reclaimed from the sea since the early Middle Ages
 Drainage class (9) Profile development class (13) Substrate class")
7 Flemish soil map ( s) Very detailed (1:20,000) Texture class (11) Drainage class (9) Profile development class (13) Substrate class (15)
8 Classification of wetland types Wetlands on temporary wet soils : meso-eutrophic oligotrophic Wetland on permanent wet soils: meso-eutrophic oligotrophic Tidal wetland Open waters: deep waters shallow waters + forest distribution maps forested non-forested
9 Historical wetlands in Flanders (± 1950)
")
10 Vegetation maps ( ) Very detailed (1:10,000) 180 habitat type units (40 types of wetland habitat)
11 Actual wetlands in Flanders (± 2005)

12 Historical wetlands in Flanders (± 1950)
13 Potential wetlands Assumptions: Return to environmental conditions of ± 1950 is ± possible (long term effort!) No potential for restoration if urban Additional opportunities in flood hazard areas Standstill for existing habitat types with biological value Scenario 1: open wetland landscape Scenario 2: forested wetland landscape

14 Flood hazard map (2014)
15 Decision support map for potential wetlands in Flanders (forest landscape scenario) 15

16 Decision support map for potential wetlands in Flanders (open landscape scenario) 16
17 Total wetland area in Flanders 19% of FL 17% 5% 75% (176,000ha) lost since 1950 s: 37,000ha (15%) by urbanisation; rest (85%) by agricultural intensification At present still 5% of Flanders is wetland (68,000 ha of which 44,000ha protected) 147,000ha potentially to be restored historical wetland
 of historical floodplain")
 -55% of historical floodplain")
18 Wetlands on temporary wet soil (meso-eutrophic) x3-75% (95,000ha) of historical floodplain grasslands (converted into intensive agriculture or urbanized) -55% of historical floodplain forest 18
 x14-95% (24,000ha)")

19 Wetlands on temporary wet soil (oligotrophic) x14-95% (24,000ha) of historical moist/wet heath and nutrient-poor grassland -95% of forest 19
 x6-95% (41,400ha) of")
 of historical swamp forest 72% can")
20 Wetlands on permanent wet soil (meso-eutrophic) x6-95% (41,400ha) of historical rich fens and marshes -60% (4,500ha) of historical swamp forest 72% can potentially be restored 20
 x6-95% (4,000ha) of")
 of bog forest 88% can")
21 Wetlands on permanent wet soil (oligotrophic) x6-95% (4,000ha) of historical wet heath and bog -50% (500ha) of bog forest 88% can potentially be restored 21
 of salt,")


22 Tidal marsh x15-90% (2,700ha) of salt, brackish and freshwater tidal marsh Huge potential for restoration along the river Scheldt (ongoing!) 22


23 Shallow waters >200% increase At present: 90% of shallow waters are eutrophic 23


24 Deep waters 300% increase since 1950 s (port docks, extraction pits etc.) 24
25 Main wetland ecosystem services Regulating services: Flood protection Water quality regulation Carbon fixation and storage Water storage (+ groundwater recharge) Provisioning services: Fish production Dairy and beef production (grazing marsh, hay, silage) Cultural services: Science and education Tourism and recreation Heritage landscapes Supporting services Biodiversity and gene pool
26 Flanders Regional Ecosystem Service Assessment (Stevens et al. 2015) Code Ecosystem Service Mapping Indicator unit Reference C1 Cultural Services % cover of valuable landscapes Simoens et al 2014 R1 Flood Risk Regulation expert scored flood and land use maps Schneiders et al 2014 R2 Coastal Protection m of natural coastal protection/ha Provoost et al 2014 R3 Water Quality Regulation % potential nitrogen removal Vrebos et al 2014a R4 Pollination % surface within reach of pollinators De Bruyn 2014 R5 Air Quality Regulation roughness index Neirynck & Stevens 2014 R6 Climate Regulation kg carbon stored/ha Lettens et al 2014 R7 Erosion Risk regulation % cover of soilfixing vegetation Van der Biest et al 2014 R8 Sound buffer absorbing surface/ha De Blust & Van Renterghem 2014 P1 Energy Crop Production tonnes/ha Van Kerckvoorde & Van Reeth 2014 P2 Wood Production m³/ha Vandekerkhove et al 2014 P3 Wild Meat Production kg/ha Scheppers & Casaer 2014 P4 Ground Water production m³ infiltrated/ha Vrebos et al 2014b P5 Food Production % of maximal potential yield Van Gossum et al 2014 See also:
27 Ecosystem service profiles for different wetland type categories in Flanders. Scores are derived as the median of normalized ecosystem service supply.
28 R3 - Water Quality Regulation
29 Fig.1. Ecosystem service profiles for different wetland type categories in Flanders. Scores are derived as the median of normalized ecosystem service supply from the Flanders Regional Ecosystem Assessment supply maps (Jacobs et al. in press, Jacobs et al. 2014a, Stevens et al. 2015). For instance, in permanent wet, oligotrophic nonforested habitats (upper left panel), the pixels of this habitat on the climate regulation supply map of Flanders (R6, normalized from 0-100) have a median score of 80%. Legend: C1 - Cultural Services; R1 - Flood Risk Regulation; R3 - Water Quality Regulation; R4 - Pollination; R5 - Air Quality Regulation; R6 - Climate Regulation ; R7 - Erosion Risk Regulation; R8 - Sound buffer; P1 - Energy Crop Production; P2 - Wood Production; P3 - Wild Meat Production; P4 - Ground Water production; P5 Food Production.
 Cultural Services Wild Meat Production Food")
30 Impact of two different wetland restoration/creation scenarios for the Flanders region. Scores are derived as the difference of total ecosystem service supply between scenarios and the current situation (driven by surface area distributions) Cultural Services Wild Meat Production Food Production Ground Water production Flood Risk Regulation Coastal Protection Water Quality Regulation Wood Production Energy Crop Production Sound buffer Pollination Air Quality Regulation Climate Regulation Erosion Risk Regulation
31 Monetary cost-benefit estimates of wetland restoration in Flanders (ECOPLAN-project, Staes et al.)
32 Monetary cost-benefit estimates of wetland restoration in Flanders (ECOPLAN-project, Staes et al.)
33 Monetary cost-benefit estimates of wetland restoration in Flanders (ECOPLAN-project, Staes et al.) If extensive agriculture is allowed on the temporary wet meso-eutrophic zones (changes in subsidies not taken into account) Wetland restoration Forest landscape scen. Wetland restoration Open landscape scen. Low estimate change in ES-delivery (mio /yr) -112,3-67,3 Mean estimate change in ES-delivery (mio /yr) 9,4 43,3 High estimate change in ES-delivery (mio /yr) 131,2 154,0 Note: not taken into account are Benefits for health, tourism and recreation (Broekx et al. 2013) Current mean cost of 50 mio /yr for economic damage due to flood hazards (VMM 2014) Current amount of public money spend to provide financial support to farmers Carbon sequestration due to restored, active peat formation
34 Wetland expansion in Flanders by 2050 as part of Natura2000 policy Min-max expansion target (ha) proportion of restoration opportunity (%) Temporary wet soil (meso-eutrophic) 3,490-6, Temporary wet soil (oligotrophic) Permanently wet soil (meso-eutrophic) Permanently wet soil (oligotrophic) Tidal marsh 2, Shallow water (oligo-mesotrophic & eutrophic) 1,485-2,366? TOTAL 8,892-13,002? TOTAL excl. open waters 7,406-10,636 ha 5-7* * but: 30% (49,000 ha) of 147,000 ha potential wetland already has appropriate spatial planning and protection status to justify wetland expansion
35
36