Reducing Greenhouse Gas Emissions and Planning for the Regional Land Use Vision, CDTC, the Albany NY MPO
|
|
|
- Nigel Preston
- 5 years ago
- Views:
Transcription


1 Reducing Greenhouse Gas Emissions and Planning for the Regional Land Use Vision, CDTC, the Albany NY MPO Chris O Neill Capital District Transportation Committee

2 CDTC is the designated Metropolitan Planning Organization (MPO) for the Albany- Schenectady-Troy and Saratoga metropolitan areas. Four counties, Eight Cities 850,000 Population
3 New Visions 2040 Regional Plan A strong sustainability agenda land use planning urban reinvestment transportation choices community values infrastructure investment


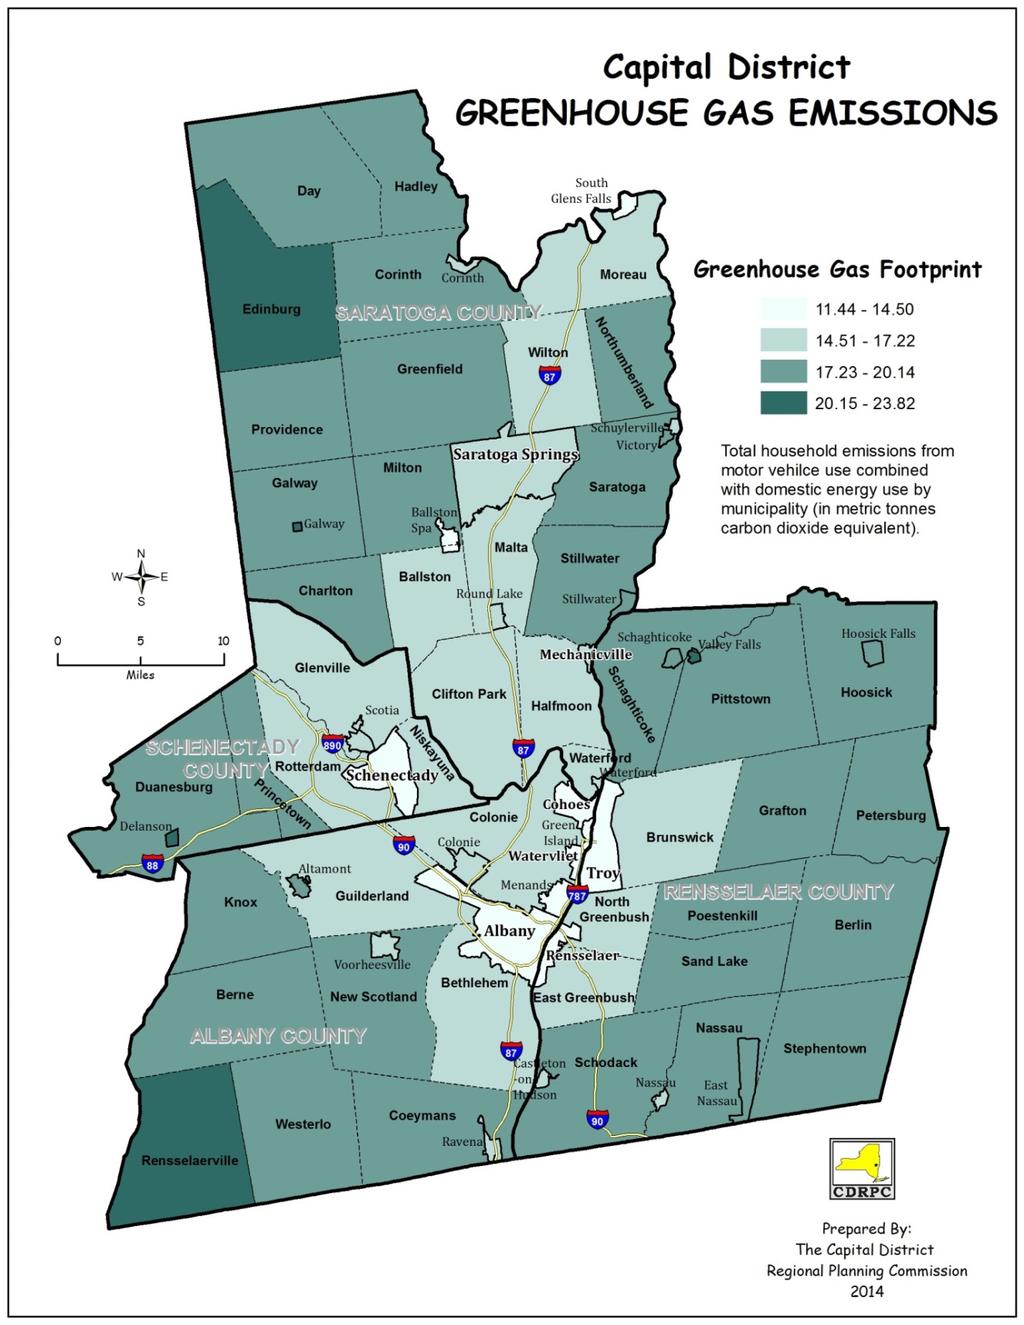
4 The CDTC New Visions Regional Transportation Plan Reducing Greenhouse Gas Emissions Protecting the environment and creating a more sustainable transportation system is an important New Visions strategy, particularly in light of global climate change
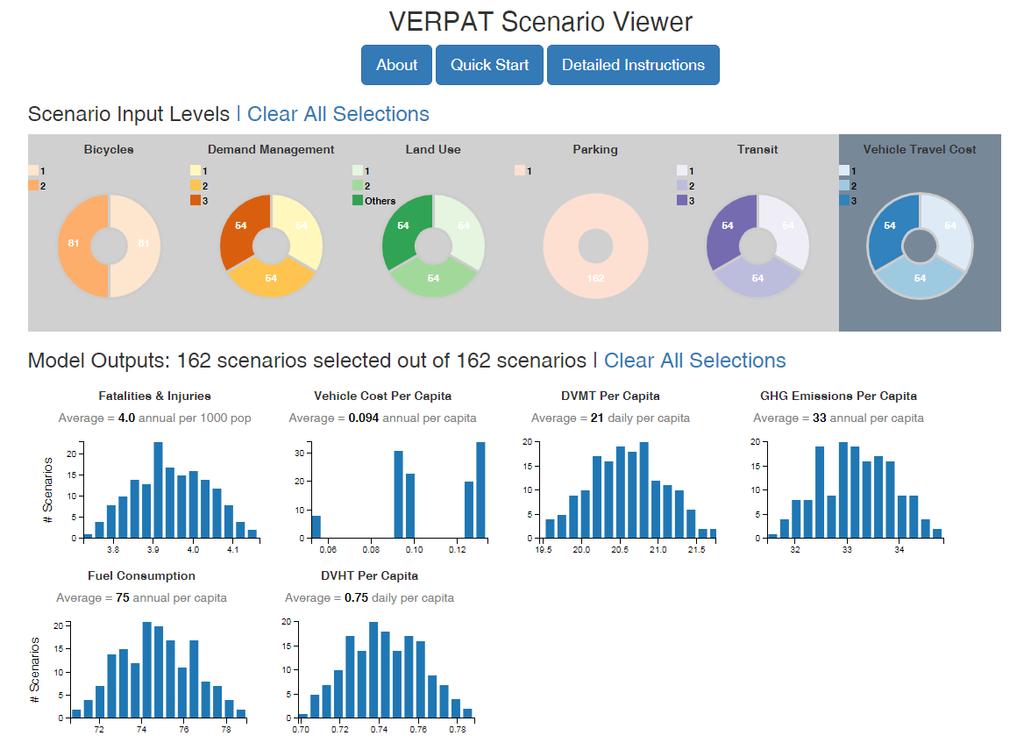
5 Implementation of a Regional GHG Reduction Analysis Tool Sponsored by the New York State Energy Research and Development Authority (NYSERDA) NYSERDA promotes energy efficiency and the use of renewable energy sources and reduction of greenhouse gas emissions Using the VERPAT tool (VisionEval Rapid Policy Analysis Tool), under contract with RSG, for the CDTC region the Ithaca Tompkins County Transportation Council (ITCTC) is also participating
6 NYS Energy Plan Goals: 40 percent reduction* by 2030 in GHG emissions from 1990 levels 80 percent reduction by 2050 in GHG emissions from 1990 levels 50 percent renewable electricity by 2030 Additional New York State Goal: reduce GHG emissions 26-28% by 2025 compared with 2005** *40 percent reduction in the energy sector which includes power generation, industry, buildings, and transportation **New York became one of the founding states in forming the U.S. Climate Alliance. The Alliance represents a bipartisan coalition of governors committed to upholding the Paris Climate Agreement and reduce GHG emissions percent by 2025 compared to 2005 levels.
7 The CDTC New Visions Regional Transportation Plan Land Use Planning Complete Streets and Walkable Communities Manage Congestion Transit Investment Travel Demand Management Electric Vehicles, Technology, Fuel Conservation

 and")

8 The CDTC New Visions Regional Transportation Plan Urban Reinvestment, Smart Growth Equitable investment of federal transportation funds in cities major accomplishment of CDTC Manage Congestion: do not widen the Northway, do not add physical highway capacity except in very limited applications Emphasize reliability (incident management) and operations Investing in physical capacity to address recurring delay inadvertently becomes urban disinvestment; subsidizes/incentivizes sprawl Consider greenhouse gas emissions and energy benefits

9 Land Use Planning: CDTC Linkage Program Encourage town and city land use planning Transportation investment follows land use plans and corridor studies Land Use Planning: 88 Linkage Studies in 40 communities so far, $6.3 M since 2000 Public process confirms regional vision for land use 9


10 The CDTC New Visions Regional Transportation Plan Performance Measures CDTC uses Community Quality of Life as a valid measure- qualitative, subjective, and real Safety Reliability, Freight Bike, pedestrian, transit access Bridge and pavement condition Air Quality Greenhouse Gas Emissions

11 CDTC Merit Evaluation Scoresheet
12


13 Implementation of a Regional GHG Reduction Analysis Tool Protecting the environment and creating a more sustainable transportation system is an important New Visions strategy, particularly in light of global climate change Greenhouse gas emissions were identified as an important performance measure Planning for the future involves admitting uncertainty policies, technology, mobility, and land use/development patterns Scenario Planning Using the VERPAT Tool
14 Concentrated Growth Scenario Concentrated Growth provides a better transportation system- Less congestion Better transit Better walking opportunities Better air quality Less gasoline costs Reduces VMT, greenhouse gas emissions Saves on water, sewer, schools, emergency services costs

15 Concentrated Growth Scenario Provides : Protection of Regional quality of life Protection of urban, suburban and rural community character
16 Scenarios to Test with the VERPAT Model Trend land use and development patterns Connected and Automated Vehicle technologies encourage development further from urbanized areas and increased sprawl development patterns, counteracting New Visions Plan goals Mobility as a Service and CAV technologies and urban reinvestment make the cities more attractive, encouraging transit oriented development in urbanized areas, furthering New Visions development pattern goals CDTC, State and federal investments and policies lead to accelerating use of electric vehicles beyond trend, consistent with New York State Energy Plan goals Market resistance leads to slower adaptation of electric vehicles given uncertainty with respect to federal policies Explore pricing options, such as a carbon tax
17
18 VERPAT Scenario Input Levels Used Bicycling Level 1-Current bicycling percentage Level 2- Double diversion of SOV tours Demand Management Level 1- Existing level Level 2- Double participation rates in ridesharing, etc. Level 3- Double participation rates in ridesharing, etc. and double transit subsidy Land Use Level 1- Trend growth in population and employment by place type Level 2- Urban reinvestment, infill, and close-in scenario Level 3- Exurban/suburban sprawl scenario Transit Level 1- Current public transit service level Level 2- Double public transit service level Level 3- Triple public transit service level Vehicle Travel Cost Level 1- No change in fuel prices or in roadway or externality charges Level 2- Extra charge of 4 cents per mile (Equivalent to increase $1.00 per gallon at 25 mpg) Level 3- Extra charge of 8 cents per mile (Equivalent to increase $2.00 per gallon at 50 mpg)
19 VERPAT Land Use Inputs (2) Urban Reinvestment (3) Exurban/Suburban Sprawl Pop Growth Emp Growth Pop Growth Emp Growth Rural 0.0% 0.0% 52.9% 52.9% Suburban Residential 0.0% 0.0% 17.2% 17.2% Suburban Employment 0.0% 0.0% 22.3% 22.3% Suburban Mixed Use 0.0% 0.0% 7.6% 7.6% Suburban Transit Oriented Dev 10.0% 10.0% 0.0% 0.0% Close In Community Residential 3.9% 0.0% 0.0% 0.0% Close In Community Employment 0.0% 9.6% 0.0% 0.0% Close In Community Mixed Use 10.0% 10.0% 0.0% 0.0% Close In Community Transit-Oriented Dev 12.5% 12.4% 0.0% 0.0% Urban Core Residential 18.6% 0.0% 0.0% 0.0% Urban Core Employment 0.0% 13.2% 0.0% 0.0% Urban Core Mixed Use 22.1% 22.0% 0.0% 0.0% Urban Core Transit Oriented Dev 22.9% 22.8% 0.0% 0.0%
20 Preliminary Findings Given that population growth and employment growth are relatively slow in the region, extreme assumptions about land use patterns seem to produce relatively minor changes in GHG emissions. Scenarios that test policies of expanding EV market success will be examined to evaluate impacts on GHG emissions Safety impacts are sensitive to changes in these scenario input levels
21 Next Steps Use the VERPAT model to refine the scenarios Examine different scenario outcomes for different horizon years, 2030, 2050 Use the results to establish the value of different policy actions Explore public support and decision maker support for different policies and actions to incorporate into the New Visions Plan update Present a vision of the future that incorporates mobility, transportation investments, land use planning, economic development, quality of life, and environmental sustainability

22 Thank You! Chris O Neill CDTC coneill@cdtcmpo.org