Modelling Airport Air Quality
|
|
|
- Theodora Ferguson
- 5 years ago
- Views:
Transcription
1 Modelling Airport Air Quality David Carruthers Cambridge Environmental Research Consultants Safeguarding Airport Air Quality Manchester 12 April 27
2 Outline of talk Key factors affecting air quality at airports Features of ADMS-Airport Airport Model performance and sensitivities - DfT PSDH Heathrow Model Inter-comparison (MIC)
3 Key factors affecting air quality at airports Emissions Background concentrations Meteorology Near field dispersion processes Chemical reactions
4 Features of ADMS-Airport An extension of ADMS-Urban gaussian type model nested in regional trajectory model Includes chemical reaction scheme, meteorological preprocessor, Monin Obukhov and mixed layer scaling for boundary layer structure Allowance for up to 65 sources: road (15, each with up to 5 vertices), point, line area and volume (15), grid sources (3) and up to 5 runway sources (exhaust modelled as moving jets) Other airport features Hour by hour time varying data Multi-segment line sources e.g. taxi ways GIS link displays line, volume and runway sources
5 Features of ADMS-Airport MODELLING EXHAUSTS AS MOVING JETS IMPACTS OF WAKE VORTICES Models engine exhausts as moving jet sources As the aircraft accelerates buoyancy and emissions increasingly spread along the runway the exhaust jet sees a faster ambient wind speed, this affects the plume rise The plume from the faster aircraft rises less than that from a slower aircraft Allows for the impact wake vortices may have on jet plume rise reduce buoyancy
6 Features of ADMS-Airport MODELLING EXHAUSTS AS MOVING JETS Entrainment depends on relative motion and ambient turbulence entrainment coefficients. Source Drag depends on velocity perpendicular to plume axis - drag coefficient Conservation of mass, momentum, heat and species Modifications within ADMS-AirportAirport Allowance for movement of jet engine sources; reduces effective buoyancy Allowance for impact of wake vortices on jet plume trajectory
7 Schematic of Jet Engine Engine casing Fuel burner Nozzle Bypass flow Exhaust flow Free Stream Core flow Fan Compressor Input: jet model requires Turbine (drives fan and compressor shaft) Engine exhaust, diameter D 1. Effective exit velocity (or volume flow rate) from mass flow rate, thrust and fuel burn rate 2. Temperature 3. Effective exit diameter derived from 1, 2
8 Neutral met conditions, plume trajectory (z p ) (1 st ), vertical spread (s z ) (2nd) and z p - s z (3rd) Plume centreline height Zp (m) Zp - sigma-z (m) sigma-z (m) Plume centreline height of the jet exhaust emitted at different points along the runway during takeoff at different points along the runway during take-off Vertical plume spread of the jet exhaust emitted The Difference take-off The roll between take-off starts roll plume at starts x = centreline with at x = the with aircraft height the and aircraft moving vertical moving the plume negative in the spread negative x-direction (Zp x-direction - sigma-z) of the jet exhaust emitted at different points along the runway during take-off The take-off roll starts at x = with the aircraft moving in the negative x-direction Neutral conditions, 5m/s wind Neutral Release conditions, temperature 5m/s wind degrees C -1 Release temperature degrees C Neutral conditions, 5m/s wind -1Release temperature degrees C X (m) -1-5 X (m) X (m)
9 Impacts of reduced buoyancy to simulate possible effect of wake vortices B747 long term contour concentration and difference plots All source buoyant First 4 sources buoyant No source buoyant absolute difference percentage difference
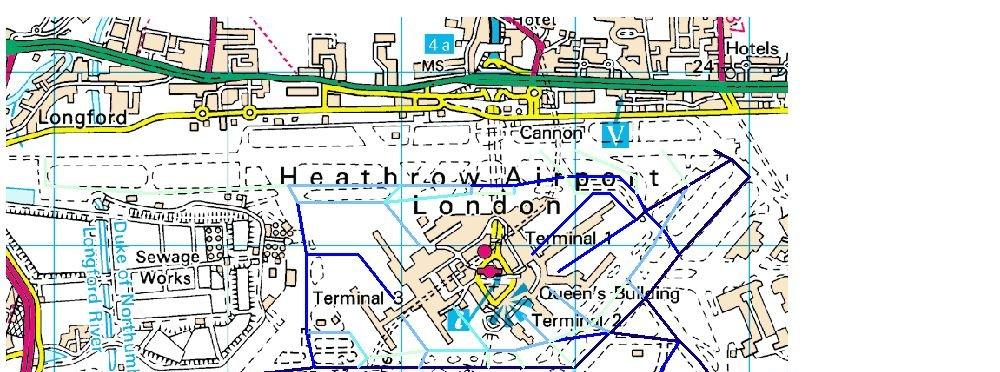
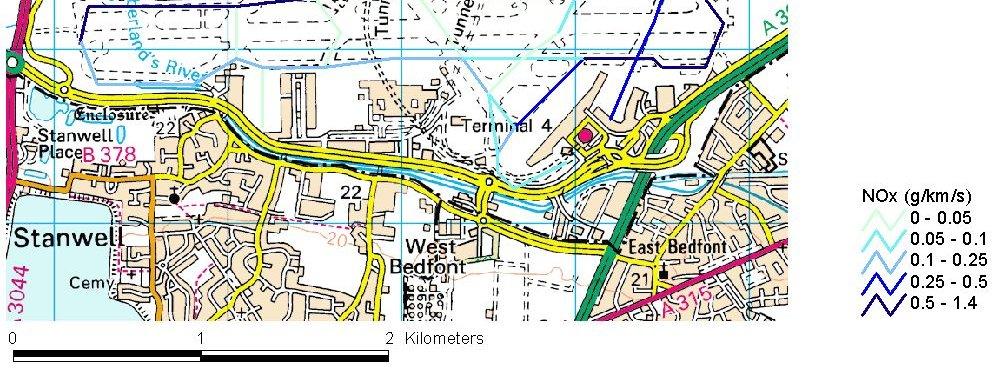
10 Heathrow : emission sources Gridded sources for all of London Roads local to Heathrow from LAEI (London Atmospheric Emissions Inventory) and the Heathrow Inventory LTO: taxi-in, in, taxi-out, landing, approach, initial climb, climb out Other: APU, airside vehicles, car parks, taxi ranks
) -.115.115 -.279.279 -.793.793-1.562 1.")
11 Grid sources from LAEI Explicitly modelled road sources Kilometers NOx (g/(km/s))
12 Taxi out
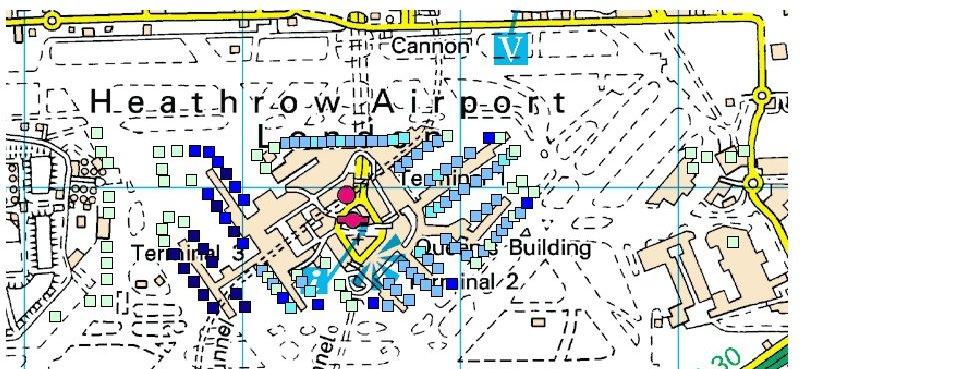
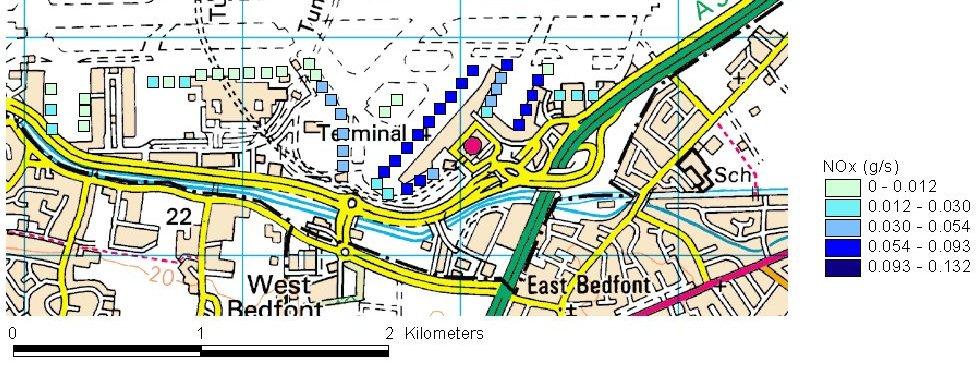
13 APU


14 Heathrow MONITORING DATA Hillingdon hospital PM from T5 works LHR2 - closest Teddington M25 Staines

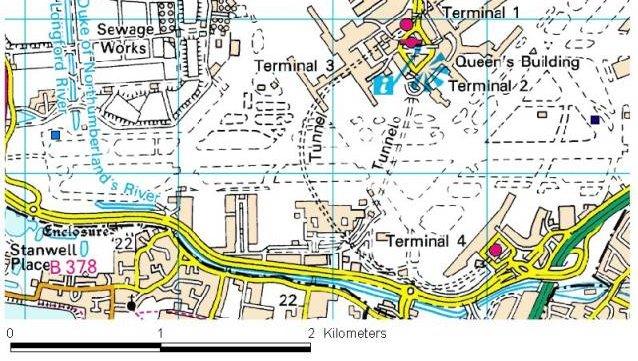
15 Heathrow MONITORING DATA * LHR2
16 (a) NOx, NO2 and Ozone (b) PM1 % Wicken Fen % Wicken Fen % Harwell 22 to to 6 % 135 to 22 6 to 135 % Rochester % Harwell 184 to 4 % 4 to 184 % Rochester Lullington Heath % Lullington Heath % Background concentrations for NO x, NO 2, O 3 and PM 1 NO x as NO 2 (µg/m 3 ) NO (µg/m 3 2 ) O (µg/m 3 3 ) PM 1 ( g/m 3 ) Annual average Maximum hourly average th percentile Annual average Maximum hourly average th percentile Annual average Maximum hourly average th percentile Annual average Maximum hourly average 9.41 st percentile of 24 hour averages 98.8 th percentile of 24 hour averages
17 Heathrow METEOROLOGICAL DATA (knots) (m/s) Wind speed
18 Co oncentration in (ug/m3) NOx monitored NOx calculated NOx NO2 monitored NOx NO2 calculated LHR2 LHR5 LHR6 LHR8 LHR1 LHR11 LHR14 LHR15 LHR16 LHR17 Overall Mean NOX (dark blue and red) and NO2 (yellow and light blue) monitored and calculated annual mean concentrations at the automatic monitoring sites
19 LHR2 LHR5 LHR6 LHR8 LHR1 LHR11 LHR14 LHR15 LHR16 LHR17 1 LHR2 Box and whisker plots for the ratio of (calculated/monitored) concentrations, NO X (top) and NO 2 (bottom). The lines indicate the 75 th, 5 th and 25 th percentiles and the lines extend from 22 NO 2 box and whisker plot the 95 th to 5 th percentile LHR2 LHR5 LHR6 LHR8 LHR1 LHR11 LHR14 LHR15 LHR16 LHR17
20 Comparison of LHR2 monitored and calculated NO 2 15 Calculated Monitored 1 NO 2 (µg/m 3 ) 5 21-Jan-2 26-Jan-2 31-Jan-2 5-Feb-2 1-Feb-2 Detailed time series comparison of monitored (blue) and calculated (red) hourly concentrations at receptor LHR2. 2I Jan 22 mid February 22
21 Departure F 27 R Departure 27R (all wind speeds) LHR2 Diurnal Variation ADMS-Airport compared with measured data Different Runway Use 5 25 Measured ADMS 2 No Departure 27R (all wind speeds) : 5: 1: 15: 2: Departure 27R Arrival 27R (all wind speeds) Measured ADMS 125 : 5: 1: 15: 2: Measured ADMS : 5: 1: 15: 2:
22 Comparison of monitored and calculated NO 2 in mg/m 3 at LHR2 as a function of wind speed. The top plot shows all hours. The bottom plot shows the hours when 27R is operational and the hours when it is not operational separately.
23 1 1 Measured v CERC > Measured v EDMS Measured LHR2 CERC predicted Measured v LASPORT Measured LHR2-1 Cambridge predicted Measured LHR2 Polar plots of NO x at LHR2 with background concentrations subtracted. Radius: wind speed in m/s. MMU predicted


24 Polar plots for the components of the aircraft emissions: APU Approach Climb out Take-off Hold Initial climb Landing Taxi-in Taxi-out

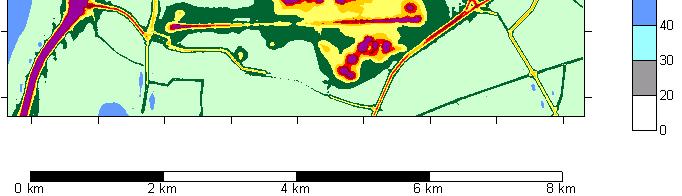
25 Annual average NOX mg/m3
26 km 2 km 4 km 6 km 8 km Annual average NOX concentration (mg/m3) (aircraft sources only)


27 Annual average NO2 mg/m 3, limit shown in bold
28 CERC NO2 (µg/m³) > < 2 1% and 2% Primary NO 2 Annual average NO 2 21 Annual average NO2 conce For 1% and 2% prim Figure 4.1a 5 1 Kilometers London 21-1% NO2 Annual average NO2 concentration Modelled using ADMS-Urban NO2 (µg/m³) > < 2 Figure 4.1b 5 1 Kilometers London 21-2% NO2 Annual average NO2 concentration Modelled using ADMS-Urban
29 Conclusions Key factors affecting pollutant concentrations in the neighbourhood of airports include the following: Emissions including primary NO2 Background concentrations Meteorology Near field dispersion proceses Chemical reactions


30 Contribution of different components of aircraft sources to annual average NO X concentrations at receptor LHR2