Sustainable Transport Indicators on Energy Efficiency and GHG Emissions
|
|
|
- Hollie Greer
- 5 years ago
- Views:
Transcription


1 2 nd Regional Workshop on Sustainable Transport Indicators 8 November, 2016 Kuala Lumpur, Malaysia Sustainable Transport Indicators on Energy Efficiency and GHG Emissions Sudhir Gota ASEAN-German Technical Cooperation Project Energy Efficiency and Climate Change Mitigation in the Land Transport Sector Page 1

2 How do we know if transport system in ASEAN is becoming sustainable or unsustainable? Ben Dumond (unsplash.com) Page 2


3 % of CO 2 Materials Production Distribution Warming water for hair wash Retailing / Disposal 5% 0.3% 2% 93% Excluded Page 3
4 Overview 1) Introduction - What are Indicators? 2) Why do we need Indicators? 3) ASEAN Transport Indicators on Energy Efficiency and GHG Emissions 4) Way Forward? Page 4
 Henrik Gudmunsson, DMU")
5 Indicator Pyramids (Data & Indicator) Henrik Gudmunsson, DMU Page 5
 PSUTA Page")
6 Indicator Pyramids (Data, Indicator & MRV) PSUTA Page 6

7 Indicator Pyramids : DPSIR Framework Page 7
8 Gold Standard of Indicators A good indicator should ideally meet the following standards: 1. The indicator is needed and useful. 2. The indicator has technical merit. 3. The indicator is fully defined. 4. It is feasible to measure the indicator. 5. The indicator has been field-tested or used operationally. 6. Weighted (relative importance in comparison to other indicators) 7. Comparable (quantified in all organizations in the same way) 8. Mutually exclusive and collectively exhaustive 9. Sensitive to the company s classified information 10. Easy to use if indicators are not selected carefully, they can consume extensive resources and generate data with little or no value Page 8

9 Indicator Cycle in Transport Page 9

10 International Processes & Indicators SLoCaT, ADB & Clean Air Asia Page 10

11 International Processes & Indicators SLoCaT, ADB & Clean Air Asia Page 11
NDCs")
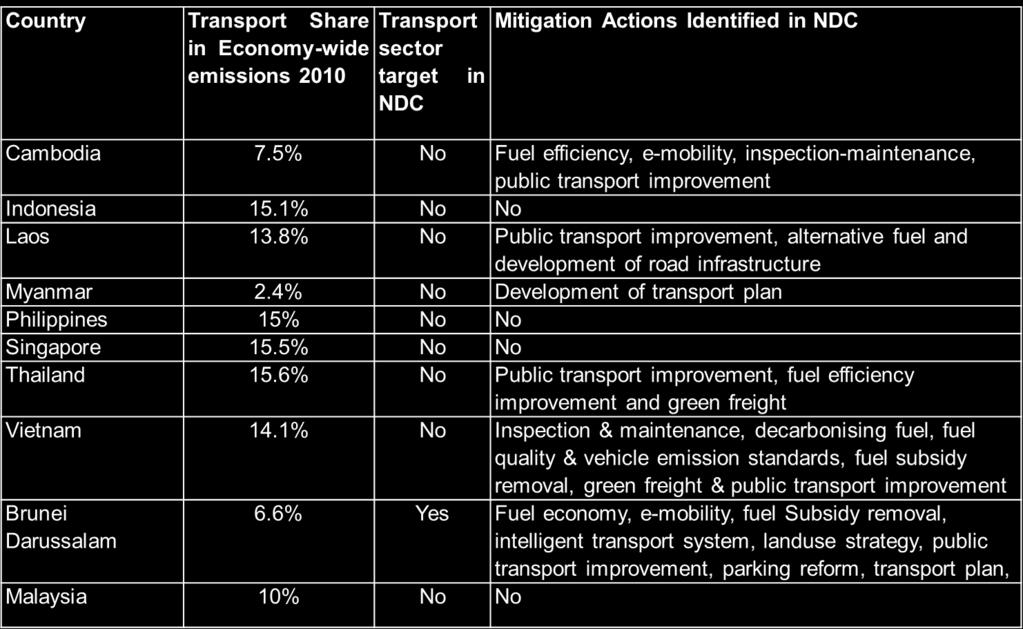
12 ASEAN (I)NDCs Page 12

13 Why Indicators? Page 13

14 Why Indicators? TERM Indicators Core Indicators TERM 01: Transport final energy consumption by mode TERM 02: Transport emissions of greenhouse gases TERM 03: Transport emissions of air pollutants TERM 04: Exceedances of air quality objectives due to traffic TERM 05: Exposure to, and annoyance by, traffic noise TERM 12a/b: Passenger transport volume and modal split TERM 13a/b: Freight transport volume and modal split TERM 20: Real change in transport prices by mode TERM 21: Fuel tax rates TERM 27: Energy efficiency and specific CO2 emissions TERM 31: Share of renewable energy in the transport sector TERM 34: Proportion of vehicle fleet by alternative fuel type. Supporting Indicators = 29 After 15 years of assessment, The importance of monitoring and the definition of targets against which progress can be measured has increasingly been recognised, as well as the role of proper ex-post evaluation of policies Page 14
NDCs While about 63% of NDCs propose transport sector mitigation measures; a much smaller share of NDCs (9%) have proposed a transport sector emission reduction target")
15 Why Indicators? (I)NDCs While about 63% of NDCs propose transport sector mitigation measures; a much smaller share of NDCs (9%) have proposed a transport sector emission reduction target For countries with transport emission targets, LCS scenario is very close to the actual transport emission reduction targets (less than 20% variation) Page 15

 Experts - Road transport")
16 Why Indicators? Air Pollution Mitigation Policies motor vehicle emissions were only responsible for less than 4 % of Beijing's PM2.5 - Chinese Academy of Sciences (CAS) Experts - Road transport contribution is 20-30% Transport of Beijing s and Climate PM Change 2.5 (TCC) Project Page 16
17 Why Indicators? - Malaysia Analysis of IEA and World Bank Data Page 17
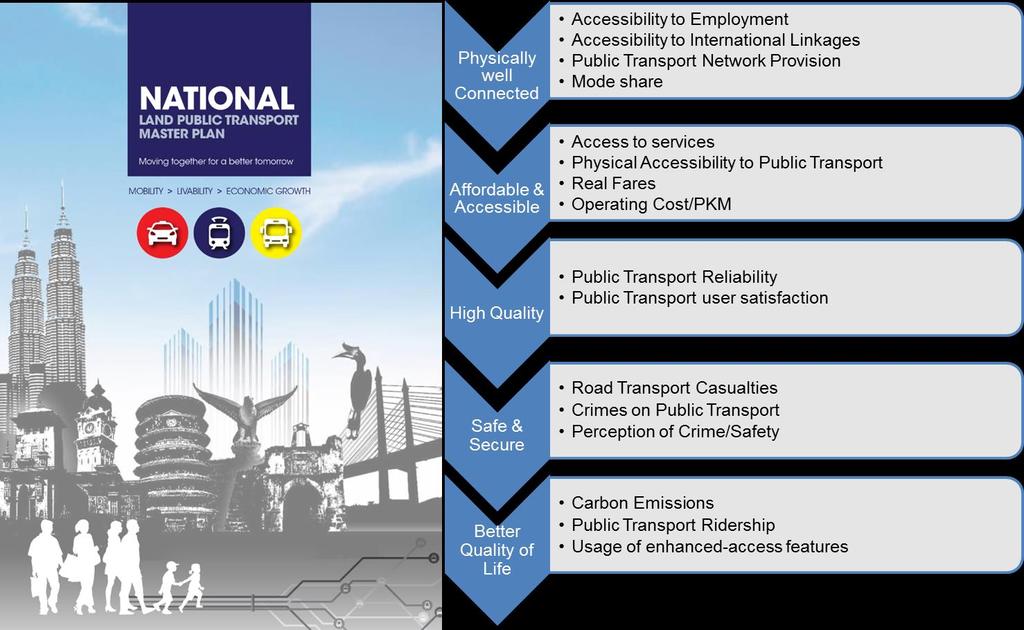

18 Why Indicators? - Malaysia Page 18

19 Why Indicators - Projects Additional Cost for developing health indicators = 0.02% of Total Cost Page 19
20 Good data are weapons in the hands of the ones which wants to change for a more sustainable future - Dr. Axel Friedrich Page 20

21 Kuala Lumpur Transport Strategic Plan Strategic Goal for Sustainable Transport Formulate a regional policy framework to support sustainable transport which includes low carbon modes of transport, energy efficiency and user-friendly transport initiatives, integration of transport and land use planning Activity The development of the monitoring framework and harmonized approach for indicators on energy and GHG emissions in the transport sector & Compile data on transport indicators Page 21

22 Indicators on Energy Efficiency & GHG Emissions Let us start with what we have Page 22


23 Indicators on Energy Efficiency & GHG Emissions Select indicators which perform multiple functions Page 23

24 Indicators on Energy Efficiency & GHG Emissions Page 24


25 Indicators on Energy Efficiency & GHG Emissions Page 25
26 Indicators - ASIF Framework Fuel Use and Emissions from Transport Total Transport Activity = A * S i * I i * F i,j Veh-km and pass-km by mode Emissions per unit of energy or volume or km from fuel J in mode I Technological energy efficiency Vehicle characteristics Occupancy/ Load Factor Vehicle fuel intensity Modal Energy Intensity Real drive cycles and routing, driver behavior Lee Schipper Page 26
27 Indicators - ASIF + DPSIR Framework Page 27
28 Indicators - ASIF + DPSIR Framework + Tiers Trip Purpose Operating Conditions Technology classification (Euro) Engine Size Fuel Split Mode Distribution Travel [Fleet, Distance travelled, Trips, Load Factor, Fuel efficiency and Speed] Tier 1 Tier 2 Page 28
29 Indicators Availability? Data Tier 1 (First Priority) Fuel sold Amount of Fuel Sold/consumed (liter/mj)fuel type in transport Total vehicle kilometre travel per population Transport Activity Freight Tonkm/GDP Passenger kilometre travel/gdp Energy Transport energy consumption per GDP GHG Emissions from transport sector segregated by modes GHG Emissions Transport GHG per capita Passenger GHG per PKM Freight GHG per TKM Air Pollutants PM Emissions from Transport Sector segregated by modes NOx Emissions from Transport Sector segregated by modes Fuel Type Proportion of vehicle fleet by alternative fuel type Share of renew able energy in total transport fuel consumption Road Accident Fatality/Million vehiclekm Accidents/Million vehiclekm Motorization Passenger and Freight Motorization Index ( vehicles/1000 population) Freight Rates Unit Price ($) per Tonkm for different modes Fuel Subsidy Fossil Fuel Subsidy/Unit of GDP Investment Transport Investments Climate Finance share Fleet Number of vehicles by vehicle registration type & fuel type Vehicle kilometre by vehicle type (in vkt) (mode & fuel) Distance Travelled Passenger Kilometre (pkm) (mode & fuel) Ton Kilometre (tkm) (mode & Fuel) Trips Total Number of Trips/Mode/Fuel type Load Factor Average Occupancy (No of persons/vehicle) (by mode & fuel type) Average Loading (Tons/Vehicle) (by mode & fuel type) Fuel Efficiency Fuel Efficiency (kmpl or L/100km or MJ/km) (by mode & fuel type) Speed Speed by mode/fuel type Emission Factor Emission factors for air pollutants in g/km per vehicle/fuel type Population No of inhabitants Economic GDP/Capita or GDP Infrastructure Km of Infrastructure ASEAN Availability Page 29

30 Indicators on Energy Efficiency & GHG Emissions Page 30

31 Indicators on Energy Efficiency & GHG Emissions Page 31

32 Indicators on Energy Efficiency & GHG Emissions Page 32
33 Questions? Page 33
34 Way Forward (indicator) 1 Hour Page 34
35 Vehicle Registration? Passenger Kilometer & Freight Kilometer travel (annual) by modes? Average Vehicle Kilometer Travel by vehicle & fuel type/year Fuel efficiency by mode & fuel type? Fuel consumption in transport? Average Occupancy and Loading? Is this data collected and reported? Who collects or should collect this data (all relevant stakeholders) How do you collect this data? What are the challenges in collecting/reportin g this data? What support is required? Page 35
36 1. In Different countries, different ministries collect data in different ways 2. Certain modes (bus, taxi, freight) have better data 3. Data is collected at different frequency 4. Institutionalised vs project based approach 5. Data estimated but not surveyed 6. Accessibility is a challenge 7. Funds for surveys 8. Sharing data among ministries is a challenge 9. Big data/gps/easy ways of collecting data 10.Guidance on data collection and definition Page 36
37 Way Forward (ASEAN) Page 37
38 Objective of the 2 nd Regional Workshop on Sustainable Transport Indicators The main objectives are: Presentation and discussion of background paper for Sustainable Transport Indicators in the ASEAN. (ST-2.3.1) Discussion on what elements should be included in the development of guidelines and monitoring framework for sustainable transport indicators. (ST-2.3.2) Discussion of how key data/indicators collection and MRV exercises can support tracking progress towards sustainable transport by partner countries. (ST-2.3.3) Page 38

39 Way Forward AJTP Example What data should be compiled? - Data necessary for making policy (94 indicators) How to collect data? - Through Focal point /Annual meeting Quality control? - Triple check by ASEAN Sec., focal point and Japan - 2 Focal point in respective AMSs to collect and check data What frequency? - Update once a year - Time series data from 2004 Page 39

40 Way Forward ADB BTD Example Website Model Status Report Projections and Benchmarking Future? Page 40

41 Way Forward Standardised Templates? Page 41
42 Way Forward Surveys Example Urban Freight Loading- Unloading Survey Traffic Counts Shippers Survey Road side Interviews Establishment Survey Service Provider Survey GPS Survey Vehicle Observation Survey Axle Load Survey Commodity Flow Survey Infrastructure Survey Vehicle Trip Diary Parking Survey Driver Survey Freight Operator Survey Page 42
43 Number of Transport GHG Methodologies & Tools Implemented by Way Forward Capacity Building SLoCaT Partnership has compiled a detailed qualitative assessment of 110 transport greenhouse gas (GHG) emission methodologies and tools - 55% of these tools available free of charge 20 0 SLoCaT <=1990 Page 43
44 ASEAN Action Plan for indicators on Energy and GHG emissions in the transport sector Sharing Mechanism? Stakeholders? Stakeholder Consultation Capacity Improvemen t/training Background Document Energy Efficiency and GHG Indicators Collect Baseline Data Guidance Document Open Access? Output? - Website/ status report? Long term Sustainability? Establish Working Group Funding? Page 44
45 Thank You!! Page 45
46 As a federal enterprise, GIZ supports the German Government in achieving its objectives in the field of international cooperation for sustainable development. Published by Deutsche Gesellschaft für Internationale Zusammenarbeit (GIZ) GmbH Registered offices, Bonn and Eschborn, Germany Energy Efficiency and Climate Change Mitigation in the Land Transport Sector in the ASEAN Region c/o Office of Transport and Traffic Policy and Planning 35 Rama 6 Road, Thung Phaya Thai, Ratchathewi, Bangkok T F E tali.trigg@giz.de I Responsible Tali Trigg Author(s) Sudhir Gota (Sudhirgota@gmail.com) Photo credits GIZ Layout GIZ In cooperation with Page 46