Impact of climate change on the Scheldt river basin. Prof. dr. ir. Patrick Willems KU Leuven Dept. Civil Engineering Hydraulics section
|
|
|
- Elfrieda Ford
- 5 years ago
- Views:
Transcription


1 Impact of climate change on the Scheldt river basin Prof. dr. ir. Patrick Willems KU Leuven Dept. Civil Engineering Hydraulics section

2 Anthropogenic climate change
3 Historical trend in temperature! Global temperature rise :
4 Historical trend in temperature! Annual temperature anomaly at Uccle, Belgium (ref: period ): MIRA Klimaatrapport 2015 Over waargenomen en nog verwachte klimaatveranderingen, Vlaamse Milieumaatschappij i.s.m. KU Leuven, VITO en KMI, september 2015


5 Historical trend in rainfall extremes? Worldwide unique dataset: RMI, Uccle, 10-minutes rainfall measurements since 1898
, (2013).")
6 Historical trend in rainfall extremes Uccle rain gauge (Brussels): 10-minutes rainfall extremes since 1898: s s 1960s : WINTER s s : SUMMER Willems, P. (2013), (2013). Multidecadal Adjustment of oscillatory extreme rainfall behaviour statistics of rainfall accounting extremes for in multidecadal Europe, climate oscillations, Climatic Journal of Change, Hydrology, 120(4), 490,
7 Historical trend in rainfall extremes Uccle rain gauge (Brussels): 10-minutes rainfall extremes since 1898: Past 10 years Rainfall statistics: past 100 years


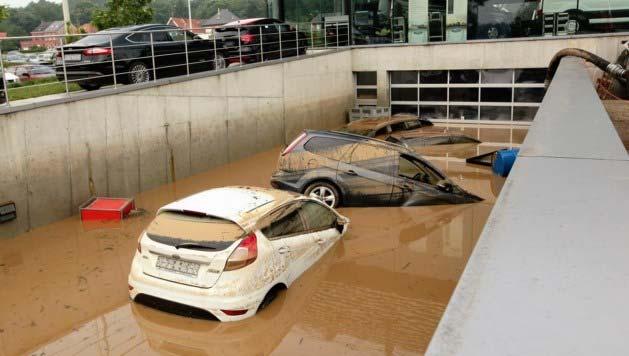


8 Belgium, 27 May 6 June 2016:
9 Extreme rainfall May July 2016:
10 Future climate trends??


11 Climate scenarios GCMs Large ensemble: CMIP5 RCMs Reduced ensemble: EURO-CORDEX Statistical downscaling incl. bias correction LAMs Climate scenarios local impact models Ntegeka, V., Baguis, P., Roulin, E., Willems, P. (2014), Developing tailored climate change scenarios for hydrological impact assessments, Journal of Hydrology, 508C,
12 RCP greenhouse gas scenarios 2015 RCP 8.5 Rising radiative forcing pathway leading to 8.5 W/m² in 2100 RCP 6 Stabilization without overshoot pathway to 6 W/m² at stabilization after 2100 RCP 4.5 Stabilization without overshoot pathway to 4.5 W/m² at stabilization after 2100 RCP 2.6 (RCP3-PD Peak in radiative forcing at 2.6 W/m² before 2100 and decline Figure: Peters et al.
 for Uccle:")
: Change in mean monthly")
")
13 Climate scenarios >200 GCMs CMIP5 (RCP based) for Uccle: change for 100 years (2000 -> 2100): Change in mean monthly temperature: Strong increase in temperature (mainly in summer) Current climate
14 Climate scenarios >200 GCMs CMIP5 (RCP based) for Uccle: change for 100 years (2000 -> 2100): Change in annual number of heat waves:
 for Uccle: change for")


15 Climate scenarios >200 GCMs CMIP5 (RCP based) for Uccle: change for 100 years (2000 -> 2100): Change in mean monthly rainfall: Winter: increase in rainfall Summer: strong decrease in rainfall Current climate
 for Uccle:")
: Change in number of wet")

16 Climate scenarios >200 GCMs CMIP5 (RCP based) for Uccle: change for 100 years (2000 -> 2100): Change in number of wet days: Summer: strong decrease in number of rainy days Current climate
 for Uccle:")
: Change in rainfall")

17 Climate scenarios >200 GCMs CMIP5 (RCP based) for Uccle: change for 100 years (2000 -> 2100): Change in rainfall intensity for 20-year storm: Increase in extreme rainfall intensities Current climate


18 Impact climate scenarios Increase of greenhouse gasses in atmosphere Temperature rise Saturation concentration of air vapour increases
 for Uccle: change for 100 years")


19 Climate scenarios >200 GCMs CMIP5 (RCP based) for Uccle: change for 100 years (2000 -> 2100): Change in monthly potential evapotranspiration: Strong increase in potential evapotranspiration (mainly in summer, less in spring) Current climate


20 Impact of climate scenarios Increased peak rainfall intensities : more floods Longer dry periods : lower water availability
 for")
:")

21 Climate scenarios >200 GCMs CMIP5 (RCP based) for Uccle: change for 100 years (2000 -> 2100): Change in wind speed: Small change in wind speed Current climate
22 Climate change impacts on Scheldt river basin?
, Actualisatie van de extreme-waarden-statistiek van stormvloeden aan de Belgische kust, KU Leuven - Afdeling Hydraulica, Rapport voor de Vlaamse Overheid WL & Afdeling Kust, okt.")
23 Sea level rise Water level Belgian Coast since 1925: Willems (2015) 1.7 to 4 mm/year since 1927 ± 20cm in 100 years extrapolation till 2100: +20cm to +100cm (-> 200cm) Willems P. (2014), Actualisatie van de extreme-waarden-statistiek van stormvloeden aan de Belgische kust, KU Leuven - Afdeling Hydraulica, Rapport voor de Vlaamse Overheid WL & Afdeling Kust, okt. 2014
24 Sea level rise Water level Belgian Coast since future sea level rise: 1.7 to 4 mm/year since 1927 ± 20cm in 100 years extrapolation till 2100: +20cm to +100cm (-> 200cm) Willems P. (2014), Actualisatie van de extreme-waarden-statistiek van stormvloeden aan de Belgische kust, KU Leuven - Afdeling Hydraulica, Rapport voor de Vlaamse Overheid WL & Afdeling Kust, okt Weisse, R., Bellafiore, D., Menendez, M., Mendez, F., Nicholls, R., Umgiesser, G., Willems, P. (2014), Changing extreme sea levels along European coasts, Coastal Engineering, 87, 4-14


25 Sea level rise Revision Sigma-Plan ( ): +60 cm Return period first flooding Scheldt between Gent and Vlissingen: Current climate, after installation of 13th controlled floodplain first Sigma-Plan (Kruibeke- Bazel-Rupelmonde = 600 ha): 350 years After 60cm sea level rise and no further actions: 25 years ±4000 ha additional floodplains required: ±4000 years Optimal revised Sigma-Plan (after cost-benefit analysis: 1325 ha, 656 ha by km dike level increases + wall Antwerp) Monbaliu, J., et al., Nicholls, R.J., Ohle, N., Schuster, D., Sothmann, J., Willems, P. (2014), Risk assessment of estuaries under climate change: lessons from Western Europe, Coastal Engineering, 87, 32-49


26 River discharges upstream in basin In WINTER: Current climate till 2100: Rainfall increase: 0 to +60% Temperature and evap. increase: +1.5 to 4 C Increase river peak flows till +35% larger rivers till > +100% small rivers Vansteenkiste, Th., Tavakoli, M., Ntegeka, V., De Smedt, F., Batelaan, O., Pereira, F., Willems, P. (2014), Intercomparison of hydrological in climate scenario impact projections, Journal of Hydrology, 519,

, water quality, ecology Decreasing low flows Tabari, H., Taye, M.T., Willems, P.")
27 River discharges upstream in basin In SUMMER: Current climate till 2100: Rainfall decrease: 0 to -60% Decrease in number of wet days: 0 to -50% Temperature and evap. increase: +2 to 9 C Decrease in low flows: between -30% and -70% Reduced water availability (drinking water, industrial water, irrigation, navigation), water quality, ecology Decreasing low flows Tabari, H., Taye, M.T., Willems, P. (2015), Water availability change in central Belgium for the late 21th century, Global and Planetary Change, 131,

 50% reduction in upstream river discharges: mean salinity concentration from 2.42 g/l to 3.")
28 River discharges upstream in basin In SUMMER: Current climate till 2100: Rainfall decrease: 0 to -60% Decrease in number of wet days: 0 to -50% Temperature and evap. increase: +2 to 9 C Canal Gent-Terneuzen: Treaty with The Netherlands: limiting the salt intrusion (min. 13 m 3 /s averaged over 2 months) 50% reduction in upstream river discharges: mean salinity concentration from 2.42 g/l to 3.72g/l; but no systematic increase? Flushing flows required in winter!? How many? With which frequency?


29 River discharges upstream in basin In SUMMER: Current climate till 2100: Rainfall decrease: 0 to -60% Decrease in number of wet days: 0 to -50% Temperature and evap. increase: +2 to 9 C Dry-out Cumulative rainfall deficit: Annual rainfall deficit: up to 230 mm (for comparison: 1976 = 285 mm deficit )
30 Dry-out & lower water availability Scheldt basin is highly vulnerable for drier summers and lower water availability! Mean water availability is very limited in Flanders and Brussels: 1480 m 3 /(person.year) International standards: <2000 very low water availability <1000 severe water shortage Reasons: High population density Only limited fraction of available surface waters from local rainfall Also/hence: Highly dependent on neighbouring regions (e.g. France) Also: Strong urbanization trend, strong increase in paved surfaces: increased and fastened surface runoff, reduced infiltration Strong drainage by agriculture
, Effecten van de klimaatverandering op de laagwaterproblematiek van de Maas, 20 jaar")
31 Water supply water transfer naar Vlaanderen Willems, P. (2015), Effecten van de klimaatverandering op de laagwaterproblematiek van de Maas, 20 jaar Maasafvoerverdrag, Riemst, 23 november 2015


32 Impacts on water availability Groundwater depletion Study prof. K. Walravens U.Gent: Groundwater head levels in deep Sokkel aquifer reduced with more than 140 m i.c.w. the natural state Groundwater abstractions needs to be reduced to 25 % of the abstractions anno 2000 to avoid further depletion and to restore on the longer term (50 years)

.")

33 Extreme rainfall intensities In SUMMER: Current climate till 2100: 20-year rainfall intensity: till +50% Cities (e.g. Antwerp): Factor 2 10 increase in frequency urban pluvial floods Willems, P. (2013). Revision of urban drainage design rules after assessment of climate change impacts on precipitation extremes at Uccle, Belgium, Journal of Hydrology, 496,


34 Heat island effect in cities City of Antwerp, VITO Willems, P., De Niel, J., Tabari, H., Modellering en beleidsaanbevelingen ten aanzien van neerslag in Antwerpen, KU Leuven voor Stad Antwerpen, september 2015

35 Rainfall extremes, 5 year, 15 min: Current climate Future climate, high climate scenario Willems, P., De Niel, J., Tabari, H., Modellering en beleidsaanbevelingen ten aanzien van neerslag in Antwerpen, KU Leuven voor Stad Antwerpen, september 2015
36 More hydrological extremes River floods Droughts / Low flows / Water scarcity! Sewer floods!

37 Also: Increase in urbanization Vulnerability to climate change increases because of pavement increase Increase in build-up areas and pavements: 1976 Flanders and Brussels: 1976: 4 5% paved : 9 10% paved PhD Lien Poelmans, KU Leuven, 2010
38 Also: Increase in urbanization Vulnerability to climate change increases because of pavement increase Increase in build-up areas and pavements: 1976 Flanders and Brussels: 1976: 4 5% paved 2050 business-as-usual 2050: ±20% paved betonstop PhD Lien Poelmans, KU Leuven, 2010

39 Also: Increase in urbanization Vulnerability to climate change increases because of pavement increase % built-up area economic globalization scenario:

, The relative impact of climate change and urban expansion on river flows: a case study in")
40 Also: Increase in urbanization Vulnerability to climate change increases because of pavement increase Increase in build-up areas and pavements: Reduced infiltration and groundwater recharge: Poelmans, L., Van Rompaey, A., Ntegeka, V., Willems, P. (2011), The relative impact of climate change and urban expansion on river flows: a case study in central Belgium, Hydrological Processes, 25(18),
 Net effect climate scenarios: crop losses except for winter and spring crops")
: heat stress, decrease food intake reduced production (high climate scenario: sheep 9%, 8% cattle, pigs 6%, 3% poultry) VLM & VITO Gobin et al. & Vanuytrecht et al.")
41 Impacts on agriculture Agriculture, fruit and horticulture: Temperature rise: reduced potential yield Decrease soil water availability: reduced crop growth Elevated CO2 levels: positive influence because of increased water productivity (increased yield for same water availability) Net effect climate scenarios: crop losses except for winter and spring crops (20 30% increase in yield & biomass) Positive effect: less schimmels, ziekten and plagen because of less wet soils Animal production: Increased exceedance critical sense temperature (dry air, 30 C): heat stress, decrease food intake reduced production (high climate scenario: sheep 9%, 8% cattle, pigs 6%, 3% poultry) VLM & VITO Gobin et al. & Vanuytrecht et al. (2013)
:")
42 Impact of higher temperatures More heat waves: Buildings: higher heat stress for houses, schools, hospitals Energy: higher needs for energy to cool buildings, but lower cooling water availability Fires: more verges, forest and heath fires Health: more human diseases and deaths, mainly for elder people; less human deaths due to warmer winters Wetenschappelijk Instituut Volksgezondheid (2015): Impacts heat wave 2013:

43 Impact of higher temperatures More heat waves: Buildings: higher heat stress for houses, schools, hospitals Energy: higher needs for energy to cool buildings, but lower cooling water availability Fires: more verges, forest and heath fires Health: more human diseases and deaths, mainly for elder people; less human deaths due to warmer winters Also: more plagues of insects, changing vegetation, changing species,
 Also reduced ozone decay because of reduced")
44 Impact of higher temperatures Reduced air quality: Air temperature rise, drier summers and changes in atmospheric circulation: Higher ozone concentrations (up to 20% in summer, up to 10% in winter; higher close to busy roads and the city center; increase in number of episodes where the EU standard of PM10 < 180 µg/m3 will be violated by 50% to 400%) Also reduced ozone decay because of reduced NOx emissions Higher fine dust particle concentrations (up to +16% increase in summer, no change in winter) Source: VITO, Lauweat et al., 2014 Change in ozone concentrations by 2030 for the RCP4.5 scenario per season (spring, summer, autumn, winter)

; invasion of invasive and exotic species (mullet, JD-dory, Pacific oyster,.")
: o o o change biomass higher trophic levels change breeding opportunity birds change composition whole ecosystem Changing water levels and currents, leading to coastal erosion, changes in")
45 Impacts on nature and ecosystems Temperature rise and decrease in average summer precipitation: more trees will die: reduction of wood areas 18 species of breeding birds and 16 species of butterflies, including some common species are at increased risk of disappearing by 2100 from Flanders new breeding birds and butterfly species can settle in Flanders Coastal aquatic biological life: Temperature rise (and effects respiration, metabolism speed, growth, reproduction...): o o o Shift in types: benthic species to shift north or farther from the coast (sole, plaice, cod,...); invasion of invasive and exotic species (mullet, JD-dory, Pacific oyster,...) Decrease in available nutrients in upper water layer: drop phytoplankton dynamics Increase potentially harmful algal blooms Increase in CO2 concentration (and acceleration photosynthesis primary production): o o o change biomass higher trophic levels change breeding opportunity birds change composition whole ecosystem Changing water levels and currents, leading to coastal erosion, changes in clarity of the coastal waters, hence changes in the available light + Changes in influx of river discharges o o changes in habitats, physiological effects coastal animals and plant species CLIMAR changes in food chain of ecosystems, movements northwards of some fish types, related economical impacts (fisheries, tourism) next to ecological impacts
46 Impact climate scenarios Caution must be exercised when interpreting climate change scenarios Order of magnitude of uncertainty assessed by ensemble approach with several: future greenhouse gas emission scenarios GCMs (global scale climate model physics) RCMs (regional scale climate model physics) initial states of the climate models statistical downscaling assumptions and methods + real uncertainty is larger: models share the same level of process understanding and sometimes even the same parameterization schemes and code Whatever methods are adopted: resulting change should not be interpreted as an exact number but only as indicative of the expected magnitude of future change
47 Climate Perturbation Tool Perturbs historical series to high/mean/low climate scenarios Time scales: daily, hourly, 10-minutes Based on quantile perturbations: o change in rain storm frequency and rain storm intensity o dependent on return period and season Time horizons till 2030, 2050,, 2100 Wet day frequency perturbation Wet day intensity perturbation Combined perturbation Daily Hourly 10min High = Wet Time series Month i Month i Month i Time series Mean = Mild Low = Dry
48 Impact climate scenarios: how to deal with the high uncertainties? The large uncertainties that currently exist should not be an argument for delaying climate change impact investigations or adaptation actions! for High climate scenario Risk = Probability * Consequence high? very high Precautionary principle: take pessimistic scenario into account take climate insurance
49 Take climate scenarios into account when / for which impacts are high! Avoid that such climate scenarios become real (MITIGATION) Look for solutions (ADAPTATION), but take large uncertainties into account! Sustainable solutions: that are effective for all climate scenarios (e.g. source control) Flexible/adaptable solutions: account for the potential need for future adjustments depending on the real climate trends Avoid closing off options (reversibility) Follow-up of future trends (observations, climate research) Active learning, public debate <-> traditional engineering approach, which is rather static and is often based on design rules set by engineering communities recognize that flexibility is required as understanding increases


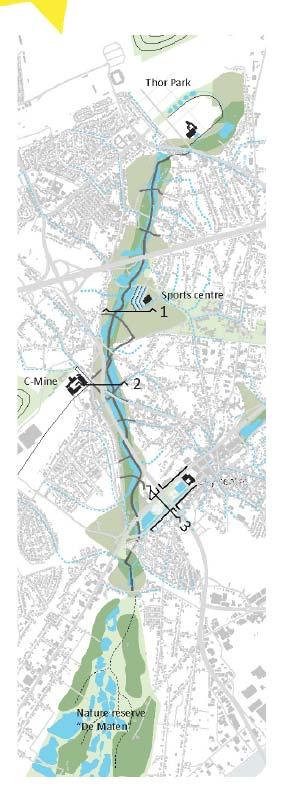


50 Sustainable resilient water management: Green-blue macro-networks Better integration of water in spatial planning

 Space to the river / restoration natural")


51 Sustainable resilient water management: Green-blue macro-networks Better integration of water in spatial planning Rain water storage at the source (source control) Space to the river / restoration natural floodplains Integrated solution for pluvial & fluvial flood problems Multiple functions given to green-blue space: o Recreation o Ecological connections o Green as buffer against heat stress o Surface water treatment o Groundwater infiltration and storage


52 Sustainable urban water management: More local-upstream storage & infiltration Upstream pavement / drainage -> downstream flooding


53 Sustainable urban water management: More local-upstream storage & infiltration Green and blue replacing grey : permeable pavements and (front)gardens Individual infiltration: : rain water storage and re-use


54 Example of sustainable solutions in urban water management sector : source control! RIONED 2009
 in the city: RIONED 2009 Campus Park, Clichy sous Bois [Composante Urbaine, 2004] De Vleeschauwer, K.")
, Green - blue water in the city: quantification of impact of source control versus end-of-pipe solutions on sewer and")
55 Sustainable urban water management: More local-upstream storage and infiltration Improved interfacing between urban water management and spatial planning / urban design: Multiple functions to open spaces (e.g. parks) in the city: RIONED 2009 Campus Park, Clichy sous Bois [Composante Urbaine, 2004] De Vleeschauwer, K., et al. P. (2014), Green - blue water in the city: quantification of impact of source control versus end-of-pipe solutions on sewer and river floods, Water Science and Technology, 70.11,


56 Advanced control of rivers, reservoirs, hydraulic structures, Model Predictive Control flood control reservoirs Pumps against water losses at sluices Upstream flow control, e.g. flushing against salt intrusion Canal Gent-Terneuzen Water supply reservoirs


57 Preparedness + increase of self-coping capacity

58 Climate adaptation Illustratie: Linda van Os 58


59 Future challenges for the Scheldt basin! Increase the resilience More frequent extreme weather events due to climate change
60 Risks induced by climate change Climate scenarios for Belgium & impacts on hydrological extremes: