Hydrologic and Water Quality Monitoring on Turkey Creek Watershed, Francis Marion National Forest, SC
|
|
|
- Winfred Bertram Wood
- 5 years ago
- Views:
Transcription


1 Hydrologic and Water Quality Monitoring on Turkey Creek Watershed, Francis Marion National Forest, SC D.M. Amatya, T.J. Callahan, A. Radecki-Pawlik, P. Drews, and W.F. Hansen A South Carolina Water Resources Conference Presentation October 15, 2008, North Charleston, SC


2 RATIONALE FRANCIS MARION NATIONAL FOREST, SC Cooper River Santee Experimental Forest 1938 Wildland-Urban Interface Turkey Creek Charleston National Forest Private Lands

3 HYDROLOGIC MONITORING Establishment of a weather station in st, 2 nd & 3 rd order watersheds: All monitoring discontinued in st & 2 nd order watersheds back in 1989 (Hugo) GW wells and a Full weather station: With growing concerns on water quantity/quality 3 rd order Turkey Creek watershed was also revitalized in 2004 with the establishment of a real time gauging station by USGS/CofC/FS Evaluating impacts, Developing new hypotheses and models for land use/climate change, restoration, ecosystem functions/values.
4 GOAL & OBJECTIVE To build a strong multi-cooperative research partnership for a comprehensive long-term monitoring effort on this coastal forested watershed as a baseline reference system to address the critical issues of sustainable water management To summarize results of recent collaborative monitoring and modeling studies on hydrology and water quality

")


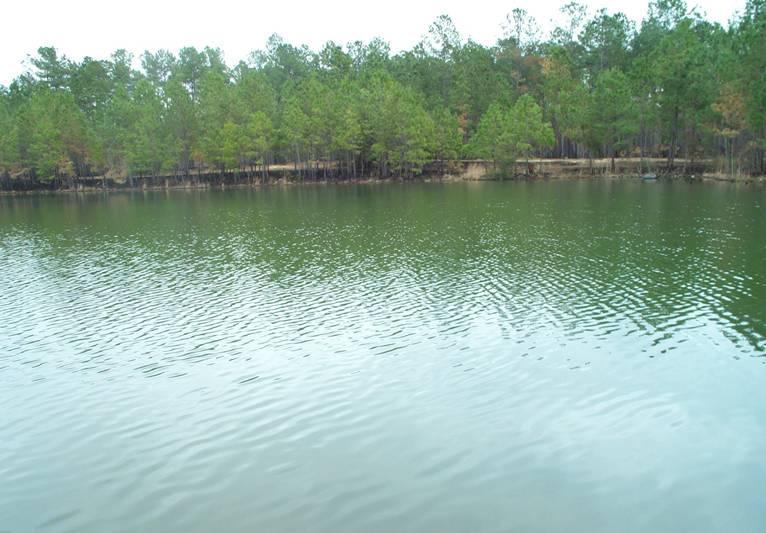
5 TURKEY CREEK WATERSHED WS80 WS79 7,250 ha (72.5 km 2 ) Using SWAT-DEM FMNF, Typical of LCP 97% Forests Shallow soils 6.7 km 2 water/wetlands 3 rd order stream 9.8 km stream length 3.6 m to 14 m a.m.s.l.

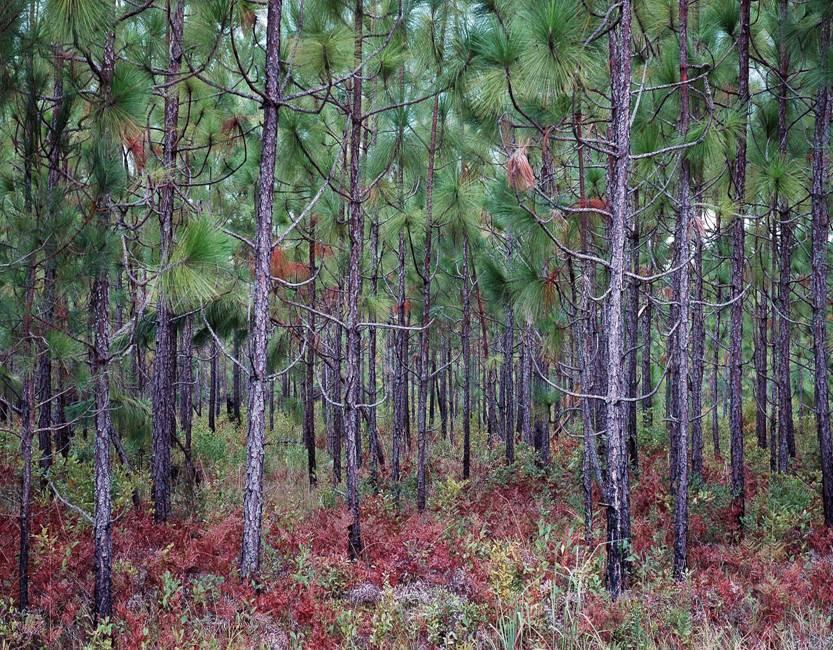
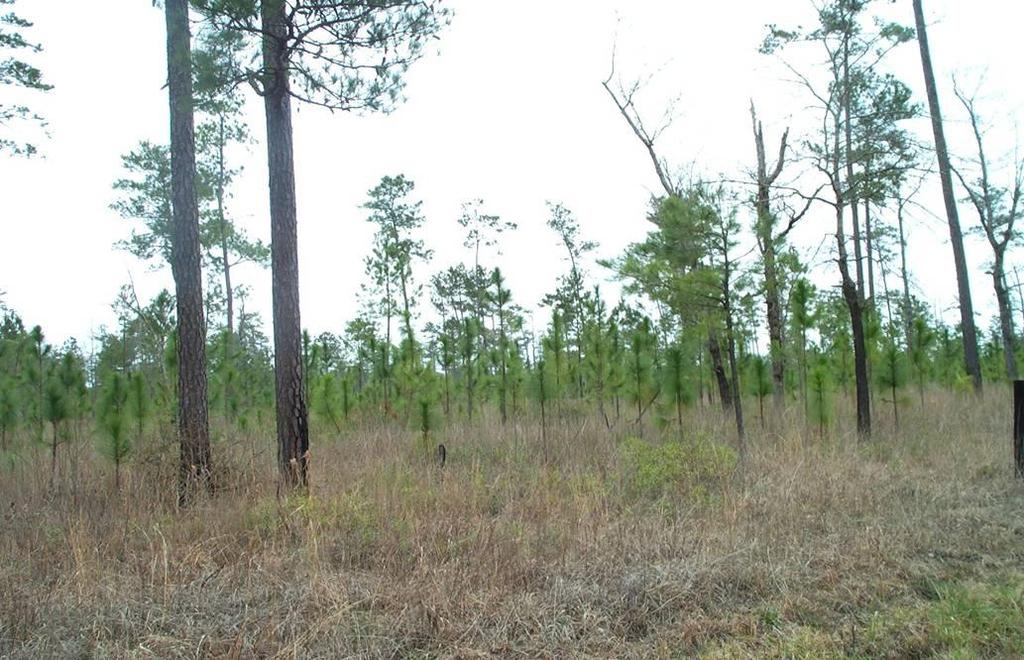


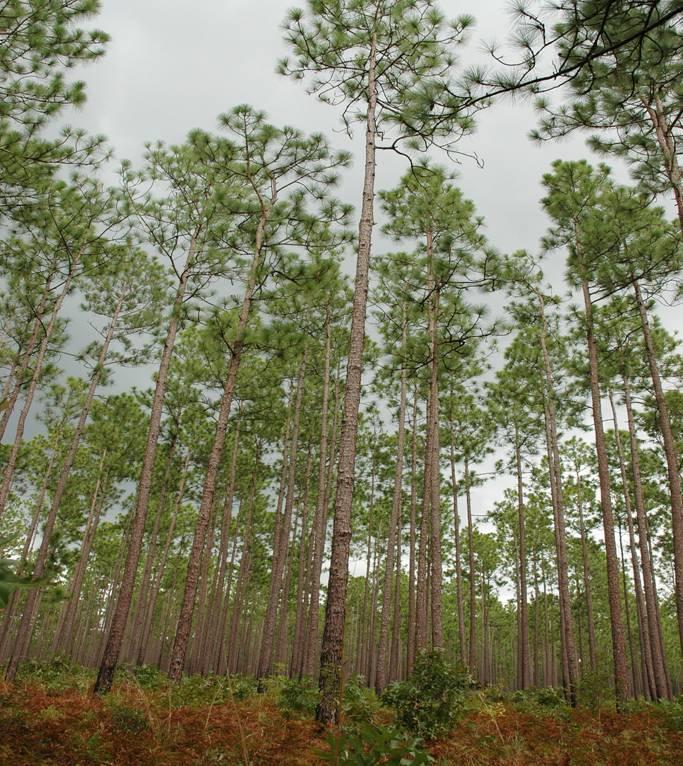
6 Pine & Hardwood Stands


 Shallow")
 Deep")
 Water quality:")
")
7 Current Monitoring Stream flow: 2005 (USGS, CofC) Rainfall: 2005 (USGS, CofC, and FS) Complete weather: 2005 (FS) Shallow groundwater: 2006 (FMNF, FS) Deep groundwater: 2005 (CofC) Water quality: 2006 (FS) J Erbland & W Spingfield (USGS) and A Harrison & A Edwards (FS)
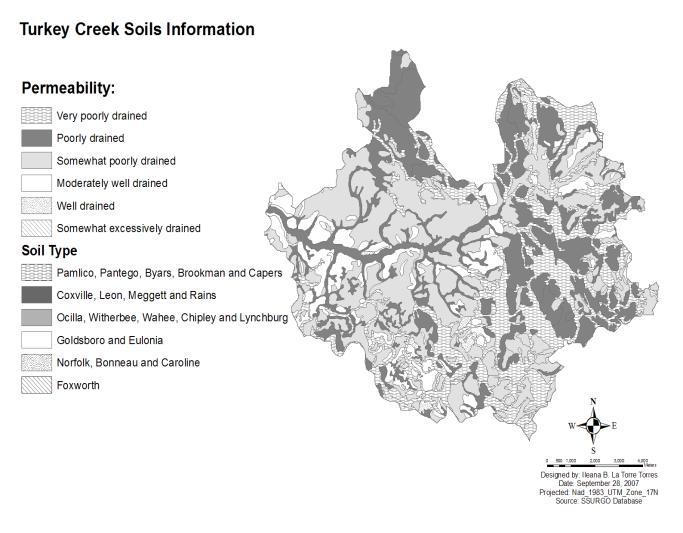
 2005 NAIP Imagery Land use from 2005 NAIP Imagery NRCS SSURGO and FMNF")
8 Spatial Data Historic aerial photographs 1999 Satellite Image 2005 USGS DEM (10mx10m) 2005 NAIP Imagery Land use from 2005 NAIP Imagery NRCS SSURGO and FMNF Soil Maps
9 MONITORING RESULTS
10 Rainfall, mm 2500 Santee HQ Annual Rainfall, Average Annual rainfall = 1370 mm Increase in annual rainfall in 61 yrs = 45 mm y = x Year
11 Temp, deg C Santee HQ Annual Average Temperature, Mean Annual Temperature = 18.4 o C Rise in Temperature in 61 yrs = 0.13 o C y = x Year

12 (Amatya and Trettin, 2007)
13 Average Increase in Outflow, % 80 Increase in % Outflow vs % Forest Removal (Amatya and Trettin, 2007) % (+ 174 mm outflow) 41% (+ 147 mm outflow) a. Turner (1991) b. LU (2003) Non-Forested area, %
;")


14 Average Annual Water Balance Rainfall = 1320 mm ( ); 898 mm (2007); 1851 mm (1964) Temperature = 18.4 o C Potential ET = 1050 mm Actual ET = ~ 970 mm Water Yield = 336 mm = 24 x10 6 cu.m. R/O Coefficient = 25% Ground water =????
15 Comparison of Runoff (Amatya and Radecki-Pawlik, 2007) 45% 40% 35% 30% 25% 20% 15% 10% 5% 0% P e r c e n t a g e R u n o f f /R a in f a ll: W S 7 8 ( h a ) W S 7 9 (5 0 0 h a ) W S 8 0 (2 0 6 h a )
16 Daily Flow, mm Comparison of Flow Duration Data (Amatya and Radecki-Pawlik, 2007) Percent of time flow exceeded WS 78 WS 79 WS 80
17 Runoff (mm) Runoff (mm) Seasonal Rainfall-Runoff Relationships Dry Period y = 0.13x R 2 = 0.20; p=0.05 (La Torres, 2008; SC Sea Grant) Wet Period y = 0.24x R 2 = 0.70; p= Rainfall (mm) Very much dependent upon antecedent moisture conditions Rainfall (mm)
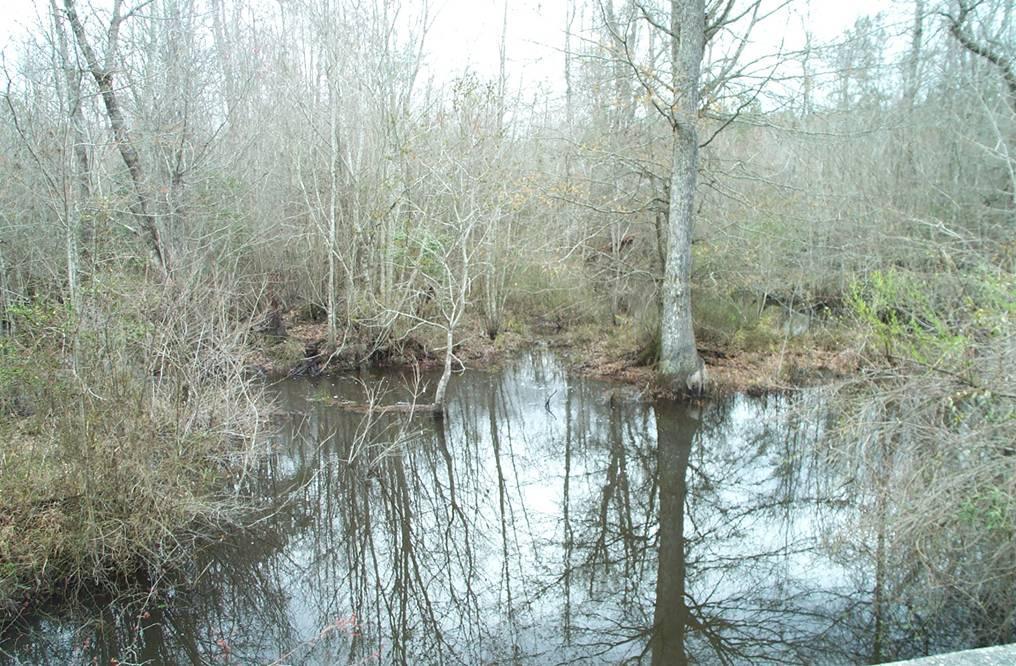
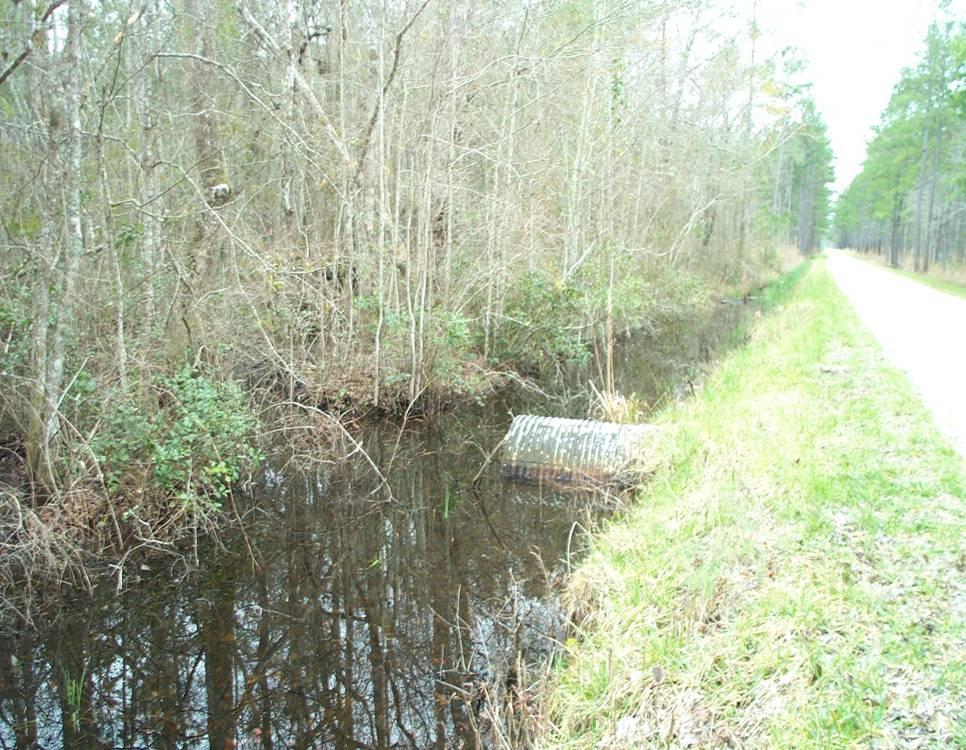
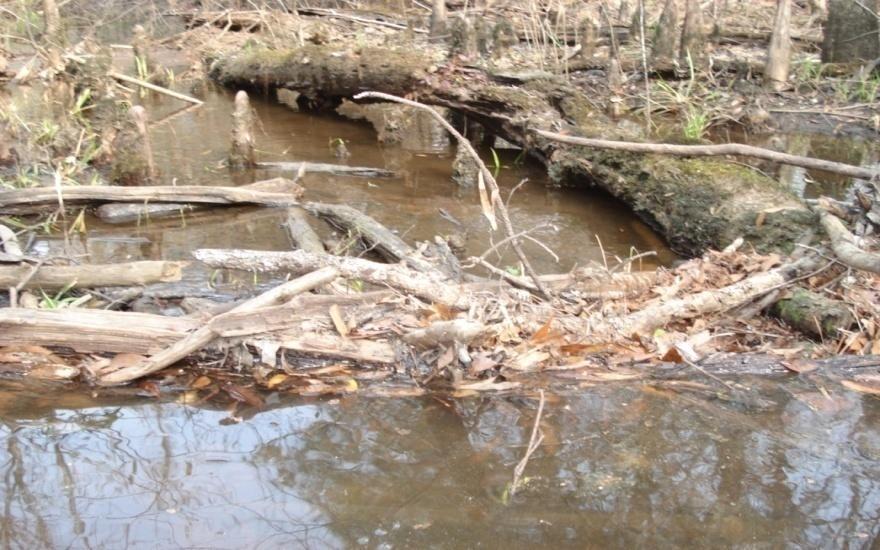
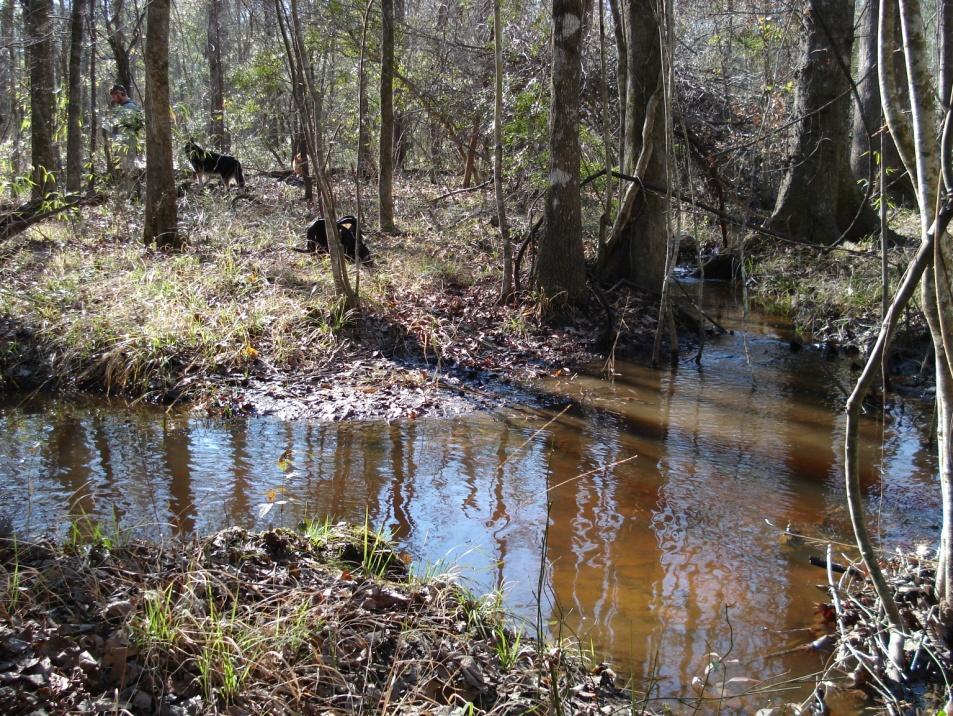
18 Tributaries, Road Crossings and Water Features (Haley, 2007)
19 Stream Field Mapping (Haley, 2007)
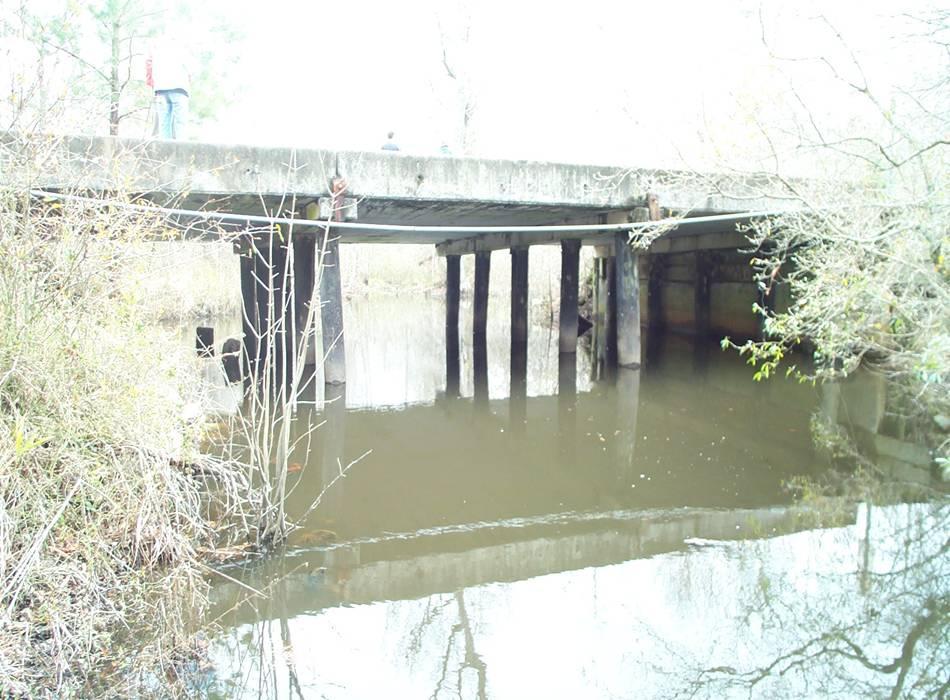
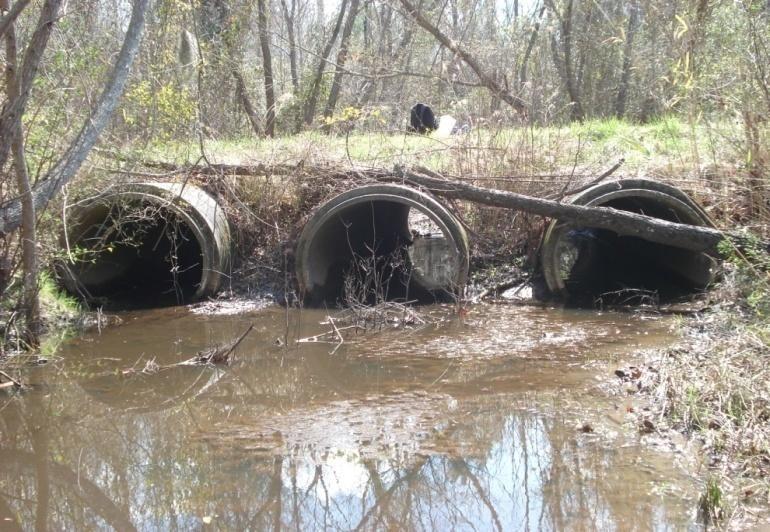
20 Hydraulics of Culverts & Bridges (Radecki-Pawlik et al 2008) Point Name Type/Amount Width or Diameter f/ m Height f/ m Length f/ m Condition Discharge cfs/ cms 4 Culvert Metal/1 2.75/ / Good 21.54/ Culvert Metal/1 1.50/ / 8.21 Good 3.53/ Culvert Concrete/1 1.50/ / 8.66 Good 4.24/ Culvert Metal/1 2.83/ / 3.64 Poor 22.60/ Culvert Metal/1 2/ / 9.12 Good 8.12/ Culvert Metal/1 0.83/ / 8.21 Poor 0.71/ Culvert Concrete/1 1/ / 6.38 Poor 1.06/ Culvert Metal/2 2/ / good/ 1 poor 9.89/ Culvert Concrete/1 3.25/ / Good 39.55/ Culvert Concrete/1 1.58/ / 8.51 Good but beginning to degrade 4.59/ Culvert Concrete/1 2.5/ / Poor- filled in with debris 18.36/ Culvert Metal/1 1.25/ / 6.67 Fair-partially 2.12/ 0.06 bent 47 Culvert Metal/1 1.5/ / 6.99 Poor 3.53/ Culvert Concrete/1 4/ / Good 55.08/ Culvert Metal/1 2.5/ / Good 15.54/ Culvert Concrete/1 1.33/ / 6.99 Poor 2.82/ Culvert Concrete/1 1.67/ / 8.51 Good 6.00/ Culvert Concrete/1 1.25/ / 6.08 Good 3.50/ 0.01
 Turkey")
21 (Amoah, 2008) Turkey Creek
22 MODELING RESULTS using SWAT (Soil & Water Assessment Tool, USD ARS)

23 Streamflow (mm) Measured/Predicted Monthly Outflows (Calibration) & 2007 (Validation) (Amatya et al, 2008) Measured Simulated R 2 = 0.78; E = 0.74 R 2 = 0.98; E = Jan-05 Mar-05 May-05 Jul-05 Sep-05 Nov-05 Jan-06 Mar-06 May-06 Jul-06 Sep-06 Nov-06 Jan-07 Mar-07 May-07 Jul-07 Sep-07 Nov-07
24 Streamflow (mm) Measured & SWAT Predicted Annual Streamflow for (Amatya et al, 2008) 400 Measured Simulated Jan & Jun-Jul not included in Average


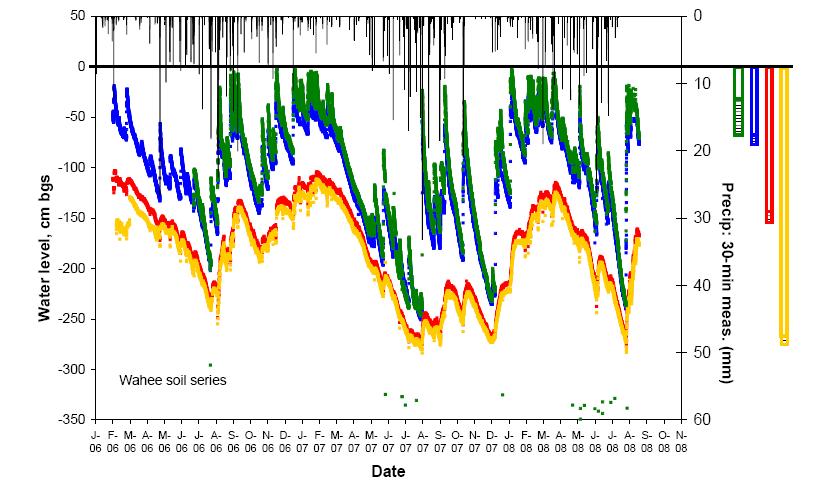
25 WATER TABLE MONITORING ( ) Ongoing Surfaceubsurface water Interaction study CofC scientists & Grads
26 Parameters Physical Parameters Apr 06 Oct 08 NUTRIENT CONCENTRATIONS Nov 05 May 07 (Needs updates) Temperature, DO and ph for Mar Oct Apr Nov-07 1-Jun Dec-08 Date Temperature DO ph Concentration, mg L Total N NH4-N NO3-N DIN DON Total P Nutrient, mg L -1
27 SUMMARY Historic ( ) and current data since 2005 A baseline information on hydrology and water quality of a typical lower coastal plain watershed. Stream flow dynamics, Rainfall-runoff relationships & mechanisms, water balance components and water quality were described for the forest reference system. SWAT hydrologic model was successfully calibrated for predicting daily and monthly flows. These hydrologic/water quality data together with the calibrated model SWAT can be useful for evaluating impacts of development, urbanization, land use and climate change and extreme events. Site and Data are available for sharing with cooperators and partners


28 NEXT STEPS Expand/Strengthen collaborative efforts Obtain LIDAR data for accurate assessments Expand additional monitoring e.g. nested catchments, WQ parameters like Hg, coliform bacteria, sediment etc. Study surface-subsurface water interaction Study runoff generation mechanism Evaluate scenarios of land use and climate change using SWAT model


29 COOPERATORS FS Southern Research Station National Council for Air & Stream Improvement, Inc. FS Francis Marion National Forest US Geological Survey College of Charleston JJ&G Company/ Tetra-Tech, Inc. SC Department of Transportation University of Krakow, Poland Florida A& M University SC Sea Grants Program Clemson University THANK YOU!!!