OCEANOGRAPHY Chapter 13
|
|
|
- Derick Garrett
- 5 years ago
- Views:
Transcription

1 OCEANOGRAPHY Chapter 13 Biological Productivity and Energy Transfer part 3: Regional Productivity Energy and Nutrients in Marine Ecosystems, Fisheries Notes from the textbook, integrated with original contributions Alessandro Grippo, Ph.D. Shallow tropical waters: carbonate banks, oolitic limestones, low primary productivity Atlantic Ocean between Florida, U.S.A, and the Bahamas Alessandro Grippo
2 How Does Regional Primary Productivity Vary? Productivity in the ocean is not constant, but varies dramatically from place to place Productivity is measured in weight of carbon in grams (gc) per unit of area (square meters), per unit of time (year) Values range from 1 gc/m 2 /year to 4000 gc/m 2 /year based on: Uneven distribution of nutrients Changes in availability of sunlight
3 A biological pump Overall, 90% of biomass from euphotic zone decomposes before descending below it The remaining 10% sinks to deeper water where about 9% is decomposed The remaining 1% reaches the ocean floor and accumulates there This removal of organic mater from the euphotic zone is called a biological pump
4 Why is that removal called a biological pump? The sinking to the ocean bottom of 1% of the organic matter produced in the euphotic zone pumps CO 2 and the nutrients from the surface to the bottom waters and sea floor sediments If those substances cannot come back to the surface, nutrients cannot be resupplied to the sunlit euphotic zone
5 Water mixing, the thermocline and the pycnocline If a thermocline (and, as a consequence, a pycnocline) exists (warmer waters at the surface, colder at depth), mixing cannot occur and nutrients remain at the ocean bottom In tropical waters, the thermocline is always present In temperate waters, the thermocline is seasonal In polar waters the thermocline is absent
 productivity follows Example: Arctic Ocean s")
6 Polar Ocean Productivity Winter darkness Summer sunlight Phytoplankton (diatoms) bloom Zooplankton (mainly small crustaceans) productivity follows Example: Arctic Ocean s Barents Sea

7 Polar Ocean Productivity Antarctic productivity slightly greater than Arctic North Atlantic Deep Water upwells near Antarctica Productivity decreases from UV radiation ozone hole

8 Polar Ocean Productivity Isothermal waters Mixing can occur but in summer it is limited by melting of ice Plankton remains at surface Blue whales migration timings are set on feeding during maximum zooplankton productivity
 Opposite of what happens in polar waters where lack of light limits")
9 Productivity in Tropical Oceans A permanent thermocline is a barrier to vertical mixing Low rate of primary productivity Caused by lack of nutrients (cannot be recycled to the surface) Opposite of what happens in polar waters where lack of light limits productivity
10 Productivity in Tropical Oceans Generally, primary production in tropical ocean occurs at a steady but rather low rate Exceptions, where primary productivity is high in tropical oceans, occur in areas of Equatorial upwelling Coastal upwelling Coral reefs Symbiotic algae Recycle nutrients within the ecosystem 2011 Pearson Education, Inc.
11 Temperate Ocean Productivity Productivity limited by both Available sunlight Available nutrients
12 Temperate Ocean Productivity Highly seasonal pattern Winter low Many nutrients, little sunlight Spring high Spring bloom Summer low Few nutrients, abundant sunlight Fall high Fall bloom

13 Temperate Ocean Seasonal Cycle

14 Comparison of Global Productivities
15 How Are Energy and Nutrients Passed Along in Marine Ecosystems? Definitions Biotic community assemblage of organisms in a definable area or habitat Ecosystem biotic community plus environment The energy flow in marine photosynthetic ecosystems is unidirectional based on a continuous solar energy input

16 Energy Flow in Marine Systems
17 Energy Flow in Marine Systems Three categories of organisms: Producers Nourish themselves with photosynthesis or chemosynthesis Autotrophic Consumers Eat other organisms Herbivores eat plants Carnivores eat other animals Omnivores eat plants and animals Bacteriovores eat bacteria Heterotrophic Decomposers Break down dead organisms or waste

18 Nutrient Flow in Marine Ecosystems: Biogeochemical cycling
19 Oceanic Feeding Relationships As producers make food available to consuming animals, said food passes from one feeding population to the next On average, only 10% of the energy taken in at any level is passed on to the next Energy is consumed and lost, mostly as heat As a consequence, the biomass of producers in the ocean is many times greater than that of the top consumers
20 Feeding Strategies For most marine animals, getting food takes most of their time Suspension feeding or filter feeding Take in seawater and filter out usable organic matter Deposit feeding Take in detritus and sediment and extract usable organic matter Carnivorous feeding Capture and eat other animals
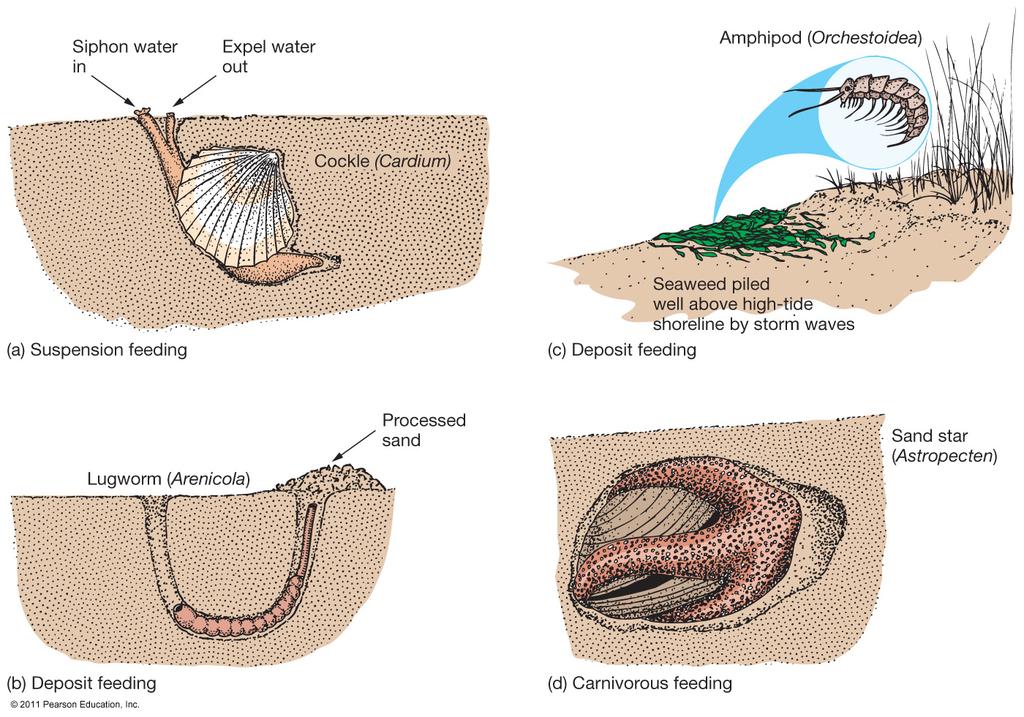
21 Feeding Strategies
22 Trophic Levels Trophic levels are the different feeding stages within a community: Diatoms make food, eaten by zooplankton, eaten by carnivores, eaten by big carnivores, and so on Chemical energy (from the Sun) is transferred from producers to consumers The transfer of energy between trophic levels is a continuous flow of energy Small-scale recycling, storage, use for internal heat dissipate some energy (entropy increases)
23 Transfer of energy Transfer of energy is very inefficient about 10% of energy transferred to next trophic level From algae to zooplankton can be down to 2% Gross ecological efficiency Ratio, at any trophic level, of energy passed on to the next higher trophic level, divided by the energy received by the trophic level below

24 Trophic Levels

25 Ecosystem Energy Flow and Efficiency
26 Food Chains, Food Webs, and the Biomass Pyramid Loss of energy between feeding levels limits the number of feeding populations in ecosystems If there were too many levels, not enough energy would be available to support higher and higher trophic levels In addition, each feeding population must necessarily have less mass than the population it eats Individuals of a feeding population are, as a result, bigger in size and less numerous than their prey
27 Food Chains vs. Food Webs A food chain is a sequence of organisms through which energy is transferred A food web is a more complex system of food chains If animals feed through a food web rather than a food chain, they are more likely to survive
28 Food Chains Primary producer Herbivore One or more carnivores
29 ! Branching network of many consumers! Consumers more likely to survive with alternative food sources Food Webs

30 Biomass Pyramid The number of individuals and total biomass decreases at successive trophic levels. Organisms increase in size.
31 What Issues Affect Marine Fisheries? Humans have used the sea as a source of food for a long time Fisheries (fish caught from the ocean by commercial fishers) have provided food fro billions of people Marine resources provided 20% of protein intake for people overall

32 Marine Ecosystems and Fisheries Most fisheries is drawn from continental shelves Over 20% come from areas of upwelling, areas that make up only 0.1% of ocean surface area
33 Overfishing Fisheries harvest from a population s standing stock the mass present in the ecosystem at any given time Overfishing Occurs when the fish stock is harvested too rapidly, and juveniles are not sexually mature to reproduce Reduction in Maximum Sustainable Yield (MSY) Maximum amount of fish biomass that can be removed yearly form a stock and still allow a population to be sustained indefinitely
34 Exploitation Status of Marine Fish

35 Overfishing 80% of available fish stock fully exploited, overexploited, or depleted/recovering Large predatory fish reduced Increased fish production, decreased stocks
36 Incidental Catch or Bycatch Non-commercial species are taken incidentally by commercial fishers. Bycatch may be up to 8 times more than the intended catch. Birds, turtles, dolphins, sharks Tuna and dolphins swim together Caught in purse seine net Marine Mammals Protection Act addendum for dolphins Driftnets or gill nets banned in 1989

37 Purse Seine Net
38 Fisheries Management Regulate fishing Conflicting interests Human employment Self-sustaining marine ecosystems International waters Enforcement difficult

39 Fisheries Management Many large fishing vessels Governments subsidize fishing 1995 world fishing fleet spent $124 billion to catch $70 billion worth of fish
40 Fisheries Management Northwest Atlantic Fisheries such as Grand Banks and Georges Bank Canada and United States restrict fishing and enforce bans Some fish stocks in North Atlantic rebounding Other fish stocks still in decline (e.g., cod)

41 Fisheries Management Effectiveness
42 Fisheries Management Consumer choices in seafood Consume and purchase seafood from healthy, thriving fisheries Examples: farmed seafood, Alaska salmon Ecosystem-based fishery management Avoid overfished or depleted seafood Examples: tuna, shark, shrimp

43 Seafood Choices
44 Biological Productivity and Energy Transfer part 3: Regional Productivity Energy and Nutrients in Marine Ecosystems, Fisheries The end