8.0 - WATER MANAGEMENT STRATEGY
|
|
|
- Chester Milo Evans
- 5 years ago
- Views:
Transcription
1 8. - WATER MANAGEMENT STRATEGY 8.1 POTENTIAL IMPACTS The project has the potential to adversely affect water quality and flow frequency in the downstream receiving waters of Horse Creek. Such adverse impacts could arise due to the following examples: Uncontrolled or controlled releases of mine affected water into the downstream receiving waters from discharge points within the mine site Uncontrolled release of sediments washing into the downstream receiving waters during storm events Changes in the flow frequency and volume of passing flows due to interception of water within the MLA areas Scour/erosion of poorly rehabilitated areas Flooding of mine pits due to overtopping of flood control levees 8.2 WATER MANAGEMENT MITIGATION MEASURES The most effective means of managing the potential impacts of any land disturbance associated with the proposed mining activity is to prevent excessive scour/erosion by controlling sediment movement at its source and by retaining any mine affected water within the MLA. The overarching philosophy of the water management strategy prepared for the Elimatta Coal Mine, is to minimise any adverse impacts to the surrounding environment, throughout the entire 3 year life of the coal mine. This goal is to be achieved by the adoption of a comprehensive best practice approach to the management of all water over the Elimatta Coal Mine Development site, comprising MLA 5254, MLA 527 and MLA WATER MANAGEMENT STRATEGY OVER THE SOUTHERN MLA 5254 Over the southern MLA 5254, where all of the mining will actually occur, the following best practice management approaches have been incorporated into the water management strategy: 1. Minimise the impact on downstream watercourses by limiting the area to be disturbed at any one time. This will be achieved by careful mine stage planning, which minimises the footprint of the overall disturbed landform and in particular the footprint of the operating pits. 2. Capture all saline groundwater intercepted by the mine pits and prevent the unauthorised discharge of saline water into the Horse Creek receiving waters. In particular, three large environmental dams (EV1, EV2 and EV3) will be located throughout the southern Elimatta MLA 5254, to receive saline groundwater pumped from the operating mine pits. 3. Provision of separate clean water and contaminated water drainage systems to minimise the overall volume of contaminated water on site. Provision of diversion Document : JBT24-RPT6C-WaterManagementStrategy.docx PAGE 166
2 drains and bunds to prevent clean water from draining into hazardous dams and sediment dams, thereby reducing the size of dams required on site. 4. Progressive and timing reinstatement of the disturbed landform. As the front of the mined pit advances, waste spoil overburden material and coarse rejects will be progressively placed back into the already worked pit void. The landforms of the spoil material placed back into the pit void will be shaped and reinstated in a timely manner and the batter slopes of all disturbed surfaces will be worked along the contour to minimise the likelihood of scour down the batter face. 5. The finished surface slopes of the re-shaped landforms will be ultimately graded to allow for natural runoff to freely drain into the Horse Creek receiving waters. 6. Prior to the establishment of a stable vegetative cover, runoff from the re-graded, but disturbed spoil landforms will be intercepted by localised diversion drains and runoff will be directed into sediment basins, to prevent the discharge of sediment laden turbid waters into the Horse Creek receiving waters. In particular, three large sediment dams (SD1, SD2 and SD3) will be located throughout the southern Elimatta MLA 5254, to capture sediment laden runoff from proposed spoil dumps adjacent to the north pit, the west pit and the east pit. 7. Rehabilitation and revegetation of disturbed landforms will be undertaken as soon as is practical. Once landforms have developed a stable vegetative cover, the localised diversion channels can be decommissioned and runoff from the rehabilitated catchment slopes will freely drain into the Horse Creek watercourse. 8. Minimise the risk of discharge of highly saline waters to the Horse Creek receiving waters by permitting the release of water stored in the environmental dams, the sediment dams and the raw water dams throughout the Elimatta MLAs, only in accordance with DEHP s criteria for the discharge of mine affected water from coal mines in the Fitzroy Basin. 9. Minimise the risk of discharge of highly saline waters to the Horse Creek receiving waters by appropriately sizing the environmental dams, sediment dams and raw water dams throughout the Elimatta MLAs, to strictly limit the frequency and magnitude of uncontrolled overflows from the dams into the receiving waters. 1. On site re-use and re-cycling of water shall be occur as standard operating procedure. The water captured in the Elimatta water management system shall be used to satisfy on site water demands arising due to potable water demands, coal washing demands in the CHPP and dust suppression demands. Use of the captured on site water shall be prioritised such that the higher salinity water is used in the first instance. This will reduce the likelihood of uncontrolled overflows of highly saline water to the Horse Creek receiving waters, by lowering stored water levels in the various storage dams. 11. Interference of natural catchments shall be avoided at all times. However, in some cases where natural catchments shall be unavoidably affected by the proposed mining activities and where the catchment boundaries are largely contained within the extent of the MLAs, interception of those natural catchments will be permitted. In such instances, the duration of the interference shall be minimised to enable the timely restoration of the natural drainage behaviour. Document : JBT24-RPT6C-WaterManagementStrategy.docx PAGE 167
3 8.2.2 WATER MANAGEMENT STRATEGY OVER THE NORTHERN MLAS 527 AND 5271 Over the northern MLA 527, where all of the mine infrastructure will be located, the following best practice management approaches have been incorporated into the water management strategy: 1. Capture all contaminated runoff associated with the MIA and prevent the unauthorised discharge of highly saline water into the Horse Creek receiving waters. In particular, a large environmental dam (EV4) will be located in the northern Elimatta MLA 527, to capture contaminated runoff from the MIA catchments. 2. Ensure that the tailings dams are appropriately sized to accommodate the expected volume of fine tailings output from the CHPP and to also minimise the frequency and magnitude of uncontrolled overflows into the Horse Creek receiving waters, at all times throughout the life of the tailings dams. 3. Ensure that local sediment dams are provided along the route of the haul road linking the southern MLA with northern MLA, to prevent the discharge of sediment laden runoff from disturbed areas into the Horse Creek receiving waters. Road runoff may also pick up spilled coal product along the route of the transport corridor. 8.3 MINE STAGING As noted in Section 2.5.1, Minserve Pty Ltd have developed the proposed mine staging plans for the Elimatta Coal Mine, for mine years,, 1, 2, 3, 5, 8, 1, 15, 2, 25 and 3. Year 3 is the end of mining and represents the final landform for the mined areas. Sections through provide a detailed description of the proposed changes to the layout of the mine site at each snap shot in time through the mine s life. The proposed changes to the mine s layout will also affect the layout of the proposed Elimatta Coal Mine water management system. In particular, the water management system will need to evolve to successfully cater to the changed landforms arising due to the changes in the mine staging plans. Table 8-1 : Summary of Water Management System Changes Over the Mine Life Mine Staging Year Water Management Infrastructure Required at Mine Staging Year 1 3 Raw water dam RW1 to be constructed External water supply to be constructed North pit and east pit commence operations Environmental dams EV1, EV2 and EV4 to be constructed Tailings dams TDN and TDS to be constructed Sediment dams SD1, SD2 and SD3 to be constructed West pit commences operations Environmental dam EV3 to be constructed Raw water dams RW2 and RW4 to be constructed Document : JBT24-RPT6C-WaterManagementStrategy.docx PAGE 168
4 Mine Staging Year Water Management Infrastructure Required at Mine Staging Year 5 Raw water dam RW3 to be constructed 6 1 Tailings dam TDN reaches capacity and is decommissioned Fine tailings to be pumped to Tailings dam TDS Tailings dam TDS reaches capacity and is decommissioned North pit ceases mining operations Fine tailings to be pumped to north pit (Tailings dam TDP) Environmental dam EV1 is decommissioned 2 Raw water dam RW3 is decommissioned 3 Raw water dam RW2 is decommissioned Raw water dam RW4 is decommissioned Section describes how the changes to the water management system, arising due to the changes in the mine layouts documented in the mine staging plans, were represented in the GoldSim WSBM simulations undertaken for the project. Section 9.6 describes how the anticipated water usage demands over the mine site are expected to change as a result of changes to the mine layouts documented in the mine staging plans. Section 9.13 describes how the anticipated groundwater seepage inflows to the operating pits are expected to change as a result of changes to the mine layouts documented in the mine staging plans. Section 9.15 describes how the mine pits are expected to change as a result of changes to the mine layouts documented in the mine staging plans. Section 9.16 describes how the water storage dams are expected to change as a result of changes to the mine layouts documented in the mine staging plans. 8.4 OPERATIONAL WATER USAGE POTABLE WATER USAGE The predicted potable water usage for the has been calculated by determining the anticipated water usage associated with the following items: Consumption by mine staff (including all staff associated with administration, operations, CHPP, MARC trades, capital works, shut down and visitors) Consumption by accommodation village staff Bath house usage by mine staff Wash down of heavy and light vehicles Wash down of the MIA Document : JBT24-RPT6C-WaterManagementStrategy.docx PAGE 169
5 Estimates of staffing levels throughout the operational phase of the Elimatta Coal Mine were provided by Northern Energy Corporation Ltd. Estimates of vehicle wash down requirements were based on the mine size and on the number of vehicles expected to be operating on the mine site, throughout the mine s life span. The following Table 8-2 presents the calculated potable water usage requirements for the, for mine staging years 1 through the end of mining in year 3. As noted in this table, the calculated water usage varies depending on the mine staging year, however the variation is minor and only affects mine years 1 to 3. This variation in water usage is driven by the expected changes to the staffing levels during mine years 1 to 3, primarily involving the mine operations staff and trade staff. After mine year 5, the staffing levels will remain static and hence potable water demands will also remain static for the remainder of the mine s life. The maximum calculated potable water usage from Table 8-2 is 9 ML/a. The potable water requirements will be entirely supplied by raw water dam RW1, which is located in the northern Elimatta MLA 527. Raw water dam RW1 will receive the entire external water supply to the Elimatta mine site. As noted in Section 8.6, the quality of the water in raw water dam RW1 is expected to be quite good, and the median TDS of the external supply source will be in the order of 2 mg/l (Electrical Conductivity EC of 3 µs/cm). Table 8-2 : Calculated Potable Water Usage Demands Item Year 1 Water Usage Demands Year 3 Water Usage Demands Year 5 Water Usage Demands Year 8 Water Usage Demands Year 1 Water Usage Demands Year 15 Water Usage Demands Year 2 Water Usage Demands Year 25 Water Usage Demands Year 3 Water Usage Demands Potable Water Usage at Mine and Accomodation Village Mine Admin Staff on site 53 No 53 No 53 No 53 No 53 No 53 No 53 No 53 No 53 No Mine visitors 5 No 5 No 5 No 5 No 5 No 5 No 5 No 5 No 5 No Accomodation Village Operators 9 No 9 No 9 No 9 No 9 No 9 No 9 No 9 No 9 No Mine Operations staff 71 No 18 No 88 No 88 No 88 No 88 No 88 No 88 No 88 No CHPP Operations staff 8 No 15 No 15 No 15 No 15 No 15 No 15 No 15 No 15 No MARC trades and staff 36 No 5 No 41 No 41 No 41 No 41 No 41 No 41 No 41 No CHPP shut down staff 2 No 4 No 4 No 4 No 4 No 4 No 4 No 4 No 4 No Capital works staff 57 No 12 No 12 No 12 No 12 No 12 No 12 No 12 No 12 No Less off site staff -14 No -19 No -17 No -17 No -17 No -17 No -17 No -17 No -17 No Total staff on site Staff Contingency (Fraction) 15 % 15 % 15 % 15 % 15 % 15 % 15 % 15 % 15 % Total staff on site (with contingency) 282 No 314 No 283 No 283 No 283 No 283 No 283 No 283 No 283 No Accommodation Village Water Demand Rate 24 L/cap/d 24 L/cap/d 24 L/cap/d 24 L/cap/d 24 L/cap/d 24 L/cap/d 24 L/cap/d 24 L/cap/d 24 L/cap/d Administration and CHPP Staff Water Demand Rate 55 L/cap/d 55 L/cap/d 55 L/cap/d 55 L/cap/d 55 L/cap/d 55 L/cap/d 55 L/cap/d 55 L/cap/d 55 L/cap/d Bathhouse Water Demand Rate 15 L/cap/d 15 L/cap/d 15 L/cap/d 15 L/cap/d 15 L/cap/d 15 L/cap/d 15 L/cap/d 15 L/cap/d 15 L/cap/d Staff Using Bathhouse (Fraction) 2 % 2 % 2 % 2 % 2 % 2 % 2 % 2 % 2 % Water Demand Administration and CHPP Staff 4 KL/d 5 KL/d 5 KL/d 5 KL/d 5 KL/d 5 KL/d 5 KL/d 5 KL/d 5 KL/d Water Demand Bathhouse 8 KL/d 9 KL/d 8 KL/d 8 KL/d 8 KL/d 8 KL/d 8 KL/d 8 KL/d 8 KL/d Water Demand Accomodation Village 68 KL/d 75 KL/d 68 KL/d 68 KL/d 68 KL/d 68 KL/d 68 KL/d 68 KL/d 68 KL/d TOTAL Water Demand Accommodation & Mine 8 KL/d 89 KL/d 81 KL/d 81 KL/d 81 KL/d 81 KL/d 81 KL/d 81 KL/d 81 KL/d TOTAL Water Demand Accommodation & Mine 29 ML/a 33 ML/a 3 ML/a 3 ML/a 3 ML/a 3 ML/a 3 ML/a 3 ML/a 3 ML/a Wash Down Heavy Vehicle (3 min L/min - 3/day) 122 KL/d 122 KL/d 122 KL/d 122 KL/d 122 KL/d 122 KL/d 122 KL/d 122 KL/d 122 KL/d Wash Down Light Vehicle (1 min 12 L/min - 2/day) 24 KL/d 24 KL/d 24 KL/d 24 KL/d 24 KL/d 24 KL/d 24 KL/d 24 KL/d 24 KL/d Wash Down MIA General (5 min 12 L/min - 2/day) 12 KL/d 12 KL/d 12 KL/d 12 KL/d 12 KL/d 12 KL/d 12 KL/d 12 KL/d 12 KL/d TOTAL Wash Down Demand 158 KL/d 158 KL/d 158 KL/d 158 KL/d 158 KL/d 158 KL/d 158 KL/d 158 KL/d 158 KL/d TOTAL Wash Down Demand 58 ML/a 58 ML/a 58 ML/a 58 ML/a 58 ML/a 58 ML/a 58 ML/a 58 ML/a 58 ML/a TOTAL Potable Water Demand 87 ML/a 9 ML/a 87 ML/a 87 ML/a 87 ML/a 87 ML/a 87 ML/a 87 ML/a 87 ML/a TOTAL Potable Water Demand 87 ML/a 9 ML/a 87 ML/a 87 ML/a 87 ML/a 87 ML/a 87 ML/a 87 ML/a 87 ML/a.24 ML/d.25 ML/d.24 ML/d.24 ML/d.24 ML/d.24 ML/d.24 ML/d.24 ML/d.24 ML/d 2.8 L/s 2.9 L/s 2.8 L/s 2.8 L/s 2.8 L/s 2.8 L/s 2.8 L/s 2.8 L/s 2.8 L/s Document : JBT24-RPT6C-WaterManagementStrategy.docx PAGE 17
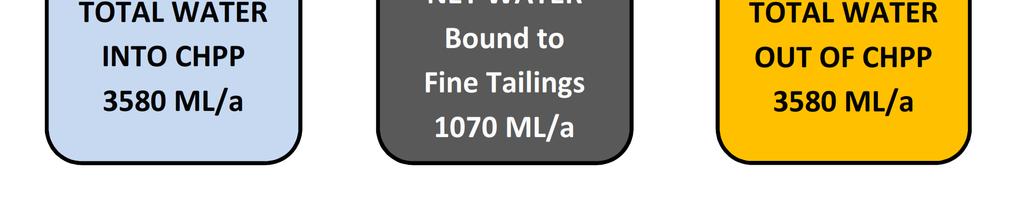
6 8.4.2 CHPP WATER USAGE The predicted overall water usage rates in the Coal Handling and Preparation Plant (CHPP) for the, were provided by Northern Energy Corporation Ltd. The water usage figures were determined assuming a CHPP throughput of 7.75 million tonnes of ROM coal annually. The CHPP water usage calculations were based on a simple water balance through the CHPP, taking into consideration the water contributions from the following component sources: Water input to the CHPP via the ROM coal feed moisture content Water input to the CHPP via fine tailings return water Water input the CHPP as make up water to address water deficits Water output from the CHPP via the product coal moisture content Water output from the CHPP via the coarse rejects moisture content Water output from the CHPP via the fine tailings rejects moisture content Water losses from the CHPP, arising due the plant s washing efficiency Figure 8.1 presents a simple schematic of the annual water balance calculated for the Elimatta Coal Mine CHPP, as provided by Northern Energy Corporation Ltd. Document : JBT24-RPT6C-WaterManagementStrategy.docx PAGE 171


7 Figure 8.1 : Water Balance Schematic of the Elimatta Coal Mine CHPP Document : JBT24-RPT6C-WaterManagementStrategy.docx PAGE 172
8 The CHPP make up water and the net water discharged into the tailings dams, are the numbers of critical importance in the design and performance of the overall Elimatta site water management system. The CHPP make up water effectively becomes a water loss from the site water management system, as it represents the amount of water demand required to be added to the CHPP to satisfy the coal washing requirements for the 7.75 million annual tonnes of ROM coal throughput. The net water discharged into the tailings dams is effectively bound to the fine tailings and is therefore not able to be extracted for use as a water supply source in the water management system. The net water discharged to the tailings dams is therefore also treated as a water loss in the WSBM. The fine tailings which is discharged into the tailings dams will gradually fill the dams over time. The rate of tailings filling is dependent on the discharge rate into the dams and on the settled dry density of the fine tailings. In the WSBM of the Elimatta water management system, the net water discharged to the tailings dams is pumped to dam TDN for the simulation period up to mine year 6, is then pumped to dam TDS for mine years 6 to 1 and is finally pumped to dam TDP (pit N) for mines years 1 to 3 (end of mining). This pumping arrangement will replicate the intended operation of the proposed tailings dams within the Elimatta Coal Mine. The rest of the water inputs and outputs shown circulating in the CHPP water balance schematic, are associated with the moisture content of the ROM coal, the product coal and the rejects, the return water from the tailing dam to the CHPP, plus the water lost in the CHPP due to system inefficiencies. The following Table 8-3 presents the calculated CHPP make up water usage requirements for the, for mine staging years 1 through the end of mining in year 3. As noted in this table, the CHPP make up water usage is calculated to remain static at 2,3 ML/a throughout the entire 3 year mine life. Table 8-3 : Calculated CHPP Make Up Water Usage Demands Item Year 1 Water Usage Demands Year 3 Water Usage Demands Year 5 Water Usage Demands Year 8 Water Usage Demands Year 1 Water Usage Demands Year 15 Water Usage Demands Year 2 Water Usage Demands Year 25 Water Usage Demands Year 3 Water Usage Demands CHPP Make Up Water Requirements (sourced from spreadsheet Elimata Water Balance CHPP.xlsx) 23 ML/a 23 ML/a 23 ML/a 23 ML/a 23 ML/a 23 ML/a 23 ML/a 23 ML/a 23 ML/a TOTAL CHPP Make Up Water Demand 23 ML/a 23 ML/a 23 ML/a 23 ML/a 23 ML/a 23 ML/a 23 ML/a 23 ML/a 23 ML/a 6.3 ML/d 6.3 ML/d 6.3 ML/d 6.3 ML/d 6.3 ML/d 6.3 ML/d 6.3 ML/d 6.3 ML/d 6.3 ML/d 72.9 L/s 72.9 L/s 72.9 L/s 72.9 L/s 72.9 L/s 72.9 L/s 72.9 L/s 72.9 L/s 72.9 L/s DUST SUPPRESSION WATER USAGE Predicted dust suppression water usage for the has been calculated by determining the anticipated water usage associated with the following items: Dust suppression on the central haul road linking the southern MLA 5254 with the northern MLA 527 Dust suppression on the MIA road leading off the central haul road Dust suppression on all the pit ramps leading off the central haul road Document : JBT24-RPT6C-WaterManagementStrategy.docx PAGE 173
9 Dust suppression on all the operational pit floors Dust suppression on the ROM stockpile The calculated dust suppression water usage does not include dust suppression water required during construction. This component is considered to be part of the construction water usage amount discussed in Section 8.5. The water application rates for dust suppression were based on past experience from similar coal mines located in central Queensland. Different application rates were adopted for the various roads, depending on the road s location, on the anticipated traffic volume and on the anticipated traffic speed. The adopted water application rates for dust suppression on the Elimatta Coal Mine site were as follows: 4 L/m 2 /day for the central haul road and the road to the MIA 2 L/m 2 /day for the pit ramp roads 1 L/m 2 /day for the pit floors 2% water to ROM stockpile These adopted water application rates for dust suppression are in reasonable agreement with the indicative guideline values of 1 to 2 L/m 2 /day, contained in the BHP Haul Road Design Manual. Measurements of the various road lengths were determined for each mine staging year and this information was recorded in a spread sheet. A road width of 27 metres was adopted for the central haul road, the MIA road and all the pit ramps. This road width was based on preliminary designs for the road infrastructure associated with the Elimatta Coal Mine. The following Table 8-4 presents the calculated dust suppression water usage requirements for the, for mine staging years 1 through the end of mining in year 3. As noted in this table, the calculated water usage varies depending on the mine staging year. The expected variation in water usage is reasonably steady for the Northern MLA 527, ranging between a minimum of 245 ML/a in mine year 1 to a maximum of 293 ML/a between mine years 1 to 3. The expected water usage for the southern MLA 5254 is much more variable, ranging between a minimum of 399 ML/a in mine year 1 to a maximum of 886 ML/a in mine year 2. This result is not unexpected, as the mine staging affects the southern MLA 5254 more significantly than the northern MLA 527, due to the movement of pits, pit ramps, spoil dumps etc as the mine progresses. The Elimatta water management system has been prepared to provide dust suppression demands at two (2) locations. A northern water fill point will satisfy the demands from the northern MLA 527 while a southern water fill point will satisfy the demands from the southern MLA The calculated split between the water demands associated with the northern and southern water fill points assumed the following: Northern Water Fill Point Includes 3% of central haul road dust suppression plus All dust suppression on the ROM stockpile Document : JBT24-RPT6C-WaterManagementStrategy.docx PAGE 174
10 Southern Water Fill Point Includes 7% of central haul road dust suppression plus All dust suppression on the pit ramp roads All dust suppression on the pit floors Table 8-4 : Calculated Dust Suppression Water Usage Demands Item Year 1 Water Usage Demands Year 3 Water Usage Demands Year 5 Water Usage Demands Year 8 Water Usage Demands Year 1 Water Usage Demands Year 15 Water Usage Demands Year 2 Water Usage Demands Year 25 Water Usage Demands Year 3 Water Usage Demands Haul Road and MIA Dust Suppression Central Haul Road Length 8112 m 872 m 997 m 1958 m 1958 m 1958 m 1958 m 1958 m 1958 m MIA Offshoot Road Length 72 m 72 m 72 m 72 m 72 m 72 m 72 m 72 m 72 m Total Haul and MIA Road Length 8832 m 944 m 169 m m m m m m m Average Haul Road Width 27 m 27 m 27 m 27 m 27 m 27 m 27 m 27 m 27 m Haul and MIA Road area m m m m m m m m m2 Water Application Rate 4 L/m2/d 4 L/m2/d 4 L/m2/d 4 L/m2/d 4 L/m2/d 4 L/m2/d 4 L/m2/d 4 L/m2/d 4 L/m2/d Water Requirements 348 ML/a 372 ML/a 422 ML/a 461 ML/a 461 ML/a 461 ML/a 461 ML/a 461 ML/a 461 ML/a Pit Ramps Dust Suppression Pit E1 Road Length 728 m 23 m 2762 m 4118 m 4215 m 2966 m 4639 m 5819 m 8581 m Pit E2 Road Length 35 m 597 m 766 m 222 m 183 m 534 m 568 m 2386 m m Pit N Road Length 143 m 143 m 143 m 143 m 143 m 1285 m 24 m 118 m 118 m Pit W Road Length m 193 m 1323 m 175 m 175 m 26 m 3243 m 4337 m 4337 m Total Pit Ramp Road length 1221 m 4133 m 4994 m 8213 m 7911 m m 1382 m 1365 m 1426 m Average Pit Ramp Road width 27 m 27 m 27 m 27 m 27 m 27 m 27 m 27 m 27 m Total Pit Ramp Road area m m m m m m m m m2 Water Application Rate 2 L/m2/d 2 L/m2/d 2 L/m2/d 2 L/m2/d 2 L/m2/d 2 L/m2/d 2 L/m2/d 2 L/m2/d 2 L/m2/d Water Requirements 24 ML/a 82 ML/a 98 ML/a 162 ML/a 156 ML/a 24 ML/a 272 ML/a 269 ML/a 277 ML/a Pit Floor Dust Suppression Pit E1 Pit Floor Length 255 m 3393 m 4396 m 456 m 2297 m 1463 m 1594 m 224 m 665 m Pit E2 Pit Floor Length 587 m 2868 m 4475 m 2971 m 2455 m 3746 m 3277 m 179 m m Pit N Pit Floor Length 44 m 44 m 44 m 44 m 44 m 459 m 987 m 75 m 75 m Pit W Pit Floor Length m 1134 m 231 m 2374 m 2374 m 2779 m 211 m 1861 m 1861 m Total Pit Floor Length 3577 m 7835 m m 9841 m 7566 m 8447 m 7968 m 6299 m 3231 m Average Pit Floor Width 1 m 1 m 1 m 1 m 1 m 1 m 1 m 1 m 1 m Total Pit Floor area 3577 m m m m m m m m m2 Water Application Rate 1 L/m2/d 1 L/m2/d 1 L/m2/d 1 L/m2/d 1 L/m2/d 1 L/m2/d 1 L/m2/d 1 L/m2/d 1 L/m2/d Water Requirements 131 ML/a 286 ML/a 424 ML/a 359 ML/a 276 ML/a 39 ML/a 291 ML/a 23 ML/a 118 ML/a Primary Crushing and Train Loadout Dust Suppression ROM production 7 Mt/a 7 Mt/a 7 Mt/a 7 Mt/a 7.75 Mt/a 7.75 Mt/a 7.75 Mt/a 7.75 Mt/a 7.75 Mt/a Water application rate 2 % 2 % 2 % 2 % 2 % 2 % 2 % 2 % 2 % Water Requirements 14 ML/a 14 ML/a 14 ML/a 14 ML/a 155 ML/a 155 ML/a 155 ML/a 155 ML/a 155 ML/a TOTAL Water Demand Dust Suppression 245 ML/a 252 ML/a 267 ML/a 278 ML/a 293 ML/a 293 ML/a 293 ML/a 293 ML/a 293 ML/a North Water Fill Point WFPN1.67 ML/d.69 ML/d.73 ML/d.76 ML/d.8 ML/d.8 ML/d.8 ML/d.8 ML/d.8 ML/d 7.7 L/s 8. L/s 8.4 L/s 8.8 L/s 9.3 L/s 9.3 L/s 9.3 L/s 9.3 L/s 9.3 L/s includes 3% of Central Haul Road 15 ML/a 112 ML/a 127 ML/a 138 ML/a 138 ML/a 138 ML/a 138 ML/a 138 ML/a 138 ML/a Primary Crushing and Train Loadout dust suppression 14 ML/a 14 ML/a 14 ML/a 14 ML/a 155 ML/a 155 ML/a 155 ML/a 155 ML/a 155 ML/a TOTAL Water Demand Dust Suppression 399 ML/a 628 ML/a 818 ML/a 844 ML/a 755 ML/a 871 ML/a 886 ML/a 822 ML/a 717 ML/a South Water Fill Point WFPS ML/d 1.72 ML/d 2.24 ML/d 2.31 ML/d 2.67 ML/d ML/d ML/d 2.25 ML/d ML/d L/s L/s L/s L/s L/s L/s 28.7 L/s 26.4 L/s L/s includes 7% of Central Haul Road 244 ML/a 261 ML/a 295 ML/a 322 ML/a 322 ML/a 322 ML/a 322 ML/a 322 ML/a 322 ML/a All Pit Ramp Roads 24 ML/a 82 ML/a 98 ML/a 162 ML/a 156 ML/a 24 ML/a 272 ML/a 269 ML/a 277 ML/a All Pit Floors 131 ML/a 286 ML/a 424 ML/a 359 ML/a 276 ML/a 39 ML/a 291 ML/a 23 ML/a 118 ML/a Combined Water Demand Dust Suppression at North and South Water Fill Points 643 ML/a 88 ML/a 185 ML/a 1122 ML/a 148 ML/a 1164 ML/a 1179 ML/a 1115 ML/a 11 ML/a ML/d 2.41 ML/d 2.97 ML/d 3.72 ML/d ML/d ML/d ML/d 3.53 ML/d ML/d 2.38 L/s L/s L/s L/s L/s L/s L/s L/s 32.1 L/s OVERALL WATER USAGE The overall water usage for the has been calculated by summing the water usage demands for the potable supply usage, the CHPP make up water usage and the dust suppression usage. As noted in Sections 8.4.1, and 8.4.3, the calculated water usage varies depending on the mine staging year. This variation in water usage is primarily driven by the expected changes to the surface areas requiring dust Document : JBT24-RPT6C-WaterManagementStrategy.docx PAGE 175
11 suppression, due to the mine staging requiring changes to the length of the haul road, the pit ramps, the pit floor areas etc. The following Table 8-5 presents the calculated overall water usage requirements for the Elimatta Development, for mine staging years 1 through the end of mining in year 3. It is observed from the Table 8-5 that the maximum overall water usage volume is calculated to be 3566 ML/a. Table 8-5 : Calculated Overall Water Usage Demands for the Elimatta Coal Mine Item Year 1 Water Usage Demands Year 3 Water Usage Demands Year 5 Water Usage Demands Year 8 Water Usage Demands Year 1 Water Usage Demands Year 15 Water Usage Demands Year 2 Water Usage Demands Year 25 Water Usage Demands Year 3 Water Usage Demands TOTAL CHPP Make Up Water Demand 23 ML/a 23 ML/a 23 ML/a 23 ML/a 23 ML/a 23 ML/a 23 ML/a 23 ML/a 23 ML/a ML/d ML/d ML/d ML/d ML/d ML/d ML/d ML/d ML/d 72.9 L/s 72.9 L/s 72.9 L/s 72.9 L/s 72.9 L/s 72.9 L/s 72.9 L/s 72.9 L/s 72.9 L/s TOTAL Potable Water Demand 87 ML/a 9 ML/a 87 ML/a 87 ML/a 87 ML/a 87 ML/a 87 ML/a 87 ML/a 87 ML/a.238 ML/d.247 ML/d.239 ML/d.239 ML/d.239 ML/d.239 ML/d.239 ML/d.239 ML/d.239 ML/d 2.8 L/s 2.9 L/s 2.8 L/s 2.8 L/s 2.8 L/s 2.8 L/s 2.8 L/s 2.8 L/s 2.8 L/s Combined Water Demand 2387 ML/a 239 ML/a 2387 ML/a 2387 ML/a 2387 ML/a 2387 ML/a 2387 ML/a 2387 ML/a 2387 ML/a CHPP + Potable 6.53 ML/d 6.54 ML/d 6.54 ML/d 6.54 ML/d 6.54 ML/d 6.54 ML/d 6.54 ML/d 6.54 ML/d 6.54 ML/d TOTAL Water Demand Dust Suppression 245 ML/a 252 ML/a 267 ML/a 278 ML/a 293 ML/a 293 ML/a 293 ML/a 293 ML/a 293 ML/a North Water Fill Point WFPN1.669 ML/d.689 ML/d.73 ML/d.762 ML/d.83 ML/d.83 ML/d.83 ML/d.83 ML/d.83 ML/d 7.7 L/s 8. L/s 8.4 L/s 8.8 L/s 9.3 L/s 9.3 L/s 9.3 L/s 9.3 L/s 9.3 L/s includes 3% of Central Haul Road 15 ML/a 112 ML/a 127 ML/a 138 ML/a 138 ML/a 138 ML/a 138 ML/a 138 ML/a 138 ML/a Primary Crushing and Train Loadout dust suppression 14 ML/a 14 ML/a 14 ML/a 14 ML/a 155 ML/a 155 ML/a 155 ML/a 155 ML/a 155 ML/a TOTAL Water Demand Dust Suppression 399 ML/a 628 ML/a 818 ML/a 844 ML/a 755 ML/a 871 ML/a 886 ML/a 822 ML/a 717 ML/a South Water Fill Point WFPS1 1.9 ML/d 1.72 ML/d 2.24 ML/d 2.31 ML/d 2.7 ML/d 2.38 ML/d 2.42 ML/d 2.25 ML/d 1.96 ML/d 12.6 L/s 19.9 L/s 25.9 L/s 26.7 L/s 23.9 L/s 27.6 L/s 28.1 L/s 26. L/s 22.7 L/s includes 7% of Central Haul Road 244 ML/a 261 ML/a 295 ML/a 322 ML/a 322 ML/a 322 ML/a 322 ML/a 322 ML/a 322 ML/a All Pit Ramp Roads 24 ML/a 82 ML/a 98 ML/a 162 ML/a 156 ML/a 24 ML/a 272 ML/a 269 ML/a 277 ML/a All Pit Floors 131 ML/a 286 ML/a 424 ML/a 359 ML/a 276 ML/a 39 ML/a 291 ML/a 23 ML/a 118 ML/a Combined Water Demand Dust Suppression at North and South Water Fill Points 643 ML/a 88 ML/a 185 ML/a 1122 ML/a 148 ML/a 1164 ML/a 1179 ML/a 1115 ML/a 11 ML/a ML/d 2.41 ML/d 2.97 ML/d 3.72 ML/d ML/d ML/d ML/d 3.53 ML/d ML/d 2.38 L/s L/s L/s L/s L/s L/s L/s L/s 32.1 L/s Combined OVERALL Water Demand 33 ML/a 327 ML/a 3472 ML/a 359 ML/a 3435 ML/a 3551 ML/a 3566 ML/a 352 ML/a 3397 ML/a CHPP + Potable + Dust Suppress 8.3 ML/d 8.95 ML/d 9.51 ML/d 9.61 ML/d 9.4 ML/d 9.72 ML/d 9.76 ML/d 9.59 ML/d 9.3 ML/d 8.5 CONSTRUCTION WATER USAGE Water will be required during the construction phase of the, prior to mine staging year zero, to satisfy the demands associated with the following: Moisture content adjustment for all earthworks associated with the construction of water storage dams, earthworks pads, flood levees, creek diversions etc Dust suppression on all cleared construction areas Potable water for construction staff Concrete mixing The water balance modelling documented in this report has focussed on the operational phase of the, only. A detailed assessment of the Document : JBT24-RPT6C-WaterManagementStrategy.docx PAGE 176
12 construction phase water usage requirements has not been undertaken as part of this work. Nevertheless, simple calculations have been undertaken to determine whether the infrastructure proposed as part of the Elimatta water management system, will also provide for the site water requirements during the construction phase. These calculations indicated that approximately 8 ML/a will be required during the construction phase of the Elimatta mine, based on 2 ML/a for dust suppression, 5 ML/a for earthworks moisture adjustment, 8 ML/a for potable water (excludes any allowance for vehicle washing) and nominally 2 ML/a for concrete mixing. The primary requirement for providing a reliable water supply to the Elimatta mine site, both during the operational phase and during the construction phase, is the securing of a reliable external water supply source. From the results of the water balance modelling undertaken for this report, an external water supply rate of 2,5 ML/a will provide 1% reliability of supply to potable and CHPP water usage demands during the operational phase of the mine (refer to Sections and for details). The external water supply is intended to be pumped into raw water dam RW1. To provide a reliable water supply for the construction phase of the Elimatta Development, it is therefore essential that the external water supply is obtained and that the raw water dam RW1 is constructed as priority infrastructure. Based on the water demands expected during the construction phase, it is further recommended that negotiations with the third party commercial water supplier allow for the volume of externally supplied water to be set at 8 ML/a for the 2 year construction phase, and then increased to 2,5 ML/a for the remaining 3 year operations phase. 8.6 EXTERNAL WATER SUPPLY Northern Energy Corporation Ltd has advised that the proposed external water supply for the will be sourced from third party commercial water suppliers. Initially, the external water supply will be treated groundwater by-product resulting from dewatering operations associated with coal seam gas extraction. Once construction of the proposed Nathan Dam is completed, the external water supply will instead be sourced from Nathan Dam EXTERNAL SUPPLY RATE The required external supply rate throughout the operational phase of the Elimatta Coal Mine Development is 2,5 ML/a. This rate is approximately 11 ML/a higher than the sum of the maximum potable water demand rate and the CHPP make up water demand rate. The difference in supply rates represents the water lost to evaporation from the surface of the raw water dam RW1. The external water supply will be pumped to raw water dam RW1 and will be supplied to the Elimatta Coal Mine on a take or pay basis. If the stored water levels in the raw water dam become high enough to risk overtopping, the external water supply can be halted until such time that the dam has sufficient freeboard to prevent overtopping. The raw water dam RW1 has been sized to provide one month s combined supply of potable water and CHPP make up water. This approach will enable mine operations to continue in the event of a temporary interruption to the external water supply, due to pump failure etc. Document : JBT24-RPT6C-WaterManagementStrategy.docx PAGE 177
13 As noted in Section 8.4, the calculated maximum water usage demands for the Elimatta Coal Mine Development will amount to 3,566 ML/a in mine staging year 2. The component breakup of this maximum overall water demand is as follows: 87 ML/a for potable water demands 2,3 ML/a for CHPP make up water demands 293 ML/a for dust suppression water demands (North water fill point) 886 ML/a for dust suppression water demands (South water fill point) The results of the water balance model simulations undertaken using the WSBM of the Elimatta water management system have indicated that it is not feasible to provide a water supply for the mine site which is 1% reliable for all water usage demands, under all possible climate conditions will require massive water storage volumes, which are not logical or feasible given the site constraints. The approach adopted for determining the magnitude of the external water supply rate was to instead ensure that the potable and CHPP water demands were provided with 1% reliability, but allowing the water demands associated with dust suppression to fall into deficit, if there became a supply shortage. The adopted external supply rate for the water management system is 2,5 ML/a. This supply rate is around 11 ML/a higher than the sum of the maximum potable water demand and the CHPP make up water demand. The difference in rates represents the water lost to evaporation from the surface of raw water dam RW1. With an external water supply rate of 2,5 ML/a pumped into raw water dam RW1, the resulting water management system reliability for supply of potable water demands and CHPP make up water demands is calculated to be 1% for all modelled climate risk cases (refer to Sections and for details). The calculated system reliability for the supply of dust suppression water demands to the northern water fill point is calculated to be 1% for all climate risk profiles including the 9 percentile risk and above. For the 5 percentile climate risk, only 5% of the annual fill point water demands will be met and the fill point demand will be in deficit for 21 days per year. The calculated system reliability for the supply of dust suppression water demands to the southern water fill point is 1% for all climate risk profiles including the 8 percentile risk and above. For the 5 percentile climate risk, only 74% of the annual fill point water demands will be met and the fill point demand will be in deficit for 23 days per year EXTERNAL SUPPLY SALINITY The external water supply is expected to have a TDS in the order of 2 mg/l (Electrical Conductivity EC of 3 µs/cm), which corresponds to the background TDS in a number of surrounding watercourses and water storages throughout the Fitzroy Basin area. The external supply water initially sourced from coal seam gas dewatering will be treated to a level which provides a maximum TDS of 2 mg/l. This water quality will be suitable for use in the CHPP and for dust suppression on the mine site. Document : JBT24-RPT6C-WaterManagementStrategy.docx PAGE 178
14 8.7 CRITERIA FOR ALLOWABLE CONTROLLED RELEASES Northern Energy Corporation Ltd Section 4.4 presents the Final Model Water Conditions for Coal Mines in the Fitzroy Basin 213 (herein referred to as the Fitzroy Flow Release Manual 213), issued by the Department of Environment and Heritage Protection (DEHP). The Fitzroy Flow Release Manual 213 provides guidelines for the assessment of flow release triggers for the release of mine affected water during flow events in receiving waters. The Fitzroy Flow Release Manual provides 3 alternative flow release triggers for the release of mine affected water into receiving waters. These release triggers include a no/low flow release trigger, a medium flow release trigger and a high flow release trigger. Based on the intent of the Fitzroy Flow Release Manual, the following flow triggers have been determined for the Horse Creek receiving waters NO/LOW FLOW RELEASE TRIGGER (GOOD QUALITY MINE AFFECTED WATER) The no/low flow trigger for Horse Creek has been determined as follows: Release is only permitted when flows in the Horse Creek receiving waters are on the tail end of a flow event, ie. permitted only following a flow in the creek which has risen to a level above a specified event flow trigger and then has fallen back below the flow trigger again. This scenario will then commence a release window of 28 days during which release of good quality mine water can occur. From the EC versus flow interaction diagrams presented in Section and 3.7.4, the adopted flow event trigger for Horse Creek corresponds to the 5 percentile daily flow rate, which is only.5 m 3 /s (5 ML/day) immediately upstream of the mine site. An event flow trigger value of.5 m 3 /s will be impossible to measure with a stream flow gauge constructed on the mobile creek bed of Horse Creek. A more realistic event flow trigger of 1. m 3 /s has therefore been adopted as being appropriate for the Horse Creek watercourse. The end of pipe water quality of the mine water must be the long term background reference 75 th /8 th percentile EC in the receiving waters. From Section 7.2, the 8 percentile EC for the Dawson River was calculated as 38 µs/cm (TDS 25 mg/l). This value was also adopted as being appropriate for the Horse Creek watercourse. The duration of the release is to be limited (in a dry ephemeral watercourse, the duration of the release must not exceed 28 days after the flow in the receiving waters falls below the event flow trigger. No volume/rate limits have been specified for the no/low flow release trigger MEDIUM FLOW RELEASE TRIGGER (MEDIUM QUALITY MINE AFFECTED WATER) The medium flow trigger for Horse Creek has been determined as follows: Release is only permitted when flow in the Horse Creek receiving waters is above a specified flow trigger, which must be representative of event flow and be above the base/low flow. Document : JBT24-RPT6C-WaterManagementStrategy.docx PAGE 179
15 From the EC versus flow interaction diagrams presented in Section and 3.7.4, the adopted flow event trigger for Horse Creek corresponds to the 5 percentile daily flow rate, which is only.5 m 3 /s (5 ML/day) immediately upstream of the mine site. An event flow trigger value of.5 m 3 /s will be impossible to measure with a stream flow gauge constructed on the mobile creek bed of Horse Creek. A more realistic event flow trigger of 1. m 3 /s has therefore been adopted as being appropriate for the Horse Creek watercourse. Two medium flow release triggers have been specified. The first Med1 release trigger corresponds to a minimum event flow trigger of 1. m 3 /s, plus a maximum end of pipe water quality (EC) of 15 µs/cm (1 mg/l) for the mine affected water to be released. The corresponding maximum release rate for the Med1 release trigger is.6 m 3 /s (based on Q trigger x (EC instream EC trigger) / (EC EOP EC instream). The second Med2 release trigger corresponds to a minimum event flow trigger of 2. m 3 /s, plus a maximum end of pipe water quality (EC) of 35 µs/cm (2345 mg/l) for the mine affected water to be released. The corresponding maximum release rate for the Med2 release trigger is.4 m 3 /s (based on Q trigger x (EC instream EC trigger) / (EC EOP EC instream). The design dilution/maximum release rate should be based on a site specific risk assessment. The maximum release rate should be designed to achieve an in-stream EC based on mid catchment (Zone 2) of EC instream = 7 µs/cm HIGH FLOW RELEASE TRIGGER (POORER QUALITY MINE AFFECTED WATER) The high flow trigger for Horse Creek has been determined as follows: Release is only permitted when flow in the Horse Creek receiving waters is above a specified high flow trigger, which must be representative of high event flow and be above the medium flow. The 9 percentile flow rate in Horse Creek has been adopted for the high flow trigger. From Section 7.1, the 9 percentile flow rate for Horse Creek was calculated as 4. m 3 /s (346 ML/d). The high flow release trigger corresponds to a minimum event flow trigger of 4. m 3 /s, plus a maximum end of pipe water quality (EC) of 1, µs/cm (67 mg/l) for the mine affected water to be released. The corresponding maximum release rate for the high flow release trigger is.2 m 3 /s (based on Q trigger x (EC instream EC trigger) / (EC EOP EC instream). The design dilution/maximum release rate should be based on a site specific risk assessment. The maximum release rate should be designed to achieve an in-stream EC based on mid catchment (Zone 2) of EC in stream = 7 µs/cm 8.8 HAZARDOUS DAMS Based on the results of the water and salt balance modelling undertaken for the Elimatta Coal Mine water management system, it is expected that there will be seven water storage dams within the Elimatta water management system which will be classified as hazardous, Document : JBT24-RPT6C-WaterManagementStrategy.docx PAGE 18
16 based on DEHP s hazard criteria guidelines. These hazardous dams will not be located on any watercourses, but some of the dams will capture overland flow from upstream catchments. These dams are therefore required to meet the provisions of Section 11 of the Water Resource (Fitzroy Basin) Plan 211. Table 8-6 summarises the potentially hazardous dams within the Elimatta water management system. Dams EV1, EV2, EV3 and EV4 are all environmental dams. Dam EV1 will receive pit water dewatered from pit N. Dam EV2 will receive pit water dewatered from pits E1 and E2. Dam EV3 will receive pit water dewatered from pit W. Dam EV4 is an environmental dam which will receive runoff from the Elimatta mine industrial area (MIA). Dams TDN, TDNA and TDP are all tailings dams which will all receive fine tailings rejects output from the CHPP. Based on the results of the water and salt balance modelling undertaken for the Elimatta water management system, the modelled salinity of the water stored in the various hazardous dams was predicted to have median TDS values ranging between 1,5 mg/l and 5, mg/l (refer to Table 8-6 and Section 1.5 for details). These modelled TDS values are reasonably similar to generic water quality values which have been measured at similar open cut coal mines located within the Bowen Basin in central Queensland. As a comparison, generic measurements for pit seepage water have been shown to have electrical conductivity (EC) values in the order of 9, µs/cm (6, mg/l). Table 8-6 : Hazardous Dams Within the Elimatta Water Management System Hazardous Dam Maximum Storage Volume (ML) Modelled TDS (mg/l) 1 Maximum Surface Area (ha) Overall Storage Depth (m) Height Above Ground Level (m) Dam EV (median) Dam EV (median) Dam EV3 2 5 (median) Dam EV (median) Dam TDN 13,6 2,7 (median) Dam TDNA 11,77 2,4 (median) Dam TDP (Pit N) 3 51,7 4,6 (median) Notes : Document : JBT24-RPT6C-WaterManagementStrategy.docx PAGE 181
17 1. The modelled peak TDS was based on statistical assessments of modelled daily TDS in the dams, over 93 separate 3 year simulations. 2. Dam TDP is actually pit N. After mine year 1, pit N will ceases to be an operational pit and will transition to an in-pit tailings storage. This transition is represented in the WSBM by tailings dam TDP, which becomes functional after mine year DAM SIZING CRITERIA DEHP s Manual for Assessing Hazard Categories and Hydraulic Performance of Dams 212 has been used to analyse the hazardous dam sizing requirements. DEHP s sizing criteria for hazardous dams is primarily interested in providing sufficient design storage allowance (DSA) at 1 November each year, to accommodate the runoff which could be generated by an extreme wet season of rainfall and runoff. For the Elimatta region, the wet season of interest is the 4 months wet season, which typically runs from October to February. DEHP s standard approach for sizing the DSA is the method of deciles, which multiplies the four (4) month wet season rainfall by the contributing catchment area of the hazardous dam to give a DSA volume, This approach assumes 1% conversion of rainfall to runoff, and DEHP do not allow for any evaporation losses in the calculation of the DSA. DEHP also required the DSA to include any process inputs to the dam over the 4 month wet season. An assessment of the likely hazard category of the Elimatta hazardous dams has been completed and documented in Section The expected category for the Elimatta dams is significant, although it is acknowledged that this is based on model predictions of the expected TDS of the water stored in the dams. For a significant hazard category dam, DEHP s Dam Manual stipulates an AEP for the DSA of.5 (1 in 2 year ARI). As noted in Section 5.3.4, the calculated 1 in 2 year 4 month wet season rainfall calculated for the Elimatta region is 51mm METHOD OF DECILES SIZING OF HAZARDOUS DAMS The initial sizing of the hazardous dams on the Elimatta mine site was undertaken using DEHP s Method of Deciles to size the rainfall component of the DSA. In addition, the expected groundwater seepage to the various mine pits was included in the DSA, to account for pit dewatering into the hazardous dams during the 4 month wet season. A summary of the results of the Method of Deciles calculations of the DSA volumes for hazardous dams EV1, EV2, EV3 and EV4, are presented in Table 8-7. Document : JBT24-RPT6C-WaterManagementStrategy.docx PAGE 182
18 Table 8-7 : Method of Deciles Design Storage Allowance Sizing for Hazardous Dams Item Hazardous Dam EV1 Hazardous Dam EV2 Hazardous Dam EV3 Hazardous Dam EV4 4 Month Wet Season Rainfall (mm) Catchment Area (ha) DSA 4 Month Rainfall Volume (ML) Pit De-watering Volume (ML) Combined DSA Seepage + Rainfall (ML) METHOD OF OPERATIONAL SIMULATION SIZING OF HAZARDOUS DAMS The initial dam sizes calculated for the various hazardous dams using the Method of Deciles, were input to the GoldSim water and salt balance model (WSBM) of the Elimatta water management system. The WSBM was then run using 93 Monte Carlo realisations, with each realisation simulated 3 years of daily climate data (refer to Section for details). This approach is in accordance with DEHP s Method of Operational Simulation, documented in DEHP s Manual for Assessing Hazard Categories and Hydraulic Performance of Dams 212. The primary target containment immunity for acceptable performance of all hazardous dams was set at the 1 in 2 year AEP level (refer to Sections 4.5 and 8.8 for details). A secondary target containment immunity was set at the 95 percentile climate risk. In other words, the dams were sized to allow uncontrolled overflows during the wettest 5 percentile of all climate cases. All of the hazardous dams in the Elimatta water management system have been sized to meet both of these containment target immunities. However, initial results from the WSBM indicated that the hazardous dams were overflowing more regularly than the target 1 in 2 year AEP level. This was primarily due to the interaction of the pit dewatering into the environmental dams, plus the catchment runoff into the environmental dams. The model results demonstrated that it was difficult to achieve a balance between maximising the pit availability (maximum pit dewatering) versus minimising the overflows from the environmental dams. The WSBM was configured to stop pit dewatering once the capacity of the environmental dams was reached. This meant that pit dewatering was stopped during very wet climate conditions, as the environmental dams were typically already full. A balance between pit availability and environmental dam sizing was able to be achieved and the WSBM was used to determine the final sizing of all hazardous dams. The target Document : JBT24-RPT6C-WaterManagementStrategy.docx PAGE 183
19 containment immunity for the hazardous dams was achieved with the dam sizes presented in Table 8-6. A complete summary of the statistical results of the water and salt balance modelling for all hazardous dams is presented in Section SEDIMENT DAMS DME SEDIMENT DAM SIZING CRITERIA The Department of Minerals and Energy Technical Guidelines for the Environmental Management of Exploration and Mining in Queensland 1995, has been used to analyse the sediment dam sizing requirements. The DME sizing criteria for sediment dams is based on the.1 AEP (1 in 1 year ARI) 24 hour design storm. The DME guidelines recommend that sediment dams be designed to allow draw down of the storage volume within 1 days. The sediment dams should also be designed to bypass when full. For the sediment dams within the Elimatta water management system, drawdown of the storage within 1 days was not regarded as desirable for several reasons. Firstly, the stored water in the sediment dams was likely to be saline, due to the water s contact with spoil and overburden material, so the proposal to draw down saline water into the Horse Creek receiving waters would contradict DEHP s current flow release criteria for watercourses throughout the Fitzroy Basin. Secondly, the water stored in the sediment dams is a resource that can be used to satisfy water usage demands on the mine site. Accordingly, the sediment dams for the Elimatta water management system have been designed to retain water, without draw down over 1 days. However, the sediment dams have been designed to overflow when full, via an emergency spillway. Detailed design of the sediment dams, including the emergency spillway configurations will be undertaken during the detailed design phase INITIAL SIZING OF SEDIMENT DAMS The initial sizing of the sediment dams on the Elimatta mine site were undertaken using DME Technical Guideline s 1 in 1 year, 24 hour design storm, to size the required sediment basin volume. Examples of the results of these simple hand calculations of the sediment basin volumes are presented in Table 8-8 for sediment dams SD1, SD2 and SD3. Document : JBT24-RPT6C-WaterManagementStrategy.docx PAGE 184
20 Table 8-8 : Initial Sizing for Sediment Dams SD1, SD2 and SD3 Item Sediment Dam SD1 Sediment Dam SD2 Sediment Dam SD3 1 in 1 year, 24 hour Rainfall Intensity (mm/h) 1 in 1 year, 24 hour Rainfall Depth (mm) Catchment Area (ha) 1 in 1 year, 24 hour Runoff Volume (ML) FINAL SIZING OF SEDIMENT DAMS The dam sizes for sediment dams SD1, SD2 and SD3, as shown in Table 8-8, were input to the GoldSim WSBM of the Elimatta water management system and the model was run using 93 Monte Carlo realisations, with each realisation simulated 3 years of daily climate data (refer to Section for details). The primary target containment immunity for acceptable performance of all sediment dams was set at the 1 in 1 year AEP level (refer to Section 8.9 for details). A secondary target containment immunity was set at the 9 percentile climate risk. In other words, the dams were sized to allow uncontrolled overflows during the wettest 1 percentile of all climate cases. All of the sediment dams in the Elimatta water management system have been sized to meet these risk targets. Initial results from the WSBM indicated that the sediment dams were significantly oversized based on the simplified DME Technical Guidelines. This was primarily due to the interaction of the water demands from the sediment dams and the controlled releases in accordance with the DEHP release criteria. The sediment dam sizes were therefore able to be reduced whilst still achieving the target containment immunity levels. A complete summary of the statistical results of the water and salt balance modelling for all sediment dams is presented in Section RAW WATER DAM RW1 As noted in Section 8.6, Northern Energy Corporation Ltd has advised that the proposed external water supply for the will be sourced from third party commercial water suppliers. Initially, the external water supply will be treated groundwater by-product resulting from dewatering operations associated with coal seam gas extraction. Once construction of the proposed Nathan Dam is completed, the external water supply will instead be sourced from Nathan Dam. The current proposal is to deliver this raw water directly to raw water dam RW1 on the northern Elimatta MLA 527. Document : JBT24-RPT6C-WaterManagementStrategy.docx PAGE 185
21 8.1.1 EXTERNAL SUPPLY RATE The required external supply rate throughout the operational phase of the Elimatta Coal Mine Development is 2,5 ML/a. This rate is approximately 11 ML/a higher than the sum of the maximum potable water demand rate and the CHPP make up water demand rate. The difference in supply rates represents the water lost to evaporation from the surface of the raw water dam RW1. The external water supply will be pumped to raw water dam RW1 and will be supplied to the Elimatta Coal Mine on a take or pay basis. If the stored water levels in the raw water dam become high enough to risk overtopping, the external water supply can be halted until such time that the dam has sufficient freeboard to prevent overtopping. The raw water dam RW1 has been sized to provide one month s combined supply of potable water and CHPP make up water. This approach will enable mine operations to continue in the event of a temporary interruption to the external water supply, due to pump failure etc. As noted in Section 8.6.1, the proposed external supply rate will be 2,5 ML/a, which will provide 1% reliability to the supply of potable water demands and CHPP make up water demands. (refer to Sections and for modelling results) SIZING OF RAW WATER DAM RW1 The initial sizing for raw water dam RW1 was 2 ML. This size was selected on the basis that it represented one months of water supply to the combined potable and CHPP make up water demands of maximum overall site water demands of 2,39 ML/a. The one month calculation allowed for evaporation at.3 ML/d, which corresponds to the median daily evaporation from the dam s surface. The 2 ML size for raw water Dam RW1 was input to the GoldSim WSBM of the Elimatta water management system and the model was run using 93 Monte Carlo realisations, with each realisation simulated 3 years of daily climate data (refer to Section for details). A complete summary of the results of the water and salt balance modelling for raw water dam RW1 is presented in Section MINE CLOSURE At the end of mining in mine year 3, the only pits remaining will be the final voids for pit E1 and pit W. The final void for pit E1 will ultimately be located in the south east corner of the southern Elimatta MLA The capacity of the final void for pit E1 is estimated at 7, ML. A small localised catchment of 135 ha will still drain to the pit E1 final void. This catchment area represents the void floor and the batters up to the finished land form ground surface. The remaining finished landform around the pit E1 final void will have been graded to naturally free drain west into the Horse Creek receiving waters. The final void for pit W will ultimately be located near the south west corner of the southern Elimatta MLA The capacity of the final void for pit W is estimated at 28, ML. A small localised catchment of 12 ha will still drain to the pit W final void. This catchment area represents the void floor and the batters up to the finished land form ground surface. The remaining finished landform around the pit W final void will have been graded to naturally free drain east into the Horse Creek receiving waters. Document : JBT24-RPT6C-WaterManagementStrategy.docx PAGE 186
22 The final void for the north pit tailings storage is intended to be capped and rehabilitated by the end of mining. The final landform of all areas affected by mining will be stabilised, rehabilitated and graded to ensure that drainage will naturally flow towards the Horse Creek watercourse. Document : JBT24-RPT6C-WaterManagementStrategy.docx PAGE 187
23 9. - WATER AND SALT BALANCE MODEL (WSBM) Northern Energy Corporation Ltd A key component in preparing the water management strategy for the proposed Elimatta Coal Mine Development, was the determination of how much water needs to be managed, both within the mine site and external to the mine site, for a wide range of possible climate conditions. This aspect required the prediction of the volume of runoff that was likely to occur, both within the mine site and external to the mine site, as a result of a range of possible climate conditions. The water and salt balance model (WSBM) prepared for the Elimatta Coal Mine Development incorporates a mass balance of water and salt from a number of sources, simulated over defined climatic periods. The structure of the WSBM has been prepared to approximately represent the layout and operation of the proposed Elimatta, including all mining pits, water storage dams, contributing catchments, catchment diversions, water demands, external water supply, pumping transfers, allowed controlled releases, uncontrolled overflows and receiving waters. Use of the WSBM has enabled complex statistical analysis to be performed on the water management system, for a wide range of possible climate conditions. Sensitivity assessments of dam sizes, external water supply rates, pumped transfer rates and release rates were able to be undertaken, to optimise the size and layout of the water management system infrastructure. The results generated by the WSBM simulations have been used to identify the reliability of supply of water to mine water usage demands, to identify the risk of system overflows and to identify the risk of pit flooding (availability). Document : JBT24-RPT6C-WaterManagementStrategy.docx PAGE 188
24 9.1 OVERALL WSBM CONFIGURATION AND CAPABILITY Northern Energy Corporation Ltd The WSBM replicates the procedures that are anticipated to occur during normal day to day operation of the Elimatta Coal Mine s Water Management System, as follows : Inclusion of variable climate inputs, based on long term historic climate records, to enable an assessment of the water management system s behaviour over a wide range of climatic conditions. Inclusion of water runoff and salt loading from mine affected catchments within the extent of the MLAs, with different water runoff rates and salt loading rates being applied to the different land use types throughout the mine site. Inclusion of water runoff and salt loading from catchments external to the mine site, particularly those catchments which represent the receiving waters which will accept off-site water discharges from the mine s water management system. Collection of water runoff and salt loads in all storages (includes all pits and dams), including the balance of inflows into each storage and outflows out of each storage. Inclusion of direct rainfall inflows onto the water surface of all storages. Inclusion of external supply water and associated salt loading, pumped into the Raw Water dam in the northern MLA area. Inclusion of evaporation losses and seepage losses from the water surface of all storages, including the associated losses of salt loading. Inclusion of ground water seepage inflows and associated ground water salt loading into the pits. Inclusion of pumped transfers of water and salt from storages to storages and from storages to water usage points. Inclusion of water usage throughout the mine site, in accordance with the various demands for CHPP water, potable water and dust suppression water. Inclusion of allowable controlled releases of water and salt from applicable storages into downstream receiving waters, in accordance with DEHP s criteria for the controlled release of mine affected water during flow events. Inclusion of uncontrolled overflows of water and salt from all storages into other downstream storages or into downstream receiving waters. Representation of the water quantity and quality in the Horse Creek receiving waters at the upstream and downstream boundaries of the mine site. Representation of the net effect of all controlled releases and all uncontrolled overflows from the Elimatta water management system, on the water quality (salinity) of the Horse Creek receiving waters at the downstream boundary of the mine. Representation of proposed mine stages, allowing for changes to the water management system at each mine staging snap shot, including changes to catchments, water storages, pumped transfers and water demands. Document : JBT24-RPT6C-WaterManagementStrategy.docx PAGE 189
25 9.2 GOLDSIM SOFTWARE Northern Energy Corporation Ltd The WSBM constructed for the Water Management Strategy was prepared using the GoldSim software package. GoldSim is an object orientated computer program, capable of performing dynamic probabilistic simulations. A GoldSim model of an existing or proposed system can be run to identify and understand the key factors which control the output or operation of the system and the model can also be run to predict future behaviour of the system. Virtually any system which can be quantitatively defined using inputs, equations and operating rules, can be successfully modelled using GoldSim. GoldSim is essentially a powerful graphical spread sheet, which allows the user to visually create and manipulate data and calculations. GoldSim is a time-series modelling package, which is ideally suited to the modelling of water and contaminant mass balances, particularly when modelling system behaviour over extended time periods. GoldSim is capable of modelling individual simulations using pre-defined or stochastically generated input data and it is also capable of modelling multiple Monte Carlo type simulations using pre-defined or stochastically generated input data. The user is able to control the operation of the Monte Carlo type simulations, using a choice of specific or random run parameters. GoldSim can control model output in accordance with the user requirements. For climate modelling simulations, the output generated from individual simulations, or from multiple Monte Carlo type simulations, can be readily interrogated from within the software, or through outputs to spread sheets and can then be used to evaluate the probability statistics and risks associated with various system scenarios. The WSBM constructed for the Water Management Strategy was prepared using GoldSim Version 1.5 (SP2). 9.3 GOLDSIM WSBM SCHEMATIC Figure 9.1 presents the overall schematic of the GoldSim WSBM of the Elimatta Coal Mine Development Water Management System. The schematic illustrates all the various elements in the GoldSim model, including all water storage dams, pits, receiving waters, water demands and external supply. The schematic also illustrates the pumping transfer connections between the various water storages, mine pits and water demands. Finally, the schematic illustrates the connections of controlled releases and uncontrolled overflows from the various water storages into the Horse Creek receiving waters. Document : JBT24-RPT6C-WaterManagementStrategy.docx PAGE 19
26 Figure 9.1 : GoldSim Model Schematic of the Elimatta Water Management System Document : JBT24-RPT6C-WaterManagementStrategy.docx PAGE 191

27 Figure 9.2 illustrates the corresponding GoldSim model representation of the WSBM of the Water Management System. This figure shows the overall layout of the main elements of the GoldSim model, with the various model elements representing water storage dams, mine pits, receiving waters, water demands and external supply. Whilst the figure does not clearly show the water transfer connections between the various water storages, pits, water demands and receiving waters, the arrow connections do illustrate where information is being taken from throughout the model. Figure 9.2 : GoldSim Model Representation of the Elimatta Water Management System Document : JBT24-RPT6C-WaterManagementStrategy.docx PAGE 192
28 9.4 GOLDSIM WSBM SIMULATION SETTINGS SIMULATION TIME STEP The WSBM simulations of the Elimatta Coal Mine s Water Management System were run using a daily time step WSBM SIMULATION PERIOD The GoldSim WSBM simulations were run to simulate a 3 year time period, corresponding to the expected life span of the Elimatta Coal Mine. These 3 year simulations are referred to as model realisations. As noted in Section 5.3, 123 years of historic SILO data drill climate data was available for use in the GoldSim WSBM simulations. By running the model for only 3 years, all possibilities of climate variability cannot be analysed, hence we cannot be certain of how the water management system will behave under all possible historic climate conditions. This issue can be addressed using two alternative modelling approaches. Analysis of the outputs generated by each modelling approach would be expected to provide simular statistical results. The first approach would involve configuring the WSBM to simulate the full 123 year climate period. However, it is known that the layout of the WSBM does change during the mine s 3 year life, in accordance with the proposed mine staging plans. To ensure that each mine staging layout is analysed for the full 123 years of climate data, GoldSim WSBM simulations would therefore need to be run for each mine staging snap shot (ie mine year 1, 3, 5 etc), each for the full 123 years of climate data. The other alternative modelling approach involved running the WSBM using Monte Carlo type simulations. The Monte Carlo approach was adopted for this project, as discussed in Section WSBM MONTE CARLO SIMULATIONS Monte Carlo mode enabled the WSBM to run 93 separate GoldSim realisations, with each model realisation simulating a 3 year mine life. The starting date for subsequent model realisations was incremented by one year relative to the previous realisation and the model was re-run. For example, the first model realisation was run for the 3 year simulation period from 1889 to 1918, while the second model realisation was run for the 3 year simulation period from 189 to This process was repeated for 93 model realisations, until all the 123 years of available climate data between 1889 and 211, had been simulated in the GoldSim WSBM. GoldSim is able to store the results of multiple realisations, so the output from the Monte Carlo simulations of 93 model realisations was then analysed to calculate statistical values of dams sizes, system overflows, system releases, demand deficits, pit availability etc. Document : JBT24-RPT6C-WaterManagementStrategy.docx PAGE 193
29 9.5 MODELLING OF MINE STAGING PLAN SNAP SHOTS Northern Energy Corporation Ltd Minserve Pty Ltd has developed the mine staging plans for the proposed Elimatta Coal Mine, throughout its planned 3 year life span. Sections 2.5 and 13.1 document the proposed mine stages. The WSBM was configured to account for the evolution of the water management system for the Elimatta mine, in accordance with the changes to mining identified in the mine staging plans. In practice, some elements of the Elimatta water management system will not be required at various times throughout the 3 year life of the mine. For example, the north pit will not operate for the full 3 years and some environmental dams and raw water dams will not be required at all times throughout the mine s life. Because the WSBM needed to represent the Elimatta water management system at all times throughout the mine s 3 year life, every storage dam, every pit and every water demand that would be needed at some point during the mine s life, was required to be represented in the layout of the WSBM. However, flexibility was built into the model, by enabling changes to occur to the various dams, pits and water demands, depending on the elapsed time in the model simulation. This flexibility not only allowed the sizes of dams, pits and water demands to change with time, it also allowed these model elements to effectively appear or disappear from the simulation when required. This flexibility of the WSBM configuration allowed the model to represent the actual operation and evolution of the Elimatta Coal Mine water management system, through the mine s 3 year life span. The WSBM was configured to represent the Elimatta Coal Mine water management system layout, required for proposed mine staging years 1, 3, 5, 8, 1, 15, 2, 25 and at the end of mining in year WATER USAGE DEMAND INPUTS Raw water will be required for the operation of the, for potable use, for coal washing use in the CHPP and for dust suppression over the mine s haul roads, pit ramps, pit floors and ROM stockpile. Raw water usage demands for the mine site were determined for snap shots corresponding to proposed mine staging years 1, 3, 5, 8, 1, 15, 2, 25 and at the end of mining in year 3. As noted in Section 8.4, the calculated water usage demands for the Elimatta Coal Mine Development were predicted to vary throughout the mine s life, from a minimum rate of 3,3 ML/a at mine year 1, to a maximum rate of 3,566 ML/a at mine year 2. The adopted raw water usage demands input to the WSBM of the Elimatta Coal Mine s Water Management System comprised four raw water usage demand components, as follows. Refer to Table 8-5 for details of the raw water demand rates for each of these demand components. Potable water demands CHPP make up water demands Dust suppression water demands (North water fill point) Dust suppression water demands (South water fill point) Document : JBT24-RPT6C-WaterManagementStrategy.docx PAGE 194
30 9.7 PRIORITISED PUMPING TO WATER USAGE DEMANDS Northern Energy Corporation Ltd The WSBM of the Elimatta Coal Mine s Water Management System was configured to allow for the pumped transfer of water to satisfy water usage demands, from multiple water storage sources. For each daily time step, the WSBM accommodated this by firstly attempting to satisfy the water demand from the number 1 priority source. If there is sufficient water available in the number 1 priority source, then the water demand is satisfied for that day, so the model does not take any water from other priority sources. However, if there is insufficient water available in the number 1 priority source, the model then attempts to take the water demand shortfall from the number 2 priority source. If there is sufficient water available in the number 2 priority source to satisfy the demand shortfall, then the water demand is satisfied for that day, so the model does not take any water from other priority sources. Otherwise, the model continues working its way down the list of priority sources, until the water demand is satisfied, or until the list of available water sources is exhausted. Table 9-2 and Table 9-3 present the priority lists for supply to water demands for the north and south water fill points. As can be noted from the priority lists, the rationale behind the pumping priorities was to try to take water from the storages which were likely to have the higher salinity levels in the first instance, then move down the priority list to other water storages, should the demands remained unsatisfied. The intent was to try to lower the water levels in those water storages containing higher salinity water, thereby reducing the risk of those dams overtopping during extreme wet climate conditions PRIORITISED PUMPING TO THE POTABLE WATER DEMAND All water required for the potable supply was sourced from raw water dam RW1 only. The modelled pumping rate to the potable demand was 3 L/s. No prioritisation was required for this water demand PRIORITISED PUMPING TO THE CHPP WATER DEMAND The prioritised pumping instructions input to the WSBM to pump water to the CHPP Make Up water demands allowed water to be supplied by up to five (5) dams. Table 9-1 summarises the modelled pumping priorities to satisfy usage demands for the CHPP Make Up water demands. Document : JBT24-RPT6C-WaterManagementStrategy.docx PAGE 195
31 Table 9-1 : Prioritised Pumping to the CHPP Water Demand Priority Water Source Pump Rate (L/s) 1 Raw Water Dam RW1 1 2 Environmental Dam EV4 1 3 Tailings Dam TDN 1 4 Tailings Dam TDNA 1 5 Tailings Dam TDP PRIORITISED PUMPING TO THE NORTH WATER FILL POINT DEMAND The prioritised pumping instructions input to the WSBM to pump water to the north water fill point (WFPN1) water demands allowed water to be supplied by up to five (5) dams. Table 9-2 summarises the modelled pumping priorities to satisfy usage demands for the north water fill point water usage demands. Table 9-2 : Prioritised Pumping to the North Water Fill Point (WFPN1) Priority Water Source Pump Rate (L/s) 1 Tailings Dam TDN 1 2 Tailings Dam TDNA 1 3 Tailings Dam TDP 1 4 Environmental Dam EV4 1 5 Raw Water Dam RW PRIORITISED PUMPING TO THE SOUTH WATER FILL POINT DEMAND The prioritised pumping instructions input to the WSBM to pump water to the south water fill point (WFPS1) water demands allowed water to be supplied by up to eleven (11) dams. Table 9-3 summarises the modelled pumping priorities to satisfy usage demands for the south water fill point water usage demands. Document : JBT24-RPT6C-WaterManagementStrategy.docx PAGE 196
32 Table 9-3 : Prioritised Pumping to the South Water Fill Point (WFPS1) Priority Water Source Pump Rate (L/s) 1 Environmental Dam EV2 1 2 Environmental Dam EV1 1 3 Environmental Dam EV3 1 4 Sediment Dam SD1 1 5 Sediment Dam SD2 1 6 Sediment Dam SD3 1 7 Raw Water Dam RW2 1 8 Raw Water Dam RW1 1 9 Tailings Dam TDN 1 1 Tailings Dam TDNA 1 11 Tailings Dam TDP INCLUSION OF WATER AND SALT MASS BALANCE The WSBM simulations of the Elimatta Coal Mine s Water Management System included a water balance component and a parallel salt balance component. The water balance component of the WSBM simulated all water sources, sinks and transfers throughout the model. The model essentially functioned as a water accounting model, tracking the coming and going of water mass into and out of every storage element of the model. The model s storage elements included all dams and pits. The model accounted for all water mass movements associated with direct rainfall, catchment runoff, groundwater seepage into pits, stored water, evaporation losses, seepage losses, pumped water transfers, water usage/demand sinks, controlled releases from dams, uncontrolled overflows from dams and receiving waters passing flows. The salt balance component of the WSBM simulated all salt sources, sinks and transfers associated with water movements throughout the model. The model essentially functioned as a salt accounting model, tracking the coming and going of salt mass into and out of every storage element of the model. When stored in the dams and pits, salt was represented as a mass, which was able to be converted to a total dissolved salts (TDS) value by dividing the salt mass by the stored water volume. For modelling purposes, an upper limit of the TDS was set at 35, mg/l to limit the salinity to the TDS corresponding to sea water, when the stored water volumes in the dams and pits become very low. Document : JBT24-RPT6C-WaterManagementStrategy.docx PAGE 197
33 When water was pumped between storages or to a water usage/demand sink, balance of the salt mass was simulated by calculating the volume of salt pumped, which equated to the pumped flow rate multiplied by the corresponding TDS of the source water storage. A similar approach was used to model the balance of salt mass out of the various dams, during controlled releases or during uncontrolled overflows. The TDS in the Horse Creek receiving waters was calculated for 3 locations in the model, namely upstream of MLA 5254 (U/S Location), at the northern boundary of MLA 5254 (MID Location) and downstream of MLA 5271 (D/S Location). The TDS in Horse Creek was calculated by dividing the instantaneous salt mass by the instantaneous flow rate. 9.9 RAINFALL AND EVAPORATION INPUTS The climate data chosen for the model simulations is the primary controlling input in terms of identifying the risk of system overflows, the risk of pit flooding and the risk of demand deficits to the various water usage points. Uncertainties relating to the climate risk can be reduced by ensuring that the modelling is performed using historic climate data as model inputs and by also ensuring that the model simulations represent lengthy periods of historic climate data. It is important that the model simulations include the naturally occurring periods of drought and flooding, in order to gain an understanding of the behaviour of the water management system, under a wide range of varying climatic conditions. As noted in Section 5.3, 123 years of historic climate data was derived for the Elimatta Coal Mine site using the SILO Data Drill. The climate data included derived daily predictions of rainfall and evaporation, for the period between 1889 and 211. This daily climate data was used as the rainfall and evaporation inputs to the WSBM of the Elimatta Coal Mine s Water Management System. 9.1 CATCHMENT AND LAND USE TYPE INPUTS Catchment areas were assigned to all storage elements in the WSBM of the Elimatta Coal Mine s Water Management System. Catchment areas were also assigned to the receiving waters elements in the model. The catchments are the dominant sources of water inputs to the various water storages in the WSBM. Water inputs to the WSBM can also occur as direct rainfall falling on the water surface of the various water storages. The catchment areas draining to the various water storages and to the receiving waters in the WSBM were calculated for selected times throughout the mine life, in accordance with the proposed mine staging plans (refer to Section 13.1 for details of the mine staging plans). Minserve provided 3D topographic models of the proposed mine ground surface, corresponding to the timing on the mine staging plans. These 3D topographic models were superimposed on the 3D surface model of the existing landform to create composite 3D topographic models of the ground surfaces draining to the Elimatta MLAs, at each mine stage. The composite 3D topographic models were used as base mapping to determine the boundaries of the various catchments draining to the water storage dams and pits throughout the extent of the Elimatta MLAs. The composite 3D topographic models were also used to determine catchment boundaries for the Horse Creek receiving waters. Document : JBT24-RPT6C-WaterManagementStrategy.docx PAGE 198
34 Catchment boundaries were determined corresponding to proposed mine staging years 1, 3, 5, 8, 1, 15, 2, 25 and end of mining at year 3. The Minserve mine staging plans were also used to determine the breakdown of each mine affected catchment into the various land use types. The catchment areas input to the various storage elements of the WSBM included the area of the water storages, plus the external catchment areas which drained to the storages. This was done as the surface area of the stored water in the storages will fluctuate throughout the model simulation, as water comes and goes from the storage. To account for this fluctuation, the WSBM was configured to calculate the net residual catchment area draining to each water storage, at every time step in the simulation, in order to avoid double counting of the water surface area in the storage. Each catchment represented in the WSBM was configured to include runoff from 4 different catchment land use types. These 4 land use types included natural land use, hard stand land use, spoil land use and rehabilitated land use. As noted in Section 6. -, the land use throughout the proposed Elimatta Coal Mine is expected to vary and will evolve in accordance with the timing of the mine staging plans. On the basis of the types of land use evident at similar coal mines throughout central Queensland, the land use throughout the Elimatta Coal Mine will typically include the areas of the following: Natural Land Use (includes all areas untouched by mining) Hard Stand Land Use (includes all high runoff surfaces such as haul roads, mine industrial areas, pit ramps, pit floors, pit high walls etc) Spoil Land Use (includes all areas containing spoil, such as re-shaped spoil piles, inpit spoil dumps, out of pit spoil dumps etc) Rehabilitated Land Use (includes all areas rehabilitated after mining is completed) 9.11 INCLUSION OF AWBM MODELLING CAPABILITY The AWBM (Australian Water Balance Model) which is incorporated into the CRC for Catchment Hydrology RRL software package, was used to derive the regional rainfall versus runoff relationships for all catchments in the WSBM of the Elimatta Coal Mine s Water Management System. This was done by replicating the AWBM calculation routines in the GoldSim model (refer to Section 6.3 for discussion on the AWBM). This approach then enabled the catchment inputs to the GoldSim model to mimic the AWBM input parameters for each different land use type. The adopted AWBM parameters for each of the 4 different catchment land use types represented in the WSBM of the Elimatta Coal Mine s Water Management System are discussed in Section 6.15 and are presented in Table The WSBM was configured to calculate a unit area runoff (mm/day) for each different land use type, using the AWBM parameters corresponding to that land use type and the corresponding climate data. The model then calculated the catchment runoff for each land use type, as the product of the unit area runoff rate and the corresponding catchment area. For each storage element or receiving water element in the WSBM, the combined catchment runoff for that element was then calculated by summing the separate catchment runoff components for each land use type. Document : JBT24-RPT6C-WaterManagementStrategy.docx PAGE 199
35 9.12 EXTERNAL WATER SUPPLY INPUTS Northern Energy Corporation Ltd As noted in Section 8.6, Northern Energy Corporation Ltd has advised that the proposed external water supply for the will be sourced from third party commercial water suppliers. Initially, the external water supply will be treated groundwater by-product resulting from dewatering operations associated with coal seam gas extraction. Once construction of the proposed Nathan Dam is completed, the external water supply will instead be sourced from Nathan Dam. The adopted external supply rate input to the WSBM of the Elimatta Coal Mine s Water Management System was 2,5 ML/a. The entire external water supply was input to raw water dam RW1 in the WSBM. The external water supply will be pumped to raw water dam RW1 and will be supplied to the Elimatta Coal Mine on a take or pay basis. If the stored water levels in raw water dam RW reached capacity during the simulation, the external water supply into the dam was halted until freeboard was again available GROUNDWATER SEEPAGE INPUTS Groundwater seepage inflows to the Elimatta pits were calculated by Australasian Groundwater and Environment Pty Ltd (AGE). The calculated seepage rates were provided in the form of a spread sheet listing drainage into the various pits at mining years 1 to 35. These seepage rates were converted into corresponding daily seepage rates into each pit, for mine staging years 1, 3, 5, 8, 1, 15, 2, 25 and at the end of mining in year 3. Table 9-4 summarises the groundwater seepage inflows input to the mine pits in the WSBM of the Elimatta Coal Mine s Water Management System. Table 9-4 : Groundwater Seepage Inflows to the Elimatta WSBM Mine Staging Year North Pit (Pit_N) Groundwater Seepage Inflows (ML/d) West Pit (Pit_W) East Pit (Pit_E1) 1 East Pit (Pit_E2) Document : JBT24-RPT6C-WaterManagementStrategy.docx PAGE 2
36 Mine Staging Year North Pit (Pit_N) Groundwater Seepage Inflows (ML/d) West Pit (Pit_W) East Pit (Pit_E1) 1 East Pit (Pit_E2) Notes : 1. AGE provided groundwater seepage calculations for the combined east pit. As the WSBM modelled the east pit as 2 separate pits E1 and E2, the combined seepage inflows were split to provide seepage inflows to pits E1 and E2, based on the relative volume of each pit, at each mine staging snap shot SALT LOADING INPUTS For all catchments in the WSBM of the Elimatta Coal Mine s Water Management System, the salt loading inputs were determined using typical TDS values corresponding to the various different land use types. This approach allowed the model to vary the salt load entering the model, depending on the type of catchment being represented and on the rate of inflow from that catchment. The salt load for each different catchment land use type was calculated as the product of the runoff salinity and the runoff volume. For each storage element or receiving water element in the WSBM, the combined salt loading for that element was then calculated by summing the separate salt load components for each land use type GROUNDWATER SALINITY (TDS) WSBM inputs of salt loading associated with the groundwater seepage inflows to the pits were sourced from the groundwater salinity measurements undertaken by Streamline Hydro Pty Ltd through the period October 29 to July 211. As noted in Section 3.8, throughout the period of the monitoring program, StreamLine Hydro measured the groundwater salinity of the Walloon coal measures at 12 bore hole locations. The results of those salinity measurements were used as the basis for the selection of salt loading corresponding to groundwater seepage into the Elimatta pits. The average of the results of the groundwater salinity measurements for the Walloon coal measures were used as the basis for the selection of salt loading corresponding to groundwater seepage into the pits. The adopted WSBM salt loading rate for the groundwater seepage was for a TDS of 5,5 mg/l, which corresponded to an approximate EC value of 9,5 µs/cm HARD STAND LAND USE - SURFACE WATER CATCHMENT SALINITY (TDS) WSBM inputs of salt loading associated with the runoff from catchments comprising hard stand land use types were sourced from the groundwater salinity measurements undertaken by Streamline Hydro Pty Ltd through the period October 29 to July 211. As noted in Section 3.8, throughout the period of the monitoring program, StreamLine Hydro measured the groundwater salinity of the Walloon coal measures at 12 bore hole locations. During that Document : JBT24-RPT6C-WaterManagementStrategy.docx PAGE 21
37 same period, measurements of the groundwater salinity of the alluvium were also monitored at an additional 9 bore hole locations. The average of the results of the alluvium salinity measurements were used as the basis for the selection of salt loading corresponding to runoff from catchments comprising hard stand land use types. The rationale for selecting the average alluvium groundwater salinity as being representative of the runoff from hard stand land use was primarily that this material type would typically be used as bedding material for hard stand areas. Runoff from hard stand areas would also be expected to generate much lower salt loads compared to the Walloon coal measures. This is consistent with the observation that catchments comprising hard stand land use types will comprise high runoff surfaces such as haul roads, mine industrial areas, pit ramps, pit floors, pit high walls. All these areas would be expected to have relatively high salt loading due to the presence of residual mineral salts present in residual coal fines and residual overburden and spoil material. The adopted WSBM salt loading rate for catchments comprising hard stand land use types was for a TDS of 1,4 mg/l, which corresponded to an approximate EC value of 2,3 µs/cm SPOIL LAND USE SURFACE WATER CATCHMENT SALINITY (TDS) WSBM inputs of salt loading associated with the runoff from catchments comprising spoil land use types were sourced from the groundwater salinity measurements undertaken by Streamline Hydro Pty Ltd through the period October 29 to July 211. As noted in Section 3.8, throughout the period of the monitoring program, StreamLine Hydro measured the groundwater salinity of the alluvium at 9 bore hole locations. The average of the groundwater salinity measurements for the alluvium, plus the average natural catchment surface water salinity measurements, were used as the basis for the selection of salt loading corresponding to runoff from catchments comprising spoil land use types. The rationale for selecting the average salinity of groundwater in the alluvium, plus the average natural catchment salinity, as being representative of the runoff from spoil land use was primarily that the salt loading from this land use type would be expected to be consistent with the alluvium and the top soils, as the material comprising the overburden and spoil dumps will be made up of large volumes of the alluvium material. This is consistent with the general observations from similar coal mines in central Queensland. The water quality monitoring results from similar mines typically indicate that the water contained in sediment dams which receive runoff from catchments comprising spoil land use types, have elevated salinity levels which are certainly higher than the salinity levels in natural watercourses, but are lower than the salinity levels of pit seepage water. Runoff from spoil land use types would be certainly expected to have elevated salt loading due to the presence of residual mineral salts which would have leached from the groundwater in the alluvium. The adopted WSBM salt loading rate for catchments comprising spoil land use types was for a TDS of 9 mg/l, which corresponded to an approximate EC value of 1,3 µs/cm NATURAL LAND USE SURFACE WATER CATCHMENT SALINITY (TDS) WSBM inputs of salt loading associated with the runoff from catchments comprising natural land use types, were sourced from the EC versus flow interaction diagrams prepared for the Document : JBT24-RPT6C-WaterManagementStrategy.docx PAGE 22
38 Dawson River at Utopia Downs (refer to Section 3.7.3) and for the Dawson River at Taroom (refer to Section The adopted EC versus flow relationship for natural catchments, including that of Horse Creek, was based on the Dawson River relationships, and comprised a power function as follows: EC (µs/cm) = 35 x (Horse Creek Runoff) (ML/day) -.8 The TDS value was then determined using a generic formula for conversion of EC to TDS, as follows: TDS (mg/l) =.67 x EC (µs/cm) REHABILITATED LAND USE SURFACE WATER CATCHMENT SALINITY (TDS) WSBM inputs of salt loading associated with the runoff from catchments comprising rehabilitated land use types, were selected to be identical to those adopted for natural land use catchments EXTERNAL WATER SUPPLY SALINITY (TDS) The proposed external water supply for the will be sourced from third party commercial water suppliers. Initially, the external water supply will be treated groundwater by-product resulting from dewatering operations associated with coal seam gas extraction. Once construction of the proposed Nathan Dam is completed, the external water supply will instead be sourced from Nathan Dam. The adopted WSBM salt loading rate for the external water supply pumped into raw water dam RW1, was for a TDS of 2 mg/l, which corresponded to an approximate Electrical Conductivity EC value of 3 µs/cm. (refer to Section for details). Document : JBT24-RPT6C-WaterManagementStrategy.docx PAGE 23
39 9.15 MINE PIT INPUTS Northern Energy Corporation Ltd Mine pits were represented as storages in the WSBM of the Elimatta Coal Mine s Water Management System. In the WSBM, the physical characteristics of the pit storages were defined by a maximum pit capacity and by stage storage curves which related surface area to storage volume. The stage storage curves prepared for each pit were determined for selected times throughout the mine s life, in accordance with the proposed mine staging plans (refer to Section 13.1 for details of the mine staging plans). As noted in Section 9.1, Minserve provided 3D topographic models of the proposed mine ground surface, corresponding to the timing on the mine staging plans. A series of composite 3D topographic models were constructed, representing the combined natural ground surface, superimposed with the proposed mined ground surface, at each mine stage. The composite 3D topographic models were used to prepare the stage storage curves for each mine pit, corresponding to the proposed mine staging years 1, 3, 5, 8, 1, 15, 2, 25 and end of mining at year 3. The WSBM representation of the various inputs and outputs was similar for all the mine pits in the model. For each mine pit, the model included the following capabilities: Stage storage curve to define the storage characteristics Storage capacity to define the pit overflow limit Direct rainfall inputs onto the water storage area in the pit Evaporation losses from the water storage area in the pit Groundwater seepage inflows to the pit Catchment runoff (from 4 land use types) inputs to the pit Floor sump capacity excavated below the pit floor for pit dewatering purposes Pit dewatering pump turn on based on water volume in the pit Pit dewatering pump out rate from the pit to an environmental dam Pit dewatering pump shut off based on current freeboard in receiving dam Uncontrolled overflows from the pit to Horse Creek receiving waters Water mass balance accounting of all inflows and outflows from the pit storage Salt mass balance accounting of all inflows and outflows from the pit storage Calculation of TDS of water in the pit For all mine pits, pumped dewatering is modelled as a pumped transfer from the pit to an environmental dam, where the water is then stored and is available for re-use on the mine site. Prior to the pit dewatering, the model checks to see if the downstream environmental dam has any available freeboard below the pit s capacity. If freeboard is available in the dam, then dewatering is permitted and the volume pumped is set to the minimum of the available freeboard volume, or the pumping volume capacity. If no freeboard is available in the dam, then dewatering from the pit is not permitted. All mine pits include a low level sump excavated into the pit floor. This pit floor sump provided a small water storage in the bottom of the pit and its purpose was to minimise the Document : JBT24-RPT6C-WaterManagementStrategy.docx PAGE 24

40 effects of nuisance flooding in the bottom of the pit, thereby reducing the risk of pit inundation and increasing the time that the pit would be available for mining operations. The size of the pit floor sump was initially selected based on the volume that could be dewatered from the pit with 2 days of continuous pumping with the high wall pumps. However, the size of the pit floor sump and the dewatering pump out rate were optimised using the GoldSim WSBM of the water management system. The target risk for acceptable availability of the pit floor was set at the 8 percentile climate risk. The pit floor sump volume and the dewatering pump out rate were therefore chosen to ensure that the capacity of the pit floor sump was not exceeded for all model simulations up to and including the 8percentile climate risk. Figure 9.3 illustrates the GoldSim model representation of a typical mine pit in the WSBM of the Water Management System. This figure shows the layout of the individual GoldSim elements used to model the water balance and the salt balance of a typical mine pit in the model. The arrow connections illustrate where information is being taken from throughout the model. Figure 9.3 : GoldSim Model Representation of a Typical Mine Pit Document : JBT24-RPT6C-WaterManagementStrategy.docx PAGE 25
41 MINE PIT E1 INPUTS Mine pit E1 is located in the north eastern portion of MLA WSBM inputs specific to mine pit E1 are summarised in Table 9-5. Uncontrolled overflows from this pit were directed to the Horse Creek receiving waters, represented as model element HorseCk_Mid_Sim in the WSBM. However, review of the model simulation results indicated that this pit did not overflows in any of the modelled climate simulations investigated for this project. Statistical assessments of the GoldSim WSBM simulation results for this mine pit are presented in Section Table 9-5 : WSBM Inputs for Mine Pit E1 Mine Staging Year Pit Capacity (ML) 1 Floor Sump Capacity (ML) Dewatering Rate (L/s) Dewatering Destination Env Dam EV Env Dam EV Env Dam EV Env Dam EV Env Dam EV Env Dam EV Env Dam EV Env Dam EV Env Dam EV2 Notes : 1. At mine year 3, pit E1 and pit E2 join to become a final void located in the south east corner of MLA This transition is represented in the GoldSim model by retaining pit E1, whereas pit E2 becomes non-functional at mine year 3. Document : JBT24-RPT6C-WaterManagementStrategy.docx PAGE 26
42 MINE PIT E2 INPUTS Mine pit E2 is located in the south eastern portion of MLA WSBM inputs specific to mine pit E2 are summarised in Table 9-6. Uncontrolled overflows from this pit were directed to the Horse Creek receiving waters, represented as model element HorseCk_Mid_Sim in the WSBM. However, review of the model simulation results indicated that this pit did not overflows in any of the modelled climate simulations investigated for this project. Statistical assessments of the GoldSim WSBM simulation results for this mine pit are presented in Section Table 9-6 : WSBM Inputs for Mine Pit E2 Mine Staging Year Pit Capacity (ML) 1 Floor Sump Capacity (ML) Dewatering Rate (L/s) Dewatering Destination Env Dam EV Env Dam EV Env Dam EV Env Dam EV Env Dam EV Env Dam EV Env Dam EV Env Dam EV2 3 Notes : 1. At mine year 3, pit E1 and pit E2 join to become a final void located in the south east corner of MLA This transition is represented in the GoldSim model by retaining pit E1, whereas pit E2 becomes non-functional at mine year 3. Document : JBT24-RPT6C-WaterManagementStrategy.docx PAGE 27
43 MINE PIT N INPUTS Mine pit N is located in the northern portion of MLA WSBM inputs specific to mine pit N are summarised in Table 9-7. Uncontrolled overflows from this pit were directed to the Horse Creek receiving waters, represented as model element HorseCk_Mid_Sim in the WSBM. However, review of the model simulation results indicated that this pit did not overflows in any of the modelled climate simulations investigated for this project. Statistical assessments of the GoldSim WSBM simulation results for this mine pit are presented in Section Table 9-7 : WSBM Inputs for Mine Pit N Mine Staging Year Pit Capacity (ML) 1 Floor Sump Capacity (ML) Dewatering Rate (L/s) Dewatering Destination Env Dam EV Env Dam EV Env Dam EV Env Dam EV Env Dam EV Notes : 1. After mine year 1, pit N ceases to be an operational pit and it transitions into an inpit tailings storage. This transition is represented in the GoldSim model by storage dam TDP, which becomes functional after mine year 1, whereas pit N becomes non-functional after mine year 1. Document : JBT24-RPT6C-WaterManagementStrategy.docx PAGE 28
44 MINE PIT W INPUTS Mine pit W is located in the south western portion of MLA WSBM inputs specific to mine pit W are summarised in Table 9-8. Uncontrolled overflows from this pit were directed to the Horse Creek receiving waters, represented as model element HorseCk_US_Sim in the WSBM. However, review of the model simulation results indicated that this pit did not overflows in any of the modelled climate simulations investigated for this project. Statistical assessments of the GoldSim WSBM simulation results for this mine pit are presented in Section. Table 9-8 : WSBM Inputs for Mine Pit W Mine Staging Year Pit Capacity (ML) 1 Floor Sump Capacity (ML) Dewatering Rate (L/s) Dewatering Destination Env Dam EV Env Dam EV Env Dam EV Env Dam EV Env Dam EV Env Dam EV Env Dam EV Env Dam EV3 Document : JBT24-RPT6C-WaterManagementStrategy.docx PAGE 29
45 9.16 WATER STORAGE DAM INPUTS PHYSICAL CHARACTERISTICS OF THE WATER STORAGE DAMS Water storage dams were represented as storages in the WSBM of the Elimatta Coal Mine s Water Management System. In the WSBM, the physical characteristics of the storage dams were defined by a maximum dam capacity and by stage storage curves which related surface area to storage volume. All the water storage dams were modelled with an emergency spillway and the maximum dam capacity was set as the storage volume below the level of the emergency spillway. The stage storage curves prepared for each dam were determined for selected times throughout the mine s life, in accordance with the proposed mine staging plans (refer to Section 13.1 for details of the mine staging plans). As noted in Section 9.1, Minserve provided 3D topographic models of the proposed mine ground surface, corresponding to the timing on the mine staging plans. A series of composite 3D topographic models were constructed, representing the combined natural ground surface, superimposed with the proposed mined ground surface, at each mine stage. The composite 3D topographic models were used to prepare the stage storage curves for raw water storage dams RW2, RW3 and RW4, corresponding to the proposed mine staging years 1, 3, 5, 8, 1, 15, 2, 25 and end of mining at year 3. This approach was adopted for these raw water dams, as these water storages are proposed to be formed by embankments upstream of the advancing mine pit high wall. These dams will be required to intercept local catchment runoff from small natural catchments, which would otherwise be unable to freely drain back into Horse Creek, around the advancing mine pit high wall. The boundaries of these small local catchments are largely contained to the boundary of Elimatta MLA The stage storage curves for the environmental dams EV1, EV2, EV3 and EV4, for the sediment dams SD1, SD2 and SD3 and for raw water dam RW1, were determined using a spread sheet which was macro coded to undertake balanced earthworks calculations of the dam s embankment volume versus the dam s excavated volume. This approach was adopted for these dams, as they are proposed to be formed primarily as excavated storages. Detailed design of the water storage dam embankments and excavation profiles will be undertaken during the detailed design phase. The results obtained from the water balance modelling have provided a robust understanding of the storage volumes required to ensure that uncontrolled overflows from these dams into the Horse Creek receiving waters are infrequent and limited in volume WSBM REPRESENTATION OF THE WATER STORAGE DAMS The WSBM representation of the various inputs and outputs was similar for all the water storage dams in the model. For each water storage dam, the model included the following capabilities: Stage storage curve to define the storage characteristics Storage capacity to define the dam overflow limit Direct rainfall inputs onto the water storage area in the dam Evaporation losses from the water storage area in the dam Document : JBT24-RPT6C-WaterManagementStrategy.docx PAGE 21


46 Catchment runoff (from 4 land use types) inputs to the dam Transfer pumping from the dam to a water usage demand releases from the dam to Horse Creek receiving waters release trigger volume in the dam, below which releases do not occur Uncontrolled overflows from the dam to Horse Creek receiving waters Water mass balance accounting of all inflows and outflows from the dam storage Salt mass balance accounting of all inflows and outflows from the dam storage Calculation of TDS of water in the dam Figure 9.4 illustrates the GoldSim model representation of a typical water storage dam in the WSBM of the Water Management System. This figure shows the layout of the individual GoldSim elements used to model the water balance and the salt balance of a typical water storage dam in the model. The arrow connections illustrate where information is being taken from throughout the model. Figure 9.4 : GoldSim Model Representation of a Typical Water Storage Dam Document : JBT24-RPT6C-WaterManagementStrategy.docx PAGE 211
47 PRIORITISED PUMPING FROM THE WATER STORAGE DAMS For each water storage dam within the WSBM of the Elimatta Coal Mine s Water Management System, the model was configured to allow for prioritised pumping from that water storage, to a number of different destinations. The WSBM accommodated this by attempting to pump the specified amount of water to each specified destination, in the priority order of each separate destination. For example, raw water dam RW1 was configured with 5 priority destinations. Running down the demand priority list from highest to lowest, the pumping destinations for that dam included the following: Priority 1 Destination Potable demand Priority 2 Destination CHPP demand Priority 3 Destination North water fill point demand Priority 4 Destination South water fill point demand Priority 5 Destination release to Horse Creek For each daily time step, the WSBM accommodated the pumping priorities by firstly attempting to pump the specified full amount of water to the number 1 priority destination (potable demand). If there was water remaining in the storage dam after that, the WSBM would then attempt to pump the specified full amount of water to the number 2 priority destination (CHPP demand). The model continues working its way down the list of priority destinations, until all the priority destinations have been satisfied, or until all the water is taken from the water storage, whatever comes first CONTROLLED RELEASE TRIGGERS FROM THE WATER STORAGE DAMS The adopted controlled release triggers from water storage dams within the Elimatta water management system have been determined using the recommendations contained in Model Water Conditions for Coal Mines in the Fitzroy Basin 212 (herein referred to as the Fitzroy Flow Release Manual 212), issued by the Department of Environment and Heritage Protection (DEHP). Section 8.7 documents the assessment of the flow release triggers appropriate to the Horse Creek watercourse. The resulting flow release triggers adopted for the Elimatta WSBM comprise three stage release triggers, based on no/low flows, medium flows and high flows in the Horse Creek receiving waters. The adopted flow release triggers are summarised in Table 9-9. Document : JBT24-RPT6C-WaterManagementStrategy.docx PAGE 212
48 Table 9-9 : Adopted Flow Release Triggers for Horse Creek Receiving Waters Release Trigger No/low flow in receiving waters OR Medium flow in receiving waters OR High flow in receiving waters Criteria Required to be Satisfied to Activate the Release Trigger Release only on the tail end of a flow event ie. Following a flow above the event trigger of 1. m 3 /s and when that flow falls back below 1. m 3 /s again AND Release duration is limited to 28 days after the trigger flow event ceases AND Maximum salinity of end of pipe release water in water storage of 38 µs/cm (TDS 25 mg/l) (Based on long term background 8 percentile value) AND The maximum release rate is.6 m 3 /s, (Same as the Medium1 flow release criteria) AND Maximum EC in stream of 7 µs/cm (469 mg/l) measured at the downstream mine boundary Medium1 flow release corresponds to a minimum event flow trigger of 1. m 3 /s, plus a maximum salinity of end of pipe release water in water storage of 15 µs/cm (1 mg/l) The corresponding maximum release rate is.6 m 3 /s AND Maximum EC in stream of 7 µs/cm (469 mg/l) measured at the downstream mine boundary OR Medium2 flow release corresponds to a minimum event flow trigger of 2. m 3 /s, plus a maximum salinity of end of pipe release water in water storage of 35 µs/cm (2345 mg/l) The corresponding maximum release rate is.4 m 3 /s AND Maximum EC in stream of 7 µs/cm (469 mg/l) measured at the downstream mine boundary High flow release corresponds to a minimum event flow trigger of 4. m 3 /s, plus a maximum salinity of end of pipe release water in water storage of 1, µs/cm (67 mg/l) The corresponding maximum release rate is.2 m 3 /s AND Maximum EC in stream of 7 µs/cm (469 mg/l) measured at the downstream mine boundary Document : JBT24-RPT6C-WaterManagementStrategy.docx PAGE 213
49 ENVIRONMENTAL DAM EV1 INPUTS Environmental dam EV1 is located in the northern portion of MLA 5254 near to pit N. Due to the predicted high salinity (median TDS 3,7 mg/l) of the water stored in the dam, this dam will be classified with a significant hazard category, in accordance with DEHP s Manual for Assessing Hazard Categories and Hydraulic Performance of Dams dated 212. WSBM inputs specific to environmental dam EV1 are summarised in Table 9-1. flow releases and uncontrolled overflows from this dam were directed to the Horse Creek receiving waters, represented as model element HorseCk_Mid_Sim in the WSBM. The prioritised pumping order for this dam was as follows: Priority 1 Destination South water fill point demand Priority 2 Destination release to Horse Creek Table 9-1 : WSBM Inputs for Environmental Dam EV1 Mine Staging Year Dam Capacity (ML) 1 Transfer Pumping Rate (L/s) Transfer Pumping Destination Release Rate (L/s) 2 Release Trigger Volume (%) South Water Fill Point WFPS Notes : 1. After mine year 1 Pit N will cease to be an operational pit and it will transition to an in-pit tailings storage facility. Environmental dam EV1 will be decommissioned at that time. This decommissioning is represented in the GoldSim model by changing the storage characteristics of the dam at mine year releases are only permitted if they satisfy DEHP s flow release criteria for coal mines in the Fitzroy Basin, as discussed in Section The controlled release trigger volume controls whether releases will be permitted from the dam, based on how much water is currently stored in the dam. This feature was added to the WSBM to limit the release of water from the dam, if the water levels are already low, thereby improving the supply reliability to water demands supplied from this dam. Statistical assessments of the GoldSim WSBM simulation results for this dam are presented in Section Document : JBT24-RPT6C-WaterManagementStrategy.docx PAGE 214
50 ENVIRONMENTAL DAM EV2 Environmental dam EV2 is located in the north eastern portion of MLA 5254 near to pit E1. Due to the predicted high salinity (median TDS 5,65 mg/l) of the water stored in the dam, this dam will be classified with a significant hazard category, in accordance with DEHP s Manual for Assessing Hazard Categories and Hydraulic Performance of Dams dated 212. WSBM inputs specific to environmental dam EV2 are summarised in Table flow releases and uncontrolled overflows from this dam were directed to the Horse Creek receiving waters, represented as model element HorseCk_Mid_Sim in the WSBM. The prioritised pumping order for this dam was as follows: Priority 1 Destination South water fill point demand Priority 2 Destination release to Horse Creek Table 9-11 : WSBM Inputs for Environmental Dam EV2 Mine Staging Year Dam Capacity (ML) Transfer Pumping Rate (L/s) Transfer Pumping Destination Release Rate (L/s) 1 Release Trigger Volume (%) South Water Fill Point WFPS1 6 Notes : 1. releases are only permitted if they satisfy DEHP s flow release criteria for coal mines in the Fitzroy Basin, as discussed in Section The controlled release trigger volume controls whether releases will be permitted from the dam, based on how much water is currently stored in the dam. This feature was added to the WSBM to limit the release of water from the dam, if the water levels are already low, thereby improving the supply reliability to water demands supplied from this dam. Statistical assessments of the GoldSim WSBM simulation results for this dam are presented in Section Document : JBT24-RPT6C-WaterManagementStrategy.docx PAGE 215
51 ENVIRONMENTAL DAM EV3 Environmental dam EV3 is located in the south western portion of MLA 5254 near to pit W1. Due to the predicted high salinity (median TDS 4,767 mg/l) of the water stored in the dam, this dam will be classified with a significant hazard category, in accordance with DEHP s Manual for Assessing Hazard Categories and Hydraulic Performance of Dams dated 212. WSBM inputs specific to environmental dam EV3 are summarised in Table flow releases and uncontrolled overflows from this dam were directed to the Horse Creek receiving waters, represented as model element HorseCk_US_Sim in the WSBM. The prioritised pumping order for this dam was as follows: Priority 1 Destination South water fill point demand Priority 2 Destination release to Horse Creek Table 9-12 : WSBM Inputs for Environmental Dam EV3 Mine Staging Year Dam Capacity (ML) 1 Transfer Pumping Rate (L/s) Transfer Pumping Destination Release Rate (L/s) 2 Release Trigger Volume (%) South Water Fill Point WFPS1 6 Notes : 1. Environmental dam EV3 is only required starting at mine year 3. This transition is represented in the GoldSim model by changing the storage characteristics of the dam at mine year releases are only permitted if they satisfy DEHP s flow release criteria for coal mines in the Fitzroy Basin, as discussed in Section The controlled release trigger volume controls whether releases will be permitted from the dam, based on how much water is currently stored in the dam. This feature was added to the WSBM to limit the release of water from the dam, if the water levels are already low, thereby improving the supply reliability to water demands supplied from this dam. Statistical assessments of the GoldSim WSBM simulation results for this dam are presented in Section Document : JBT24-RPT6C-WaterManagementStrategy.docx PAGE 216
52 ENVIRONMENTAL DAM EV4 Environmental dam EV4 is located in the south eastern portion of MLA 527 near to the MIA. This environmental dam will receive contaminated runoff from the MIA catchments. Due to the predicted high salinity (median TDS 3,964 mg/l) of the water stored in the dam, this dam will be classified with a significant hazard category, in accordance with DEHP s Manual for Assessing Hazard Categories and Hydraulic Performance of Dams dated 212. WSBM inputs specific to environmental dam EV4 are summarised in Table flow releases and uncontrolled overflows from this dam were directed to the Horse Creek receiving waters, represented as model element HorseCk_DS_Sim in the WSBM. The prioritised pumping order for this dam was as follows: Priority 1 Destination CHPP water demand Priority 2 Destination North water fill point demand Priority 3 Destination release to Horse Creek Table 9-13 : WSBM Inputs for Environmental Dam EV4 Mine Staging Year Dam Capacity (ML) Transfer Pumping Rate (L/s) Transfer Pumping Destination Release Rate (L/s) 1 Release Trigger Volume (%) North Water Fill Point WFPN1 6 2 Notes : 1. releases are only permitted if they satisfy DEHP s flow release criteria for coal mines in the Fitzroy Basin, as discussed in Section The controlled release trigger volume controls whether releases will be permitted from the dam, based on how much water is currently stored in the dam. This feature was added to the WSBM to limit the release of water from the dam, if the water levels are already low, thereby improving the supply reliability to water demands supplied from this dam. Statistical assessments of the GoldSim WSBM simulation results for this dam are presented in Section Document : JBT24-RPT6C-WaterManagementStrategy.docx PAGE 217
53 TAILINGS DAM TDN Tailings dam TDN is located in the northern portion of MLA 527, west of the MIA. Due to the predicted high salinity (median TDS 2,54 mg/l) of the water stored in the dam, this dam will be classified with a significant hazard category, in accordance with DEHP s Manual for Assessing Hazard Categories and Hydraulic Performance of Dams dated 212. WSBM inputs specific to tailings dam TDN are summarised in Table releases and uncontrolled overflows from this dam were directed to the Horse Creek receiving waters, represented as model element HorseCk_DS_Sim in the WSBM. The prioritised pumping order for this dam was as follows: Priority 1 Destination CHPP water demand Priority 2 Destination North water fill point demand Priority 3 Destination South water fill point demand Priority 4 Destination release to Horse Creek Table 9-14 : WSBM Inputs for Tailings Dam TDN Mine Staging Year Dam Capacity (ML) 1 Transfer Pumping Rate (L/s) Transfer Pumping Destination Release Rate (L/s) 2 Release Trigger Volume (%) CHPP 1 1 North Water Fill Point WFPN1 South Water Fill Point WFPN1 1 CHPP 1 1 North Water Fill Point WFPN1 South Water Fill Point WFPN1 Notes : 1. The northern tailings dam TDN is planned to receive fine tailings between mine years 1 and 6, at which stage this tailings dam will have reached its capacity. A depth of at least 3 metres will be left between the final tailings surface and the dam s crest level, to facilitate the capping and stabilisation of the captured tailings, prior to the end of mining. In the meantime, this 3 metre depth will still be available for the capture of local catchment runoff in the dam. Document : JBT24-RPT6C-WaterManagementStrategy.docx PAGE 218
54 2. releases are only permitted if they satisfy DEHP s flow release criteria for coal mines in the Fitzroy Basin, as discussed in Section The controlled release trigger volume controls whether releases will be permitted from the dam, based on how much water is currently stored in the dam. This feature was added to the WSBM to limit the release of water from the dam, if the water levels are already low, thereby improving the supply reliability to water demands supplied from this dam. Statistical assessments of the GoldSim WSBM simulation results for this dam are presented in Section Document : JBT24-RPT6C-WaterManagementStrategy.docx PAGE 219
55 TAILINGS DAM TDNA Tailings dam TDNA is located in the northern portion of MLA 527, west of the MIA. Due to the predicted high salinity (median TDS 2,54 mg/l) of the water stored in the dam, this dam will be classified with a significant hazard category, in accordance with DEHP s Manual for Assessing Hazard Categories and Hydraulic Performance of Dams dated 212. WSBM inputs specific to tailings dam TDS are summarised in Table releases and uncontrolled overflows from this dam were directed to the Horse Creek receiving waters, represented as model element HorseCk_DS_Sim in the WSBM. The prioritised pumping order for this dam was as follows: Priority 1 Destination CHPP water demand Priority 2 Destination North water fill point demand Priority 3 Destination South water fill point demand Priority 4 Destination release to Horse Creek Table 9-15 : WSBM Inputs for Tailings Dam TDNA Mine Staging Year Dam Capacity (ML) 1 Transfer Pumping Rate (L/s) Transfer Pumping Destination Release Rate (L/s) 2 Release Trigger Volume (%) , ,45 1 CHPP 1 1 North Water Fill Point WFPN1 South Water Fill Point WFPN1 1 CHPP 1 1 North Water Fill Point WFPN1 South Water Fill Point WFPN1 Notes : 1. The northern alternative tailings dam TDNA is planned to receive fine tailings between mine years 6 and 1, at which stage this tailings dam will have reached its capacity. A depth of at least 3 metres will be left between the final tailings surface and the dam s crest level, to facilitate the capping and stabilisation of the captured tailings, prior to the end of mining. In the meantime, this 3 metre depth will still be available for the capture of local catchment runoff in the dam. Document : JBT24-RPT6C-WaterManagementStrategy.docx PAGE 22
56 2. releases are only permitted if they satisfy DEHP s flow release criteria for coal mines in the Fitzroy Basin, as discussed in Section The controlled release trigger volume controls whether releases will be permitted from the dam, based on how much water is currently stored in the dam. This feature was added to the WSBM to limit the release of water from the dam, if the water levels are already low, thereby improving the supply reliability to water demands supplied from this dam. Statistical assessments of the GoldSim WSBM simulation results for this dam are presented in Section Document : JBT24-RPT6C-WaterManagementStrategy.docx PAGE 221
57 TAILINGS DAM TDP Tailings dam TDP is actually pit N and is located in the northern portion of MLA After mine year 1, pit N ceases to be an operational pit and it transitions into an in-pit tailings storage. When the southern tailings dam TDS reaches its capacity in mine year 1, fine tailings will then be pumped to pit N. Pit N will then be able to accept fine tailings for the remainder of the mine s life, up to mine year 3. This transition is represented in the GoldSim WSBM by tailings dam TDP, which becomes functional after mine year 1, whereas pit N becomes non-functional after mine year 1. Due to the predicted high salinity (median TDS 3,1 mg/l) of the water stored in the dam, this dam will be classified with a significant hazard category, in accordance with DEHP s Manual for Assessing Hazard Categories and Hydraulic Performance of Dams dated 212. WSBM inputs specific to tailings dam TDP are summarised in Table releases and uncontrolled overflows from this dam were directed to the Horse Creek receiving waters, represented as model element HorseCk_DS_Sim in the WSBM. The prioritised pumping order for this dam was as follows: Priority 1 Destination CHPP water demand Priority 2 Destination North water fill point demand Priority 3 Destination South water fill point demand Priority 4 Destination release to Horse Creek Table 9-16 : WSBM Inputs for Tailings Dam TDP Mine Staging Year Dam Capacity (ML) 1 Transfer Pumping Rate (L/s) Transfer Pumping Destination Release Rate (L/s) 2 Release Trigger Volume (%) CHPP ,7 1, North Water Fill Point WFPN1 South Water Fill Point WFPN1 Notes : 1. Tailings dam TDP is actually pit N. Fine tailings will be pumped to pit N after mine year 1 and will accept all fine tailings up to the end of mining in mine year releases are only permitted if they satisfy DEHP s flow release criteria for coal mines in the Fitzroy Basin, as discussed in Section 8.7. Document : JBT24-RPT6C-WaterManagementStrategy.docx PAGE 222
58 3. The controlled release trigger volume controls whether releases will be permitted from the dam, based on how much water is currently stored in the dam. This feature was added to the WSBM to limit the release of water from the dam, if the water levels are already low, thereby improving the supply reliability to water demands supplied from this dam. Statistical assessments of the GoldSim WSBM simulation results for this dam are presented in Section Document : JBT24-RPT6C-WaterManagementStrategy.docx PAGE 223
59 SEDIMENT DAM SD1 Sediment dam SD1 is located in the northern portion of MLA 5254, near pit N. Based on the predicted low salinity (median TDS 1,194 mg/l) of the water stored in the dam, this dam will be not be classified as a hazardous dam, in accordance with DEHP s Manual for Assessing Hazard Categories and Hydraulic Performance of Dams dated 212. WSBM inputs specific to sediment dam SD1 are summarised in Table flow releases and uncontrolled overflows from this dam were directed to the Horse Creek receiving waters, represented as model element HorseCk_MID_Sim in the WSBM. The prioritised pumping order for this dam was as follows: Priority 1 Destination South water fill point demand Priority 2 Destination release to Horse Creek Table 9-17 : WSBM Inputs for Sediment Dam SD1 Mine Staging Year Dam Capacity (ML) Transfer Pumping Rate (L/s) Transfer Pumping Destination Release Rate (L/s) 1 Release Trigger Volume (%) South Water Fill Point WFPN1 Notes : 1. releases are only permitted if they satisfy DEHP s flow release criteria for coal mines in the Fitzroy Basin, as discussed in Section The controlled release trigger volume controls whether releases will be permitted from the dam, based on how much water is currently stored in the dam. This feature was added to the WSBM to limit the release of water from the dam, if the water levels are already low, thereby improving the supply reliability to water demands supplied from this dam. Statistical assessments of the GoldSim WSBM simulation results for this dam are presented in Section Document : JBT24-RPT6C-WaterManagementStrategy.docx PAGE 224
60 SEDIMENT DAM SD2 Sediment dam SD2 is located in the north eastern portion of MLA 5254, near pit E1. Due to the predicted low salinity (median TDS 1,566 mg/l) of the water stored in the dam, this dam will be not be classified as a hazardous dam, in accordance with DEHP s Manual for Assessing Hazard Categories and Hydraulic Performance of Dams dated 212. WSBM inputs specific to sediment dam SD2 are summarised in Table flow releases and uncontrolled overflows from this dam were directed to the Horse Creek receiving waters, represented as model element HorseCk_MID_Sim in the WSBM. The prioritised pumping order for this dam was as follows: Priority 1 Destination South water fill point demand Priority 2 Destination release to Horse Creek Table 9-18 : WSBM Inputs for Sediment Dam SD2 Mine Staging Year Dam Capacity (ML) Transfer Pumping Rate (L/s) Transfer Pumping Destination Release Rate (L/s) 1 Release Trigger Volume (%) South Water Fill Point WFPN1 Notes : 1. releases are only permitted if they satisfy DEHP s flow release criteria for coal mines in the Fitzroy Basin, as discussed in Section The controlled release trigger volume controls whether releases will be permitted from the dam, based on how much water is currently stored in the dam. This feature was added to the WSBM to limit the release of water from the dam, if the water levels are already low, thereby improving the supply reliability to water demands supplied from this dam. Statistical assessments of the GoldSim WSBM simulation results for this dam are presented in Section Document : JBT24-RPT6C-WaterManagementStrategy.docx PAGE 225
61 SEDIMENT DAM SD3 Sediment dam SD3 is located in the south western portion of MLA 5254, near pit W. Due to the predicted low salinity (median TDS 1,22 mg/l) of the water stored in the dam, this dam will be not be classified as a hazardous dam, in accordance with DEHP s Manual for Assessing Hazard Categories and Hydraulic Performance of Dams dated 212. WSBM inputs specific to sediment dam SD2 are summarised in Table flow releases and uncontrolled overflows from this dam were directed to the Horse Creek receiving waters, represented as model element HorseCk_MID_Sim in the WSBM. The prioritised pumping order for this dam was as follows: Priority 1 Destination South water fill point demand Priority 2 Destination release to Horse Creek Table 9-19 : WSBM Inputs for Sediment Dam SD3 Mine Staging Year Dam Capacity (ML) Transfer Pumping Rate (L/s) Transfer Pumping Destination Release Rate (L/s) 1 Release Trigger Volume (%) South Water Fill Point WFPN1 Notes : 1. releases are only permitted if they satisfy DEHP s flow release criteria for coal mines in the Fitzroy Basin, as discussed in Section The controlled release trigger volume controls whether releases will be permitted from the dam, based on how much water is currently stored in the dam. This feature was added to the WSBM to limit the release of water from the dam, if the water levels are already low, thereby improving the supply reliability to water demands supplied from this dam. Statistical assessments of the GoldSim WSBM simulation results for this dam are presented in Section Document : JBT24-RPT6C-WaterManagementStrategy.docx PAGE 226
62 RAW WATER DAM RW1 Raw water dam RW1 is located in the northern portion of MLA 527, north of the MIA and east of the tailings dams. WSBM inputs specific to raw water dam RW1 are summarised in Table 9-2. flow releases and uncontrolled overflows from this dam were directed to the Horse Creek receiving waters, represented as model element HorseCk_DS_Sim in the WSBM. The prioritised pumping order for this dam was as follows: Priority 1 Destination Potable demand Priority 2 Destination CHPP demand Priority 3 Destination North water fill point demand Priority 4 Destination South water fill point demand Priority 5 Destination release to Horse Creek Table 9-2 : WSBM Inputs for Hazardous Raw Water Dam RW1 Mine Staging Year Dam Capacity (ML) Transfer Pumping Rate (L/s) Transfer Pumping Destination Release Rate (L/s) 1 Release Trigger Volume (%) 2 3 Potable Demand 1 CHPP Demand North Water Fill Point WFPN1 1 South Water Fill Point WFPN1 Notes : 1. releases are only permitted if they satisfy DEHP s flow release criteria for coal mines in the Fitzroy Basin, as discussed in Section The controlled release trigger volume controls whether releases will be permitted from the dam, based on how much water is currently stored in the dam. This feature was added to the WSBM to limit the release of water from the dam, if the water levels are already low, thereby improving the supply reliability to water demands supplied from this dam. Statistical assessments of the GoldSim WSBM simulation results for this dam are presented in Section Document : JBT24-RPT6C-WaterManagementStrategy.docx PAGE 227
63 RAW WATER DAM RW2 Raw water dam RW2 is located in the south eastern portion of MLA 5254, east of pit E2. This dam will be located upstream of the advancing high wall for mine pit E2. The dam will only be required during mine years 3 to 25. Up to mine year 3, this natural catchment will freely drain to Horse Creek without any interference from the mine pits. However, at mine year 3, mine pit E2 will effectively trap this catchment upstream of the pit s high wall. Based on a review of the site s natural topography, it is proposed to construct a dam embankment across the gully upstream of the pit s high wall and capture the runoff from the local catchment at this location. A diversion channel will convey overflows from this dam north into Horse Creek, between pits E1 and E2. The boundary of this local catchment is largely contained within the boundary of Elimatta MLA Due to the eastern advance of the high wall for mine pit E2, the size of this local catchment will gradually reduce with time, until it will completely disappear after mine year 25. In the final mine landform at mine year 3, the dam will not be required, as the local catchment will be largely comprised of rehabilitated worked spoil and the final surface levels will freely grade west towards the Horse Creek watercourse. Based on the predicted low salinity (median TDS 48 mg/l) of the water stored in the dam, this dam will be not be classified as a hazardous dam, in accordance with DEHP s Manual for Assessing Hazard Categories and Hydraulic Performance of Dams dated 212. WSBM inputs specific to raw water dam RW2 are summarised in Table flow releases from this dam were directed to Horse Creek receiving waters, represented as model element HorseCk_MID_Sim in the WSBM. Uncontrolled overflows from this dam were directed to mine pit E2. The prioritised pumping order for this dam was as follows: Priority 1 Destination South water fill point demand Priority 2 Destination release to Horse Creek Table 9-21 : WSBM Inputs for Raw Water Dam RW2 Mine Staging Year Dam Capacity (ML) Transfer Pumping Rate (L/s) Transfer Pumping Destination Release Rate (L/s) 1 Release Trigger Volume (%) South Water Fill Point WFPN1 3 Document : JBT24-RPT6C-WaterManagementStrategy.docx PAGE 228
64 Notes : 1. releases are only permitted if they satisfy DEHP s flow release criteria for coal mines in the Fitzroy Basin, as discussed in Section The controlled release trigger volume controls whether releases will be permitted from the dam, based on how much water is currently stored in the dam. This feature was added to the WSBM to limit the release of water from the dam, if the water levels are already low, thereby improving the supply reliability to water demands supplied from this dam. Statistical assessments of the GoldSim WSBM simulation results for this dam are presented in Section Document : JBT24-RPT6C-WaterManagementStrategy.docx PAGE 229
65 RAW WATER DAM RW3 Raw water dam RW3 is located in the north eastern portion of MLA 5254, east of pit E1. This dam will be located upstream of the advancing high wall for mine pit E1. The dam will only be required during mine years 5 to 15. Up to mine year 5, this natural catchment will freely drain to Horse Creek without any interference from the mine pits. However, at mine year 5, mine pit E1 will effectively trap this catchment upstream of the pit s high wall. Based on a review of the site s natural topography, it is proposed to construct a dam embankment across the gully upstream of the pit s high wall and capture the runoff from the local catchment at this location. A diversion channel will convey overflows from this dam south into raw water dam RW2 to the east of pits E1 and E2. The boundary of this local catchment is largely contained within the boundary of Elimatta MLA Due to the eastern advance of the high wall for mine pit E1, the size of this local catchment will gradually reduce with time, until it will completely disappear after mine year 15. After mine year 15 the dam will not be required, as the local catchment will be largely comprised of rehabilitated worked spoil and the final surface levels will freely grade west towards the Horse Creek watercourse. Based on the predicted low salinity (median TDS 326 mg/l) of the water stored in the dam, this dam will be not be classified as a hazardous dam, in accordance with DEHP s Manual for Assessing Hazard Categories and Hydraulic Performance of Dams dated 212. WSBM inputs specific to raw water dam RW3 are summarised in Table flow releases from this dam were not permitted. Uncontrolled overflows from this dam were directed to mine pit E1. Table 9-22 : WSBM Inputs for Raw Water Dam RW3 Mine Staging Year Dam Capacity (ML) Transfer Pumping Rate (L/s) Transfer Pumping Destination Release Rate (L/s) 1 Release Trigger Volume (%) Raw Water Dam RW2 2-3 Document : JBT24-RPT6C-WaterManagementStrategy.docx PAGE 23
66 Notes : 1. releases are only permitted if they satisfy DEHP s flow release criteria for coal mines in the Fitzroy Basin, as discussed in Section The controlled release trigger volume controls whether releases will be permitted from the dam, based on how much water is currently stored in the dam. This feature was added to the WSBM to limit the release of water from the dam, if the water levels are already low, thereby improving the supply reliability to water demands supplied from this dam. Statistical assessments of the GoldSim WSBM simulation results for this dam are presented in Section Document : JBT24-RPT6C-WaterManagementStrategy.docx PAGE 231
67 RAW WATER DAM RW4 Raw water dam RW4 is located in the south western portion of MLA 5254, west of pit W. This dam will be located upstream of the advancing high wall for mine pit W. The dam will only be required during mine years 3 to 25. Up to mine year 3, this natural catchment will freely drain to Horse Creek without any interference from the mine pits. However, at mine year 3, mine pit W will effectively trap this catchment upstream of the pit s high wall. Based on a review of the site s natural topography, it is proposed to construct a dam embankment across the gully upstream of the pit s high wall and capture the runoff from the local catchment at this location. A diversion channel will convey overflows from this dam south into Horse Creek, between pit W and the out of pit spoil dump to the south of the pit. The boundary of this local catchment is largely contained within the boundary of Elimatta MLA Due to the western advance of the high wall for mine pit W, the size of this local catchment will gradually reduce with time, until it will completely disappear after mine year 25. In the final mine landform at mine year 3, the dam will not be required, as the local catchment will be largely comprised of rehabilitated worked spoil and the final surface levels will freely grade east towards the Horse Creek watercourse. Based on the predicted low salinity (median TDS 321 mg/l) of the water stored in the dam, this dam will be not be classified as a hazardous dam, in accordance with DEHP s Manual for Assessing Hazard Categories and Hydraulic Performance of Dams dated 212. WSBM inputs specific to raw water dam RW4 are summarised in Table flow releases from this dam were not permitted. Uncontrolled overflows from this dam were directed to mine pit W. Table 9-23 : WSBM Inputs for Raw Water Dam RW4 Mine Staging Year Dam Capacity (ML) Transfer Pumping Rate (L/s) Transfer Pumping Destination Release Rate (L/s) 1 Release Trigger Volume (%) Raw Water Dam RW2 2-3 Document : JBT24-RPT6C-WaterManagementStrategy.docx PAGE 232
68 Notes : 1. releases are only permitted if they satisfy DEHP s flow release criteria for coal mines in the Fitzroy Basin, as discussed in Section The controlled release trigger volume controls whether releases will be permitted from the dam, based on how much water is currently stored in the dam. This feature was added to the WSBM to limit the release of water from the dam, if the water levels are already low, thereby improving the supply reliability to water demands supplied from this dam. Statistical assessments of the GoldSim WSBM simulation results for this dam are presented in Section Document : JBT24-RPT6C-WaterManagementStrategy.docx PAGE 233
69 9.17 MINE CLOSURE MODEL INPUTS Northern Energy Corporation Ltd Two alternative mine closure models were prepared. As documented in the flood study report for the Horse Creek watercourse, it is proposed to divert the Horse Creek channel and floodplain to facilitate the mining operations. The Horse Creek diversion channel is proposed to be constructed through dumped spoil overburden. The first mine closure model did not include any interaction between the diverted Horse Creek watercourse and the final voids. This model assumed that the Horse Creek diversion channel would essentially be impermeable, with all creek flows being able to flow past the final voids, without any leakage into the voids. This model effectively modelled the Horse Creek channel as a pipe running through the final mine landform. The second mine closure model made allowance for some flow leakage from the diverted Horse Creek watercourse, through the dumped spoil and into the final voids on either side of the diverted creek channel. For both mine closure model simulations, the basic model layouts and inputs were identical. The only changes made to the models related to the specification of spoil permeability rates. For the impermeable case mine closure model, the spoil permeability was set at zero, so that no leakage was calculated from the creek into the final voids. For the permeable case mine closure model, the spoil permeability was varied from an initial value of 1. m/day to a value of.1 m/day after 1 years and it was retained at.1 m/day for the remainder of the simulation period. These permeability rates were adopted following a review of published seepage data for coal mine spoils (refer to References 13, 14 and 15 for details). The adopted permeability rates were deliberately chosen to be conservative, in order to assess how much seepage could potentially flow to the final voids and whether that seepage would result in overtopping of the final voids. The model results obtained using these permeability rates will most certainly be conservative. We would expect that the real answer will lie somewhere between the results quoted for the no leakage from Horse Creek sensitivity case and the leakage sensitivity case. In reality, there will be some natural leakage from the natural creek channel into the surrounding natural ground profile and this leakage has already been inherently allowed for in the AWBM runoff model parameters adopted for the catchment upstream of the mine site and the catchments through the mine site. The conservative sensitivity case reported herein has simply assumed that additional leakage would occur into the spoil from the diverted Horse Creek channel, whereas in fact, some of that leakage would have already been accounted for in the AWBM parameters adopted in the modelling COMMON INPUTS TO THE MINE CLOSURE MODELS At the end of mining in mine year 3, the only pits remaining will be the final voids for pit E1 and pit W. At that time, pit E2 will have amalgamated with pit E1 and this transition has been represented in the GoldSim model by pit E2 becoming non-functional after mine year 25. The final void for pit E1 will ultimately be located in the south east corner of the southern Elimatta MLA The final void for pit W will ultimately be located near the south west corner of the southern Elimatta MLA The final void for the north pit tailings storage is intended to be capped and rehabilitated by the end of mining. Document : JBT24-RPT6C-WaterManagementStrategy.docx PAGE 234
70 The close of mining case was modelling using the GoldSim WSBM which was originally prepared for the modelling of the Elimatta mine staging. The model was trimmed down for the mine closure case, because all the model elements which represented the environmental dams, the sediment dams, the raw water dams, the water demands, the external supply and all the transfer pumping and release arrangements, were simply not needed for the mine closure modelling. The mine closure model retained the pits, the Horse Creek receiving waters and the climate input data. Groundwater seepage was also retained in the WSBM, as the seepage inputs indicated that inflows to pit E1 would continue up until mine year 45, which is 15 years after the mine closure. No seepage was predicted to enter pits W or N after the closure of mining. The physical shape of the pits at mine year 3 was retained for all future years in the modelling. The model was run for a 123 climate simulation using the historic climate data for the period 1889 for 211. Figure 9.5 presents the overall GoldSim model representation of the Elimatta mine closure case, while Figure 9.6 presents the GoldSim model representation of the final void for the eastern pit. The same model layouts were used to model both mine closure simulations. Document : JBT24-RPT6C-WaterManagementStrategy.docx PAGE 235

71 Figure 9.5 : GoldSim Model Representation of the Elimatta Mine Closure Case Document : JBT24-RPT6C-WaterManagementStrategy.docx PAGE 236
 The permeable mine closure model represented flow leakage from the creek channel, through the spoil and into the final voids.")
72 Figure 9.6 : GoldSim Model Representation Final Void for the Eastern Pit MINE CLOSURE MODEL PERMEABLE HORSE CREEK DIVERSION (WITH LEAKAGE) The permeable mine closure model represented flow leakage from the creek channel, through the spoil and into the final voids. Leakage was assumed to occur throughout the entire 25 metre long section of the southern diversion channel, extending from the southern end of the diversion channel to the northern end of the western pit final void. The Darcy formula was used to calculate the potential leakage rate from the channel. The representative flow cross sectional area was based on the 25 metre length of the southern diversion channel, multiplied by the expected spoil depth alongside the diversion channel. The spoil depth was determined from the pit floor levels available from the various mine staging plans. The hydraulic gradient between the Horse Creek channel and the final void was determined by calculating the difference in water level in the creek and in the final void, for each day in the simulation. The water levels in the Horse Creek diversion were calculated by preparing a flow rating curve of the diversion channel, sourced from the flood modelling undertaken for the Horse Creek diversion. The water levels in the final voids were determined from the water balance model simulations of rainfall, runoff and seepage into the voids. As noted in Section 9.17, the adopted permeability for the dumped spoil material was varied from an initial value of 1. m/day to a value of.1 m/day after 1 years and it was retained at.1 m/day for the remainder of the simulation period. These permeability values were based on published data for various spoil types, with Australia and the USA. The reduction in the permeability over time was done to account for the expected compaction and caking of the spoil over time. Document : JBT24-RPT6C-WaterManagementStrategy.docx PAGE 237
73 A material delay was included in the model to represent the time taken for the leakage to flow through the spoil and into the final voids. The final void for the western pit will be located approximately 7 metres from the Horse Creek channel, so leakage into the void will occur reasonably soon after flows in the creek channel. However, the final void for the eastern pit will be located approximately 35 metres from the Horse Creek channel, so leakage into the void will occur much later than flows in the creek channel. Document : JBT24-RPT6C-WaterManagementStrategy.docx PAGE 238
74 1. - WATER BALANCE MODELLING RESULTS Northern Energy Corporation Ltd The GoldSim modelling undertaken for the Elimatta Coal Mine water management system utilised a daily time step, with each model realisation running for a 3 year mine life. To ensure that all possible mining stages were subjected to the full range of climate variability (123 years of available climate data), the GoldSim model was operated in Monte Carlo simulation mode, which enabled the model to run 93 separate model realisations, with each model realisation simulating a 3 year mine life, each subjected to different climate characteristics. The starting date for each successive model realisation was incremented by one year relative to the previous model realisation and the model was re-run. For example, the first model realisation was run for the 3 year simulation period spanning 1889 to 1918, while the second model realisation was run for the 3 year simulation period spanning 189 to This process was continued until all the 123 years of available climate data between 1889 and 211, had been evaluated in the GoldSim model. 1.1 STATISTICAL ANALYSIS OF GOLDSIM MODEL OUTPUT When run in the Monte Carlo simulation mode, GoldSim can create huge volumes of output. These model outputs were loaded into spread sheets to enable additional statistical analyses to be undertaken. The output data was analysed differently, depending on the type of output being evaluated ANALYSIS OF HORSE CREEK RUNOFF OUTPUT For each model realisation, Horse Creek daily runoff output was ranked from highest to lowest and then all zero flows were removed from the ranked data set. The flow threshold for the removal of zero flows was.1 ML/d. Flow percentiles were then calculated for all the remaining ranked daily flows, for all model realisations. This procedure was done for the premine GoldSim model, to establish the base case runoff percentiles for Horse Creek, for the post-mine GoldSim model to determine the mined case runoff percentiles and for the mine closure GoldSim model to determine the mine closure case runoff percentiles. An identical analysis procedure was followed for the evaluation of Horse Creek runoff quality (salinity) ANALYSIS OF PUMPED EXTERNAL WATER SUPPLY VOLUMES For each model realisation, the daily pumped volumes from the external water supply into Dam RW1 were analysed and the total volume of water pumped from the external water supply was summed for each year. Flow percentiles were then calculated for all the annual pumped volumes, for all model realisations. All annual pumping volumes were included in the percentile calculations, including any years when zero external water supply volumes were pumped ANALYSIS OF PUMPED VOLUMES TO DEMANDS For each model realisation, the daily pumped volumes to the demand were analysed and the total volume of water pumped to the demand was summed for each year. Flow percentiles were then calculated for all the annual pumped volumes, for all model realisations. All annual pumping volumes were included in the percentile calculations, including any years when zero flows were pumped. Document : JBT24-RPT6C-WaterManagementStrategy.docx PAGE 239
75 1.1.4 ANALYSIS OF DAYS WHEN DEMANDS ARE IN DEFICIT For each model realisation, the daily pumped volumes to the demand were analysed and the number of days of demand deficit were summed for each year. Flow percentiles were then calculated for all the annual demand deficit days, for all model realisations. All annual demand deficit days were included in the percentile calculations, including any years when zero flows were pumped. The maximum number of consecutive days of demand deficit was also evaluated, to identify the length of the critical period when the demand was unable to be satisfied. The maximum number of consecutive days of demand deficit was not calculated on an annual basis, it was calculated as the maximum value in any 3 year mine life simulation. A deficit day is counted as any day when the daily volume pumped to the demand is less than the full demand amount. For example, this means that a deficit day is counted even if the pumped daily volume was 95% of the full daily demand ANALYSIS OF DAM WATER STORAGE VOLUMES For each model realisation, the daily stored water volumes in the dam were analysed and the maximum stored water volume in the dam was calculated for each year. Flow percentiles were then calculated for all the annual maximum stored volumes, for all model realisations. All annual maximum stored volumes were included in the percentile calculations, including any years when the maximum stored volume in the dam was zero ANALYSIS OF DAM WATER STORAGE SALINITY (TDS) For each model realisation, the daily TDS values of the water stored in the dam were ranked from highest to lowest and all zero TDS values were removed from the ranked data set. The TDS threshold for the removal of zero TDS values was 1 mg/l, as the adopted minimum TDS for natural catchment runoff was 21 mg/l. TDS percentiles were then calculated for all the remaining ranked TDS values of the water stored in the dam, for all model realisations ANALYSIS OF UNCONTROLLED OVERFLOW VOLUMES FROM DAMS For each model realisation, the daily volumes of uncontrolled overflow from the dam were analysed and the total volume of uncontrolled overflow was summed for each year. Flow percentiles were then calculated for all the annual uncontrolled overflow volumes, for all model realisations. All annual uncontrolled overflow volumes were included in the percentile calculations, including any years when zero overflows occurred from the dam. The maximum overflow volume from the dam, occurring during a single spill event, was also evaluated, to identify the worst case for a single overflow event, throughout the mine s life. The maximum single overflow event volume was not calculated on an annual basis, it was calculated as the maximum value in any 3 year mine life simulation ANALYSIS OF UNCONTROLLED OVERFLOW SALINITY (TDS) FROM DAMS For each model realisation, the daily TDS values of the uncontrolled overflows from the dam were ranked from highest to lowest and all zero TDS values were removed from the ranked data set. The TDS threshold for the removal of zero TDS values was 1 mg/l, as the adopted minimum TDS for natural catchment runoff was 21 mg/l. TDS percentiles were then calculated for all the remaining ranked TDS values of the uncontrolled overflows from the dam, for all model realisations. Document : JBT24-RPT6C-WaterManagementStrategy.docx PAGE 24
76 1.1.9 ANALYSIS OF DAYS WHEN UNCONTROLLED OVERFLOW OCCURS For each model realisation, the daily volumes of uncontrolled overflow were analysed and the number of days of uncontrolled overflow were summed for each year. Flow percentiles were then calculated for all the annual uncontrolled overflow days, for all model realisations. All annual uncontrolled overflow days were included in the percentile calculations, including any years when zero overflows occurred from the dam ANALYSIS OF CONTROLLED RELEASE VOLUMES FROM DAMS For each model realisation, the daily volumes of controlled release from the dam were analysed and the total volume of controlled release was summed for each year. Flow percentiles were then calculated for all the annual controlled release volumes, for all model realisations. All annual controlled release volumes were included in the percentile calculations, including any years when zero releases occurred from the dam ANALYSIS OF CONTROLLED RELEASE SALINITY (TDS) FROM DAMS For each model realisation, the daily TDS values of the controlled releases from the dam were ranked from highest to lowest and all zero TDS values were removed from the ranked data set. The TDS threshold for the removal of zero TDS values was 1 mg/l, as the adopted minimum TDS for natural catchment runoff was 21 mg/l. TDS percentiles were then calculated for all the remaining ranked TDS values of the controlled releases from the dam, for all model realisations ANALYSIS OF DAYS WHEN CONTROLLED RELEASE OCCURS For each model realisation, the daily volumes of controlled release were analysed and the number of days of controlled release were summed for each year. Flow percentiles were then calculated for all the annual controlled release days, for all model realisations. All annual controlled release days were included in the percentile calculations, including any years when zero releases occurred from the dam ANALYSIS OF FLOODED PIT FLOOR SUMP VOLUMES For each model realisation, the daily stored water volumes in the pit were analysed, the volume of water overtopping the capacity of the pit floor sump was calculated and the pit floor sump overtopping volume was summed for each year. Flow percentiles were then calculated for all the annual pit sump overtopping volumes, for all model realisations. All annual pit sump overtopping volumes were included in the percentile calculations, including any years when the pit floor sump was not overtopped ANALYSIS OF DAYS WHEN PIT FLOOR SUMP IS FLOODED For each model realisation, the daily stored water volumes in the pit were analysed and the number of days when the pit floor sump was overtopped were summed for each year. Flow percentiles were then calculated for all the annual pit sump overtopping days, for all model realisations. All annual pit sump overtopping days were included in the percentile calculations, including any years when the pit floor sump was not overtopped. The maximum number of consecutive days of pit floor sump overtopping was also evaluated, to identify the length of the critical period when the pit floor would be inundated and mining operations would therefore be halted. The maximum number of consecutive days of sump Document : JBT24-RPT6C-WaterManagementStrategy.docx PAGE 241
77 overtopping was not calculated on an annual basis, it was calculated as the maximum value in any 3 year mine life simulation ANALYSIS OF PIT DEWATERING PUMP-OUT VOLUMES For each model realisation, the daily volumes of pumped pit dewatering were analysed and the pit dewatering volume was summed for each year. Flow percentiles were then calculated for all the annual pit dewatering volumes, for all model realisations. All annual pit dewatering volumes were included in the percentile calculations, including any years when the pit dewatering volume was zero. Document : JBT24-RPT6C-WaterManagementStrategy.docx PAGE 242
78 1.2 DOWNSTREAM IMPACTS TO HORSE CREEK Northern Energy Corporation Ltd The water and salt balance modelling undertaken for the proposed Elimatta Coal Mine Development has indicated that the proposed mine will have an impact on flow rates and water quality (salinity) in Horse Creek immediately downstream of the mine site. However, these impacts are predicted to be very small, with the predicted changes to the flow regime being well within the range of natural climate variability for the watercourse AFFECTED CATCHMENT AREAS Table 1-1 summarises the overall catchment areas which are predicted to be affected by mining associated with the. The combined area of the catchments draining to the Elimatta dams and pits includes the surface area of the dams and pits. As noted in this table, the overall area of catchment affected by mining varies depending on the mine staging year, with the maximum affected area occurring at mine year 25. The overall proportion of catchment affected by mining is predicted to rise from 1.2% in mine year 1, peak at 3.4% at mine year 25 and then fall back to 1.6% at mine year 3. Table 1-1 : Overall Catchment Areas Impacted by Elimatta Coal Mine Mine Staging Year Horse Creek Catchment Upstream of Elimatta Mine Site (Excludes Mine Site Catchments) (ha) Combined Area of Catchments Draining to all Elimatta Dams and Pits (Includes Dams and Pits) (ha) Horse Creek Catchment Downstream of Elimatta Mine Site (Includes Mine Site Catchments) (ha) Proportion of Horse Creek Catchment Affected by Elimatta Mine Site (To Downstream side of Mine Site) % % % % % % % % % Document : JBT24-RPT6C-WaterManagementStrategy.docx PAGE 243
79 1.2.2 IMPACTS TO HORSE CREEK RUNOFF QUANTITY Table 1-2 summarises the calculated daily runoff rates for the Horse Creek receiving waters at the downstream boundary of the site (southern boundary of MLA 527). Daily flow rates are presented for the pre-mining case and for the post-mining case, to enable an assessment of the relative impacts of the mine, on the Horse Creek flow behaviour. The results are presented for a range of climate risk cases to demonstrate the potential impacts of the Elimatta Coal Mine under variable climate conditions. The climate risk percentiles were calculated using the results obtained from the modelled 93 Monte Carlo realisations, each representing a different 3 year climate condition. The modelling results indicate that the mine will reduce daily runoff rates by between zero and 3%, for climate risk profiles above the 2 percentile (wet periods). This reduction is consistent with the relative proportion of catchment area affected by the mine site. For climate risk profiles below the 2 percentile (dry periods), the modelling indicates that daily flow rates could be increased by.1 ML/d ( - 15%), as a result of controlled flow releases from regulated dams on the trailing limb of the runoff hydrograph of storm events in Horse Creek. Table 1-2 : Predicted Impacts of Elimatta Coal Mine on Horse Creek Flow Behaviour Climate Risk Horse Creek Daily Runoff Downstream of Elimatta Mine Site Pre-Mine Case (ML/d) Post-Mine Case (ML/d) Relative Change (%) 95 Percentile % 9 Percentile % 8 Percentile % 5 Percentile % 2 Percentile % 1 Percentile % 5 Percentile % 1 Percentile % Document : JBT24-RPT6C-WaterManagementStrategy.docx PAGE 244
80 1.2.3 IMPACTS TO HORSE CREEK RUNOFF QUALITY (TDS) Table 1-3 summarises the calculated daily runoff TDS (salinity) for the Horse Creek receiving waters downstream of the site (southern boundary of MLA 527). Daily TDS values are presented for the pre-mining case and for the post-mining case, to enable an assessment of the relative impacts of the mine, on the Horse Creek water quality. The results are presented for a range of climate risk cases to demonstrate the potential impacts of the Elimatta Coal Mine under variable climate conditions. The climate risk percentiles were calculated using the results obtained from the modelled 93 Monte Carlo realisations, each representing a different 3 year climate condition. The modelling results indicate that the mine will increase daily TDS in Horse Creek by between 3% and 7% for climate risk profiles above the 1 percentile (wet periods). This small increase in TDS will be due to uncontrolled and controlled flow releases from dams, during storm periods when flows are already running in Horse Creek. For climate risk profiles below the 1 percentile, the modelling indicates that daily TDS could be increased (by around 1%), as a result of controlled releases from regulated dams on the trailing limb of the runoff hydrograph of storm events in Horse Creek. However, such controlled releases would still be in accordance with DEHP Guidelines for Model Water Conditions for Coal Mines in the Fitzroy Basin. Table 1-3 : Predicted Impacts of Elimatta Coal Mine on Horse Creek TDS Climate Risk Horse Creek Daily TDS Downstream of Elimatta Mine Site Pre-Mine Case (mg/l) Post-Mine Case (mg/l) Relative Change (%) 95 Percentile % 9 Percentile % 8 Percentile % 5 Percentile % 2 Percentile % 1 Percentile % 5 Percentile % 1 Percentile % Document : JBT24-RPT6C-WaterManagementStrategy.docx PAGE 245
81 1.2.4 IMPACTS TO HORSE CREEK RUNOFF QUALITY (SULPHATE) Table 1-4 summarises the calculated daily runoff Sulphate (as SO4) for the Horse Creek receiving waters downstream of the site (southern boundary of MLA 527). Daily Sulphate values are presented for the pre-mining case and for the post-mining case, to enable an assessment of the relative impacts of the mine, on the Horse Creek water quality. The Sulphate values have been calculated using the relationship for Sulphate versus EC, as derived from the analyses of water quality data for the Dawson River at Taroom and at Utopia Downs (refer to Sections and for details). The adopted relationship is: Sulphate SO4 (mg/l) = (EC-15)/35 = (1.5xTDS (mg/l)-15)/35 The results are presented for a range of climate risk cases to demonstrate the potential impacts of the Elimatta Coal Mine under variable climate conditions. The climate risk percentiles were calculated using the results obtained from the modelled 93 Monte Carlo realisations, each representing a different 3 year climate condition. The modelling results indicate that the mine will increase daily Sulphate in Horse Creek by between 1% and 17% for climate risk profiles above the 1 percentile (wet periods). This small increase in Sulphate will be due to uncontrolled and controlled flow releases from dams, during storm periods when flows are already running in Horse Creek. For climate risk profiles below the 1 percentile, the modelling indicates that daily Sulphate could be increased (by around 165%), as a result of controlled releases from regulated dams on the trailing limb of the runoff hydrograph of storm events in Horse Creek. However, such controlled releases would still be in accordance with DEHP Guidelines for Model Water Conditions for Coal Mines in the Fitzroy Basin. Table 1-4 : Predicted Impacts of Elimatta Coal Mine on Horse Creek Sulphate Climate Risk Horse Creek Daily Sulphate Downstream of Elimatta Mine Site Pre-Mine Case (mg/l) Post-Mine Case (mg/l) Relative Change (%) 95 Percentile % 9 Percentile % 8 Percentile % 5 Percentile % 2 Percentile % 1 Percentile % 5 Percentile % 1 Percentile % Document : JBT24-RPT6C-WaterManagementStrategy.docx PAGE 246
82 1.3 EXTERNAL WATER SUPPLY VOLUME OF EXTERNAL WATER SUPPLY PUMPED TO DAM RW1 Table 1-6 summarises the calculated annual total water volume pumped from the external water supply into raw water Dam RW1, for any year of the mine s life. Table 1-6 also summarises the total number of days when the maximum external water supply volume is pumped into raw water Dam RW1, for any year of the mine s life. The results are presented for a range of climate risk cases to demonstrate the performance of the Elimatta Coal Mine water management system under variable climate conditions. The climate risk percentiles were calculated using the results obtained from the modelled 93 Monte Carlo realisations, each representing a different 3 year climate condition. The full annual requirement for the external water supply is 25 ML/a (refer to Section 8.6 for details). The modelled maximum daily external supply rate was 6.84 ML/d, while the modelled minimum daily external supply rate was 4.28 ML/d. The model results indicate that some external water supply will be required for the operation of the mine, for the majority of time. This is primarily due to the operating conditions assigned to raw water Dam RW1 in the water balance model. The model is configured to pump the maximum daily supply rate into the dam on all days, provided that the dam has sufficient freeboard to accommodate the full daily supply volume, without overtopping. The model results indicate that 1% of the annual external water supply will be required for all climate risk profiles including the 5 percentile risk and above. For the wettest climate case, 97% of the annual external water supply will still be required, however the maximum daily supply rate will only be required for 22 days throughout the wettest year. Table 1-5 : External Water Supply Annual Pumped Volume Climate Risk Annual Volume Pumped from External Supply (ML/a) Proportion of Max External Supply Volume Required (%) Annual Days Max External Supply Volume is Pumped (num/a) 95 Percentile 25 1% Percentile 25 1% Percentile 25 1% Percentile 25 1% Percentile 25 1% Percentile 25 1% Percentile 25 1% 365 Document : JBT24-RPT6C-WaterManagementStrategy.docx PAGE 247
83 1.4 OVERALL SYSTEM RELIABILITY POTABLE WATER DEMAND DEFICITS Table 1-6 summarises the calculated annual total water volume pumped to the potable water demand, for any year of the mine s life. Table 1-6 also summarises the total number of days of potable demand deficit, for any year of the mine s life. A deficit day is counted as any day when the daily volume pumped to the demand is less than the full demand amount. For example, this means that a deficit day is counted even if the pumped daily volume satisfied 99% of the full daily demand. Table 1-6 also provides the maximum number of consecutive days of potable demand deficit, to identify how long the critical period for demand deficit would likely be throughout the mine s expected 3 year life span. The results are presented for a range of climate risk cases to demonstrate the performance of the Elimatta Coal Mine water management system under variable climate conditions. The climate risk percentiles were calculated using the results obtained from the modelled 93 Monte Carlo realisations, each representing a different 3 year climate condition. The full annual requirement for the potable water demand varies between 87 and 9 ML/a, depending on the mine staging year (refer to Table 8-2 for details). The model results indicate that the potable water demands will be met for all the modelled climate risk cases. This is due to the external water supply contribution pumped into raw water Dam RW1. Table 1-6 : Potable Water Demand Annual Pumped Volume and Deficit Days Climate Risk Annual Volume Pumped to Potable Demand (ML/a) Proportion of Max Annual Potable Demand (%) Number of Days of Deficit of Potable Demand (num/a) Proportion of Days of Deficit per year (%) 95 Percentile 87 1% % 9 Percentile 87 1% % 8 Percentile 87 1% % 5 Percentile 87 1% % 2 Percentile 87 1% % 1 Percentile 87 1% % 5 Percentile 87 1% % Max Number of Consecutive Days of Demand Deficit (not annualised) Document : JBT24-RPT6C-WaterManagementStrategy.docx PAGE 248
84 1.4.2 CHPP MAKE UP WATER DEMAND DEFICITS Table 1-7 summarises the calculated annual total water volume pumped to the CHPP Make Up water demand, for any year of the mine s life. Table 1-7 also summarises the total number of days of CHPP demand deficit, for any year of the mine s life. A deficit day is counted as any day when the daily volume pumped to the demand is less than the full demand amount. For example, this means that a deficit day is counted even if the pumped daily volume was 99% of the full daily demand. Table 1-7 also provides the maximum number of consecutive days of CHPP Make Up water demand deficit, to identify how long the critical period for demand deficit would likely be throughout the mine s expected 3 year life span. The results are presented for a range of climate risk cases to demonstrate the performance of the Elimatta Coal Mine water management system under variable climate conditions. The climate risk percentiles were calculated using the results obtained from the modelled 93 Monte Carlo realisations, each representing a different 3 year climate condition. The full annual requirement for the CHPP Make Up water demand is 23 ML/a, for all mine staging years (refer to Table 8-2 for details). The model results indicate that the CHPP water demands will be met for all the modelled climate risk cases. This is due to the external water supply contribution pumped into raw water Dam RW1. Table 1-7 : CHPP Make Up Water Demand Annual Pumped Volume and Deficit Days Climate Risk Annual Volume Pumped to CHPP Demand (ML/a) Proportion of Max Annual CHPP Demand (%) Number of Days of Deficit of CHPP Demand (num/a) Proportion of Days of Deficit per year (%) 95 Percentile 23 1% % 9 Percentile 23 1% % 8 Percentile 23 1% % 5 Percentile 23 1% % 2 Percentile 23 1% % 1 Percentile 23 1% % 5 Percentile 23 1% % Max Number of Consecutive Days of Demand Deficit (not annualised) Document : JBT24-RPT6C-WaterManagementStrategy.docx PAGE 249
85 1.4.3 WATER FILL POINT NORTH (WFPN) DEMAND DEFICITS Table 1-8 summarises the calculated annual total water volume pumped to the northern water fill point demand, for any year of the mine s life. Table 1-8 also summarises the total number of days of northern water fill point demand deficit, for any year of the mine s life. A deficit day is counted as any day when the daily volume pumped to the demand is less than the full demand amount. For example, this means that a deficit day is counted even if the pumped daily volume was 99% of the full daily demand. Table 1-8 also provides the maximum number of consecutive days of northern water fill point demand deficit, to identify how long the critical period for demand deficit would likely be throughout the mine s expected 3 year life span. The results are presented for a range of climate risk cases to demonstrate the performance of the Elimatta Coal Mine water management system under variable climate conditions. The climate risk percentiles were calculated using the results obtained from the modelled 93 Monte Carlo realisations, each representing a different 3 year climate condition. The full annual requirement for the northern water fill point demand varies from 245 to 288 ML/a, depending on the mine staging year. The model results indicate that 1% of the northern water fill point demand will be met for all climate risk profiles including the 8 percentile risk and above. For the 5 percentile climate risk, only 5% of the annual fill point water demands will be met and the fill point demand will be in deficit for 2 days per year. Table 1-8 : Water Fill Point North Demand Annual Pumped Volume and Deficit Days Climate Risk Annual Volume Pumped to WFPN Demand (ML/a) Proportion of Max Annual WFPN Demand (%) Number of Days of Deficit of WFPN Demand (num/a) Proportion of Days of Deficit per year (%) 95 Percentile 263 1% % 9 Percentile % 2 2% 8 Percentile 218 8% 64 18% 5 Percentile 142 5% 21 55% 2 Percentile 115 4% % 1 Percentile 17 37% % 5 Percentile 1 35% % Max Number of Consecutive Days of Demand Deficit (not annualised) 185 Document : JBT24-RPT6C-WaterManagementStrategy.docx PAGE 25
86 1.4.4 WATER FILL POINT SOUTH (WFPS) DEMAND DEFICITS Table 1-9 summarises the calculated annual total water volume pumped to the southern water fill point demand, for any year of the mine s life. Table 1-9 also summarises the total number of days of southern water fill point demand deficit, for any year of the mine s life. A deficit day is counted as any day when the daily volume pumped to the demand is less than the full demand amount. For example, this means that a deficit day is counted even if the pumped daily volume was 99% of the full daily demand. Table 1-9 also provides the maximum number of consecutive days of southern water fill point demand deficit, to identify how long the critical period for demand deficit would likely be throughout the mine s expected 3 year life span. The results are presented for a range of climate risk cases to demonstrate the performance of the Elimatta Coal Mine water management system under variable climate conditions. The climate risk percentiles were calculated using the results obtained from the modelled 93 Monte Carlo realisations, each representing a different 3 year climate condition. The full annual requirement for the southern water fill point demand varies from 399 to 886 ML/a, depending on the mine staging year. The model results indicate that 1% of the southern water fill point demand will be met for all climate risk profiles including the 8 percentile risk and above. For the 5 percentile climate risk, only 77% of the annual fill point water demands will be met and the fill point demand will be in deficit for 7 days per year. Table 1-9 : Water Fill Point South Demand Annual Pumped Volume and Deficit Days Climate Risk Annual Volume Pumped to WFPS Demand (ML/a) Proportion of Max Annual WFPS Demand (%) Number of Days of Deficit of WFPS Demand (num/a) Proportion of Days of Deficit per year (%) 95 Percentile 81 1% % 9 Percentile 787 1% % 8 Percentile 761 1% % 5 Percentile % 23 6% 2 Percentile % % 1 Percentile % % 5 Percentile % 254 7% Max Number of Consecutive Days of Demand Deficit (not annualised) 11 Document : JBT24-RPT6C-WaterManagementStrategy.docx PAGE 251
87 1.5 HAZARDOUS DAM STORAGE, RELEASES AND OVERFLOWS ENVIRONMENTAL DAM EV1 Table 1-1 summarises the calculated peak annual stored water volume and the corresponding maximum annual TDS of that stored water, contained in proposed environmental dam EV1, for any year of the mine s life. Table 1-1 also summarises the calculated total annual volume of uncontrolled overflows from the dam, the corresponding TDS of those uncontrolled overflows and the total number of days of uncontrolled overflows, for any year of the mine s life. Table 1-1 also summarises the calculated total annual volume of controlled releases from the dam, the corresponding TDS of those controlled releases and the total number of days of controlled releases, for any year of the mine s life. Table 1-1 also summarises the total number of uncontrolled overflow events from the dam, as predicted during the simulated 93 Monte Carlo realisations of 3 years per realisation, (resulting in 279 years in total). The total number of uncontrolled overflow events has then been assigned an equivalent failure AEP, which represents the level of containment immunity provided by the dam. The calculated maximum overflow volume, predicted to occur during a single uncontrolled overflow event, is also presented in the table, to illustrate the potential worst case overflow volume from the dam, during any 3 year mine life. The modelled capacity of environmental dam EV1 was set at 5 ML, for mine staging years 1 to 8. The modelled capacity was set at zero for all other mine staging years. All the results for environmental dam EV1 are presented for a range of climate risk cases to demonstrate the performance of the dam under variable climate conditions. The climate risk percentiles were calculated using the results obtained from the modelled 93 Monte Carlo realisations, each representing a different 3 year climate condition. The target containment immunity for acceptable performance of all hazardous dams was set at the 1 in 2 year AEP level (refer to Sections 4.5 and 8.8 for details). The model results presented for environmental dam EV1 indicate that the proposed dam size will exceed the target containment immunity for the dam, as the modelled frequency of uncontrolled overtopping events from the dam was equivalent to the 1 in 29 year AEP level. The model results further indicate that uncontrolled overflows from the dam are only predicted to occur during those 3 year climate risk profiles which exceed the 95 percentile risk. In other words, uncontrolled overflows from the dam are only predicted to occur during the wettest 5 percentile of all 3 year climate risk cases. Document : JBT24-RPT6C-WaterManagementStrategy.docx PAGE 252
88 Table 1-1 : Environmental Dam EV1 Annual Stored Volume, Overflows and Releases Climate Risk Peak Water Volume Stored in the Dam (ML/a) Peak TDS of Stored Water in the Dam (mg/l) Annual Total Uncontrolled Overflow Vol (ML/a) Annual Days Uncontrolled Overflow (num/a) Peak TDS of Uncontrolled Overflow (mg/l) Annual Total Release Vol (ML/a) 95 Percentile Percentile Percentile Percentile Percentile Percentile Percentile Total Number of Uncontrolled Overflow Events During 279 Years of Climate Simulations (93 cycles of 3 years) Equivalent Containment AEP of the Dam, based on Number of Uncontrolled Overflow Events (years) Maximum Volume of Single Uncontrolled Overflow Event During Worst Case 3 Year Mine Life (ML) Annual Days Release (num/a) 2 Peak TDS of Release (mg/l) Document : JBT24-RPT6C-WaterManagementStrategy.docx PAGE 253
89 1.5.2 ENVIRONMENTAL DAM EV2 Table 1-11 summarises the calculated peak annual stored water volume and the corresponding maximum annual TDS of that stored water, contained in proposed environmental dam EV2, for any year of the mine s life. Table 1-11 also summarises the calculated total annual volume of uncontrolled overflows from the dam, the corresponding TDS of those uncontrolled overflows and the total number of days of uncontrolled overflows, for any year of the mine s life. Table 1-11 also summarises the calculated total annual volume of controlled releases from the dam, the corresponding TDS of those controlled releases and the total number of days of controlled releases, for any year of the mine s life. Table 1-11 also summarises the total number of uncontrolled overflow events from the dam, as predicted during the simulated 93 Monte Carlo realisations of 3 years per realisation, (resulting in 279 years in total). The total number of uncontrolled overflow events has then been assigned an equivalent failure AEP, which represents the level of containment immunity provided by the dam. The calculated maximum overflow volume, predicted to occur during a single uncontrolled overflow event, is also presented in the table, to illustrate the potential worst case overflow volume from the dam, during any 3 year mine life. The modelled capacity of environmental dam EV2 was set at 6 ML, for mine staging years 3 to 3. The modelled capacity was set at zero for all other mine staging years. All the results for environmental dam EV2 are presented for a range of climate risk cases to demonstrate the performance of the dam under variable climate conditions. The climate risk percentiles were calculated using the results obtained from the modelled 93 Monte Carlo realisations, each representing a different 3 year climate condition. The target containment immunity for acceptable performance of all hazardous dams was set at the 1 in 2 year AEP level (refer to Sections 4.5 and 8.8 for details). The model results presented for environmental dam EV2 indicate that the proposed dam size will exceed the target containment immunity for the dam, as the modelled frequency of uncontrolled overtopping events from the dam was equivalent to the 1 in 22 year AEP level. The model results further indicate that uncontrolled overflows from the dam are only predicted to occur during those 3 year climate risk profiles which exceed the 95 percentile risk. In other words, uncontrolled overflows from the dam are only predicted to occur during the wettest 5 percentile of all 3 year climate risk cases. Document : JBT24-RPT6C-WaterManagementStrategy.docx PAGE 254
90 Table 1-11 : Environmental Dam EV2 Annual Stored Volume, Overflows and Releases Climate Risk Peak Water Volume Stored in the Dam (ML/a) Peak TDS of Stored Water in the Dam (mg/l) Annual Total Uncontrolled Overflow Vol (ML/a) Annual Days Uncontrolled Overflow (num/a) Peak TDS of Uncontrolled Overflow (mg/l) Annual Total Release Vol (ML/a) 95 Percentile Percentile Percentile Percentile Percentile Percentile Percentile Total Number of Uncontrolled Overflow Events During 279 Years of Climate Simulations (93 cycles of 3 years) Equivalent Containment AEP of the Dam, based on Number of Uncontrolled Overflow Events (years) Maximum Volume of Single Uncontrolled Overflow Event During Worst Case 3 Year Mine Life (ML) Annual Days Release (num/a) Peak TDS of Release (mg/l) Document : JBT24-RPT6C-WaterManagementStrategy.docx PAGE 255
91 1.5.3 ENVIRONMENTAL DAM EV3 Table 1-12 summarises the calculated peak annual stored water volume and the corresponding maximum annual TDS of that stored water, contained in proposed environmental dam EV3, for any year of the mine s life. Table 1-12 also summarises the calculated total annual volume of uncontrolled overflows from the dam, the corresponding TDS of those uncontrolled overflows and the total number of days of uncontrolled overflows, for any year of the mine s life. Table 1-12 also summarises the calculated total annual volume of controlled releases from the dam, the corresponding TDS of those controlled releases and the total number of days of controlled releases, for any year of the mine s life. Table 1-12 also summarises the total number of uncontrolled overflow events from the dam, as predicted during the simulated 93 Monte Carlo realisations of 3 years per realisation, (resulting in 279 years in total). The total number of uncontrolled overflow events has then been assigned an equivalent failure AEP, which represents the level of containment immunity provided by the dam. The calculated maximum overflow volume, predicted to occur during a single uncontrolled overflow event, is also presented in the table, to illustrate the potential worst case overflow volume from the dam, during any 3 year mine life. The modelled capacity of environmental dam EV3 was set at 2 ML, for all mine staging years. All the results for environmental dam EV3 are presented for a range of climate risk cases to demonstrate the performance of the dam under variable climate conditions. The climate risk percentiles were calculated using the results obtained from the modelled 93 Monte Carlo realisations, each representing a different 3 year climate condition. The target containment immunity for acceptable performance of all hazardous dams was set at the 1 in 2 year AEP level (refer to Sections 4.5 and 8.8 for details). The model results presented for environmental dam EV3 indicate that the proposed dam size will exceed the target containment immunity for the dam, as the modelled frequency of uncontrolled overtopping events from the dam was equivalent to the 1 in 3 year AEP level. The model results further indicate that uncontrolled overflows from the dam are only predicted to occur during those 3 year climate risk profiles which exceed the 95 percentile risk. In other words, uncontrolled overflows from the dam are only predicted to occur during the wettest 5 percentile of all 3 year climate risk cases. In Table 1-12, the maximum TDS value of 35, calculated in the dam is a ceiling limit of TDS, which was arbitrarily set in the WSBM to correspond to the TDS of sea water. This was done to limit the very high calculated TDS in the dam during those times when the stored water levels were very low. Document : JBT24-RPT6C-WaterManagementStrategy.docx PAGE 256
92 Table 1-12 : Environmental Dam EV3 Annual Stored Volume, Overflows and Releases Climate Risk Peak Water Volume Stored in the Dam (ML/a) Peak TDS of Stored Water in the Dam (mg/l) Annual Total Uncontrolled Overflow Vol (ML/a) Annual Days Uncontrolled Overflow (num/a) Peak TDS of Uncontrolled Overflow (mg/l) Annual Total Release Vol (ML/a) 95 Percentile Percentile Percentile Percentile Percentile Percentile Percentile Total Number of Uncontrolled Overflow Events During 279 Years of Climate Simulations (93 cycles of 3 years) Equivalent Containment AEP of the Dam, based on Number of Uncontrolled Overflow Events (years) Maximum Volume of Single Uncontrolled Overflow Event During Worst Case 3 Year Mine Life (ML) Annual Days Release (num/a) Peak TDS of Release (mg/l) Document : JBT24-RPT6C-WaterManagementStrategy.docx PAGE 257
93 1.5.4 ENVIRONMENTAL DAM EV4 Table 1-13 summarises the calculated peak annual stored water volume and the corresponding maximum annual TDS of that stored water, contained in proposed environmental dam EV4, for any year of the mine s life. Table 1-13 also summarises the calculated total annual volume of uncontrolled overflows from the dam, the corresponding TDS of those uncontrolled overflows and the total number of days of uncontrolled overflows, for any year of the mine s life. Table 1-13 also summarises the calculated total annual volume of controlled releases from the dam, the corresponding TDS of those controlled releases and the total number of days of controlled releases, for any year of the mine s life. Table 1-13 also summarises the total number of uncontrolled overflow events from the dam, as predicted during the simulated 93 Monte Carlo realisations of 3 years per realisation, (resulting in 279 years in total). The total number of uncontrolled overflow events has then been assigned an equivalent failure AEP, which represents the level of containment immunity provided by the dam. The calculated maximum overflow volume, predicted to occur during a single uncontrolled overflow event, is also presented in the table, to illustrate the potential worst case overflow volume from the dam, during any 3 year mine life. The modelled capacity of environmental dam EV4 was set at 38 ML, for all mine staging years. This capacity was based on the combined storage volumes of preliminary designs prepared for the CHPP storage dam, the ROM pad storage dam, the stockpile west storage dam, the stockpile east storage dam, the MIA storage dam and the TLO storage dam. All the results for environmental dam EV4 are presented for a range of climate risk cases to demonstrate the performance of the dam under variable climate conditions. The climate risk percentiles were calculated using the results obtained from the modelled 93 Monte Carlo realisations, each representing a different 3 year climate condition. The target containment immunity for acceptable performance of all hazardous dams was set at the 1 in 2 year AEP level (refer to Sections 4.5 and 8.8 for details). The model results presented for environmental dam EV4 indicate that the proposed dam size will exceed the target containment immunity for the dam, as no uncontrolled overflows were predicted from the dam during any of the climate simulations. The model results further indicate that the combined storage capacity for dam EV4 could be reduced from 38ML to 2ML, which was the maximum stored volume in the dam throughout all of the modelled climate risk simulations. Document : JBT24-RPT6C-WaterManagementStrategy.docx PAGE 258
94 Table 1-13 : Environmental Dam EV4 Annual Stored Volume, Overflows and Releases Climate Risk Peak Water Volume Stored in the Dam (ML/a) Peak TDS of Stored Water in the Dam (mg/l) Annual Total Uncontrolled Overflow Vol (ML/a) Annual Days Uncontrolled Overflow (num/a) Peak TDS of Uncontrolled Overflow (mg/l) Annual Total Release Vol (ML/a) 95 Percentile Percentile Percentile Percentile Percentile Percentile Percentile Total Number of Uncontrolled Overflow Events During 279 Years of Climate Simulations (93 cycles of 3 years) Equivalent Containment AEP of the Dam, based on Number of Uncontrolled Overflow Events (years) Maximum Volume of Single Uncontrolled Overflow Event During Worst Case 3 Year Mine Life (ML) Annual Days Release (num/a) Peak TDS of Release (mg/l) Document : JBT24-RPT6C-WaterManagementStrategy.docx PAGE 259
95 1.5.5 TAILINGS DAM TDN Table 1-14 summarises the calculated peak annual stored water volume and the corresponding maximum annual TDS of that stored water, contained in proposed tailings dam TDN, for any year of the mine s life. Table 1-14 also summarises the calculated total annual volume of uncontrolled overflows from the tailings dam, the corresponding TDS of those uncontrolled overflows and the total number of days of uncontrolled overflows, for any year of the mine s life. Table 1-14 also summarises the calculated total annual volume of controlled releases from the tailings dam, the corresponding TDS of those controlled releases and the total number of days of controlled releases, for any year of the mine s life. However, given the likelihood of suspended fine tailings being present in the water stored in the tailings dam, controlled releases were not allowed from this tailings dam into the Horse Creek receiving waters. Table 1-14 also summarises the total number of uncontrolled overflow events from the tailings dam, as predicted during the simulated 93 Monte Carlo realisations of 3 years per realisation, (resulting in 279 years in total). The total number of uncontrolled overflow events has then been assigned an equivalent failure AEP, which represents the level of containment immunity provided by the dam. The calculated maximum overflow volume, predicted to occur during a single uncontrolled overflow event, is also presented in the table, to illustrate the potential worst case overflow volume from the dam, during any 3 year mine life. The modelled capacity of tailings dam TDN started at 13,6 ML in mine year 1, but then progressively reduced due to filling with fine tailings. At mine year 5, the modelled capacity of the dam was reduced to 165 ML and from that time on, fine tailings were no longer directed to this tailings dam. The fine tailings were instead directed to dam TDNA. The gradual reduction in the capacity of this tailings dam has been represented in the WSBM of the Elimatta water management system by reducing the capacity of the dam according to the calculated export rate of dry tailings material from the CHPP into the tailings dam. All the results for tailings dam TDN are presented for a range of climate risk cases to demonstrate the performance of the dam under variable climate conditions. The climate risk percentiles were calculated using the results obtained from the modelled 93 Monte Carlo realisations, each representing a different 3 year climate condition. The target containment immunity for acceptable performance of all hazardous dams was set at the 1 in 2 year AEP level (refer to Sections 4.5 and 8.8 for details). The model results presented for tailings dam TDN indicate that the proposed dam size will exceed the target containment immunity for the dam, as no uncontrolled overflows were predicted from the dam during any of the climate simulations. In Table 1-14, the maximum TDS value of 35, calculated in the tailings dam is a ceiling limit of TDS, which was arbitrarily set in the WSBM to correspond to the TDS of sea water. This was done to limit the calculated TDS in the dam during those times when the stored water levels were very low. Document : JBT24-RPT6C-WaterManagementStrategy.docx PAGE 26
96 Table 1-14 : Tailings Dam TDN Annual Stored Volume, Overflows and Releases Climate Risk Peak Water Volume Stored in the Dam (ML/a) Peak TDS of Stored Water in the Dam (mg/l) Annual Total Uncontrolled Overflow Vol (ML/a) Annual Days Uncontrolled Overflow (num/a) Peak TDS of Uncontrolled Overflow (mg/l) Annual Total Release Vol (ML/a) 95 Percentile Percentile Percentile Percentile Percentile Percentile Percentile 1 Total Number of Uncontrolled Overflow Events During 279 Years of Climate Simulations (93 cycles of 3 years) Equivalent Containment AEP of the Dam, based on Number of Uncontrolled Overflow Events (years) Maximum Volume of Single Uncontrolled Overflow Event During Worst Case 3 Year Mine Life (ML) Annual Days Release (num/a) Peak TDS of Release (mg/l) Document : JBT24-RPT6C-WaterManagementStrategy.docx PAGE 261
97 1.5.6 TAILINGS DAM TDNA Table 1-15 summarises the calculated peak annual stored water volume and the corresponding maximum annual TDS of that stored water, contained in proposed tailings dam TDNA, for any year of the mine s life. Table 1-15 also summarises the calculated total annual volume of uncontrolled overflows from the tailings dam, the corresponding TDS of those uncontrolled overflows and the total number of days of uncontrolled overflows, for any year of the mine s life. Table 1-15 also summarises the calculated total annual volume of controlled releases from the tailings dam, the corresponding TDS of those controlled releases and the total number of days of controlled releases, for any year of the mine s life. However, given the likelihood of suspended fine tailings being present in the water stored in the tailings dam, controlled releases were not allowed from this tailings dam into the Horse Creek receiving waters. Table 1-15 also summarises the total number of uncontrolled overflow events from the tailings dam, as predicted during the simulated 93 Monte Carlo realisations of 3 years per realisation, (resulting in 279 years in total). The total number of uncontrolled overflow events has then been assigned an equivalent failure AEP, which represents the level of containment immunity provided by the dam. The calculated maximum overflow volume, predicted to occur during a single uncontrolled overflow event, is also presented in the table, to illustrate the potential worst case overflow volume from the dam, during any 3 year mine life. The modelled capacity of tailings dam TDNA started at 11,77 ML in mine year 5, but then progressively reduced due to filling with fine tailings between mine years 5 to 1. At mine year 1, the modelled capacity of the dam was reduced to 2,45 ML and from that time on, fine tailings were no longer directed to this dam. The fine tailings were instead directed to dam TDP. The gradual reduction in the capacity of this tailings dam has been represented in the WSBM of the Elimatta water management system by reducing the capacity of the dam according to the calculated export rate of dry tailings material from the CHPP into the tailings dam. All the results for tailings dam TDNA are presented for a range of climate risk cases to demonstrate the performance of the dam under variable climate conditions. The climate risk percentiles were calculated using the results obtained from the modelled 93 Monte Carlo realisations, each representing a different 3 year climate condition. The target containment immunity for acceptable performance of all hazardous dams was set at the 1 in 2 year AEP level (refer to Sections 4.5 and 8.8 for details). The model results presented for tailings dam TDNA indicate that the proposed dam size will exceed the target containment immunity for the dam, as no uncontrolled overflows were predicted from the dam during any of the climate simulations. In Table 1-15, the maximum TDS value of 35, calculated in the tailings dam is a ceiling limit of TDS, which was arbitrarily set in the WSBM to correspond to the TDS of sea water. This was done to limit the calculated TDS in the dam during those times when the stored water levels were very low. Document : JBT24-RPT6C-WaterManagementStrategy.docx PAGE 262
98 Table 1-15 : Tailings Dam TDNA Annual Stored Volume, Overflows and Releases Climate Risk Peak Water Volume Stored in the Dam (ML/a) Peak TDS of Stored Water in the Dam (mg/l) Annual Total Uncontrolled Overflow Vol (ML/a) Annual Days Uncontrolled Overflow (num/a) Peak TDS of Uncontrolled Overflow (mg/l) Annual Total Release Vol (ML/a) 95 Percentile Percentile Percentile Percentile Percentile Percentile Percentile 2 1 Total Number of Uncontrolled Overflow Events During 279 Years of Climate Simulations (93 cycles of 3 years) Equivalent Containment AEP of the Dam, based on Number of Uncontrolled Overflow Events (years) Maximum Volume of Single Uncontrolled Overflow Event During Worst Case 3 Year Mine Life (ML) Annual Days Release (num/a) Peak TDS of Release (mg/l) Document : JBT24-RPT6C-WaterManagementStrategy.docx PAGE 263
99 1.5.7 TAILINGS DAM TDP Table 1-16 summarises the calculated peak annual stored water volume and the corresponding maximum annual TDS of that stored water, contained in proposed tailings dam TDP, for any year of the mine s life. Table 1-16 also summarises the calculated total annual volume of uncontrolled overflows from the tailings dam, the corresponding TDS of those uncontrolled overflows and the total number of days of uncontrolled overflows, for any year of the mine s life. Table 1-16 also summarises the calculated total annual volume of controlled releases from the tailings dam, the corresponding TDS of those controlled releases and the total number of days of controlled releases, for any year of the mine s life. However, given the likelihood of suspended fine tailings being present in the water stored in the tailings dam, controlled releases were not allowed from this tailings dam into the Horse Creek receiving waters. Table 1-16 also summarises the total number of uncontrolled overflow events from the tailings dam, as predicted during the simulated 93 Monte Carlo realisations of 3 years per realisation, (resulting in 279 years in total). The total number of uncontrolled overflow events has then been assigned an equivalent failure AEP, which represents the level of containment immunity provided by the dam. The calculated maximum overflow volume, predicted to occur during a single uncontrolled overflow event, is also presented in the table, to illustrate the potential worst case overflow volume from the dam, during any 3 year mine life. This tailings dam TDP is actually pit N. After mine year 1, pit N ceases to be an operational pit and it transitions to an in-pit tailings storage. This transition is represented in the GoldSim model by this tailings dam TDP, which becomes functional after mine year 1, whereas pit N becomes non-functional after mine year 1. The modelled capacity of tailings dam TDP was therefore set to zero for all mine years up to year 1. At mine year 1, the dam s capacity was set to 51,7 ML, but was then gradually reduced over time due to filling with fine tailings. At the end of mining in mine year 3, the capacity of the dam was reduced to 1,25 ML. The gradual reduction in the capacity of this tailings dam has been represented in the WSBM of the Elimatta water management system by reducing the capacity of the dam according to the calculated export rate of dry tailings material from the CHPP into the tailings dam. All the results for tailings dam TDP are presented for a range of climate risk cases to demonstrate the performance of the dam under variable climate conditions. The climate risk percentiles were calculated using the results obtained from the modelled 93 Monte Carlo realisations, each representing a different 3 year climate condition. The target containment immunity for acceptable performance of all hazardous dams was set at the 1 in 2 year AEP level (refer to Sections 4.5 and 8.8 for details). The model results presented for tailings dam TDP indicate that the proposed dam size will exceed the target containment immunity for the dam, as no uncontrolled overflows were predicted from the dam during any of the climate simulations. In Table 1-16, the maximum TDS value of 35, calculated in the tailings dam is a ceiling limit of TDS, which was arbitrarily set in the WSBM to correspond to the TDS of sea water. This was done to limit the calculated TDS in the dam during those times when the stored water levels were very low. Document : JBT24-RPT6C-WaterManagementStrategy.docx PAGE 264
100 Table 1-16 : Tailings Dam TDP Annual Stored Volume, Overflows and Releases Climate Risk Peak Water Volume Stored in the Dam (ML/a) Peak TDS of Stored Water in the Dam (mg/l) Annual Total Uncontrolled Overflow Vol (ML/a) Annual Days Uncontrolled Overflow (num/a) Peak TDS of Uncontrolled Overflow (mg/l) Annual Total Release Vol (ML/a) 95 Percentile Percentile Percentile Percentile Percentile Percentile 1 5 Percentile 1 Total Number of Uncontrolled Overflow Events During 279 Years of Climate Simulations (93 cycles of 3 years) Equivalent Containment AEP of the Dam, based on Number of Uncontrolled Overflow Events (years) Maximum Volume of Single Uncontrolled Overflow Event During Worst Case 3 Year Mine Life (ML) Annual Days Release (num/a) Peak TDS of Release (mg/l) Document : JBT24-RPT6C-WaterManagementStrategy.docx PAGE 265
101 1.6 SEDIMENT DAM STORAGE, RELEASES AND OVERFLOWS SEDIMENT DAM SD1 Table 1-17 summarises the calculated peak annual stored water volume and the corresponding maximum annual TDS of that stored water, contained in proposed sediment dam SD1, for any year of the mine s life. Table 1-17 also summarises the calculated total annual volume of uncontrolled overflows from the dam, the corresponding TDS of those uncontrolled overflows and the total number of days of uncontrolled overflows, for any year of the mine s life. Table 1-17 also summarises the calculated total annual volume of controlled releases from the dam, the corresponding TDS of those controlled releases and the total number of days of controlled releases, for any year of the mine s life. Table 1-17 also summarises the total number of uncontrolled overflow events from the dam, as predicted during the simulated 93 Monte Carlo realisations of 3 years per realisation, (resulting in 279 years in total). The total number of uncontrolled overflow events has then been assigned an equivalent failure AEP, which represents the level of containment immunity provided by the dam. The calculated maximum overflow volume, predicted to occur during a single uncontrolled overflow event, is also presented in the table, to illustrate the potential worst case overflow volume from the dam, during any 3 year mine life. The modelled capacity of sediment dam SD1 was set at 1 ML, for all mine staging years. All the results for sediment dam SD1 are presented for a range of climate risk cases to demonstrate the performance of the dam under variable climate conditions. The climate risk percentiles were calculated using the results obtained from the modelled 93 Monte Carlo realisations, each representing a different 3 year climate condition. The target containment immunity for acceptable performance of all sediment dams was set at the 1 in 1 year AEP level (refer to Section 8.9 for details). The model results presented for sediment dam SD1 indicate that the proposed dam size will exceed the target containment immunity for the dam, as the modelled frequency of uncontrolled overtopping events from the dam was equivalent to the 1 in 11 year AEP level. The model results further indicate that uncontrolled overflows from the dam are only predicted to occur during those 3 year climate risk profiles which exceed the 9 percentile risk. In other words, uncontrolled overflows from the dam are only predicted to occur during the wettest 1 percentile of all 3 year climate risk cases. Document : JBT24-RPT6C-WaterManagementStrategy.docx PAGE 266
102 Table 1-17 : Sediment Dam SD1 Annual Stored Volume, Overflows and Releases Climate Risk Peak Water Volume Stored in the Dam (ML/a) Peak TDS of Stored Water in the Dam (mg/l) Annual Total Uncontrolled Overflow Vol (ML/a) Annual Days Uncontrolled Overflow (num/a) Peak TDS of Uncontrolled Overflow (mg/l) Annual Total Release Vol (ML/a) 95 Percentile Percentile Percentile Percentile Percentile Percentile Percentile Total Number of Uncontrolled Overflow Events During 279 Years of Climate Simulations (93 cycles of 3 years) Equivalent Containment AEP of the Dam, based on Number of Uncontrolled Overflow Events (years) Maximum Volume of Single Uncontrolled Overflow Event During Worst Case 3 Year Mine Life (ML) Annual Days Release (num/a) Peak TDS of Release (mg/l) Document : JBT24-RPT6C-WaterManagementStrategy.docx PAGE 267
103 1.6.2 SEDIMENT DAM SD2 Table 1-18 summarises the calculated peak annual stored water volume and the corresponding maximum annual TDS of that stored water, contained in proposed sediment dam SD2, for any year of the mine s life. Table 1-18 also summarises the calculated total annual volume of uncontrolled overflows from the dam, the corresponding TDS of those uncontrolled overflows and the total number of days of uncontrolled overflows, for any year of the mine s life. Table 1-18 also summarises the calculated total annual volume of controlled releases from the dam, the corresponding TDS of those controlled releases and the total number of days of controlled releases, for any year of the mine s life. Table 1-18 also summarises the total number of uncontrolled overflow events from the dam, as predicted during the simulated 93 Monte Carlo realisations of 3 years per realisation, (resulting in 279 years in total). The total number of uncontrolled overflow events has then been assigned an equivalent failure AEP, which represents the level of containment immunity provided by the dam. The calculated maximum overflow volume, predicted to occur during a single uncontrolled overflow event, is also presented in the table, to illustrate the potential worst case overflow volume from the dam, during any 3 year mine life. The modelled capacity of sediment dam SD2 was set at 4 ML, for all mine staging years. All the results for sediment dam SD2 are presented for a range of climate risk cases to demonstrate the performance of the dam under variable climate conditions. The climate risk percentiles were calculated using the results obtained from the modelled 93 Monte Carlo realisations, each representing a different 3 year climate condition. The target containment immunity for acceptable performance of all sediment dams was set at the 1 in 1 year AEP level (refer to Section 8.9 for details). The model results presented for sediment dam SD2 indicate that the proposed dam size will exceed the target containment immunity for the dam, as the modelled frequency of uncontrolled overtopping events from the dam was equivalent to the 1 in 11 year AEP level. The model results further indicate that uncontrolled overflows from the dam are only predicted to occur during those 3 year climate risk profiles which exceed the 9 percentile risk. In other words, uncontrolled overflows from the dam are only predicted to occur during the wettest 1 percentile of all 3 year climate risk cases. Document : JBT24-RPT6C-WaterManagementStrategy.docx PAGE 268
104 Table 1-18 : Sediment Dam SD2 Annual Stored Volume, Overflows and Releases Climate Risk Peak Water Volume Stored in the Dam (ML/a) Peak TDS of Stored Water in the Dam (mg/l) Annual Total Uncontrolled Overflow Vol (ML/a) Annual Days Uncontrolled Overflow (num/a) Peak TDS of Uncontrolled Overflow (mg/l) Annual Total Release Vol (ML/a) 95 Percentile Percentile Percentile Percentile Percentile Percentile Percentile Total Number of Uncontrolled Overflow Events During 279 Years of Climate Simulations (93 cycles of 3 years) Equivalent Containment AEP of the Dam, based on Number of Uncontrolled Overflow Events (years) Maximum Volume of Single Uncontrolled Overflow Event During Worst Case 3 Year Mine Life (ML) Annual Days Release (num/a) Peak TDS of Release (mg/l) Document : JBT24-RPT6C-WaterManagementStrategy.docx PAGE 269
105 1.6.3 SEDIMENT DAM SD3 Table 1-19 summarises the calculated peak annual stored water volume and the corresponding maximum annual TDS of that stored water, contained in proposed sediment dam SD3, for any year of the mine s life. Table 1-19 also summarises the calculated total annual volume of uncontrolled overflows from the dam, the corresponding TDS of those uncontrolled overflows and the total number of days of uncontrolled overflows, for any year of the mine s life. Table 1-19 also summarises the calculated total annual volume of controlled releases from the dam, the corresponding TDS of those controlled releases and the total number of days of controlled releases, for any year of the mine s life. Table 1-19 also summarises the total number of uncontrolled overflow events from the dam, as predicted during the simulated 93 Monte Carlo realisations of 3 years per realisation, (resulting in 279 years in total). The total number of uncontrolled overflow events has then been assigned an equivalent failure AEP, which represents the level of containment immunity provided by the dam. The calculated maximum overflow volume, predicted to occur during a single uncontrolled overflow event, is also presented in the table, to illustrate the potential worst case overflow volume from the dam, during any 3 year mine life. The modelled capacity of sediment dam SD3 was set at 2 ML, for all mine staging years. All the results for sediment dam SD3 are presented for a range of climate risk cases to demonstrate the performance of the dam under variable climate conditions. The climate risk percentiles were calculated using the results obtained from the modelled 93 Monte Carlo realisations, each representing a different 3 year climate condition. The target containment immunity for acceptable performance of all sediment dams was set at the 1 in 1 year AEP level (refer to Section 8.9 for details). The model results presented for sediment dam SD3 indicate that the proposed dam size will exceed the target containment immunity for the dam, as the modelled frequency of uncontrolled overtopping events from the dam was equivalent to the 1 in 1 year AEP level. The model results further indicate that uncontrolled overflows from the dam are only predicted to occur during those 3 year climate risk profiles which exceed the 9 percentile risk. In other words, uncontrolled overflows from the dam are only predicted to occur during the wettest 1 percentile of all 3 year climate risk cases. Document : JBT24-RPT6C-WaterManagementStrategy.docx PAGE 27
106 Table 1-19 : Sediment Dam SD3 Annual Stored Volume, Overflows and Releases Climate Risk Peak Water Volume Stored in the Dam (ML/a) Peak TDS of Stored Water in the Dam (mg/l) Annual Total Uncontrolled Overflow Vol (ML/a) Annual Days Uncontrolled Overflow (num/a) Peak TDS of Uncontrolled Overflow (mg/l) Annual Total Release Vol (ML/a) 95 Percentile Percentile Percentile Percentile Percentile Percentile Percentile Total Number of Uncontrolled Overflow Events During 279 Years of Climate Simulations (93 cycles of 3 years) Equivalent Containment AEP of the Dam, based on Number of Uncontrolled Overflow Events (years) Maximum Volume of Single Uncontrolled Overflow Event During Worst Case 3 Year Mine Life (ML) Annual Days Release (num/a) Peak TDS of Release (mg/l) Document : JBT24-RPT6C-WaterManagementStrategy.docx PAGE 271
107 1.7 RAW WATER DAM STORAGE, RELEASES AND OVERFLOWS RAW WATER DAM RW1 Table 1-2 summarises the calculated peak annual stored water volume and the corresponding maximum annual TDS of that stored water, contained in proposed raw water dam RW1, for any year of the mine s life. Table 1-2 also summarises the calculated total annual volume of uncontrolled overflows from the dam, the corresponding TDS of those uncontrolled overflows and the total number of days of uncontrolled overflows, for any year of the mine s life. Table 1-2 also summarises the calculated total annual volume of controlled releases from the dam, the corresponding TDS of those controlled releases and the total number of days of controlled releases, for any year of the mine s life. However, given that raw water dam RW1 receives high quality water from the external supply under a take or pay arrangement, controlled releases were not allowed from this tailings dam into the Horse Creek receiving waters. This approach was adopted to maximise the volume of water stored in the dam at all times, thereby increasing the reliability of supply to the various mine water demands. Table 1-2 also summarises the total number of uncontrolled overflow events from the dam, as predicted during the simulated 93 Monte Carlo realisations of 3 years per realisation, (resulting in 279 years in total). The total number of uncontrolled overflow events has then been assigned an equivalent failure AEP, which represents the level of containment immunity provided by the dam. The calculated maximum overflow volume, predicted to occur during a single uncontrolled overflow event, is also presented in the table, to illustrate the potential worst case overflow volume from the dam, during any 3 year mine life. The modelled capacity of raw water dam RW1 was set at 2 ML, for all mine staging years. All the results for raw water dam RW1 are presented for a range of climate risk cases to demonstrate the performance of the dam under variable climate conditions. The climate risk percentiles were calculated using the results obtained from the modelled 93 Monte Carlo realisations, each representing a different 3 year climate condition. The target containment immunity for acceptable performance of all raw water dams was arbitrarily set at the 1 in 1 year AEP level. The model results presented for raw water dam RW1 indicate that the proposed dam size will exceed the target containment immunity for the dam, as no uncontrolled overflows were predicted from the dam during any of the climate simulations. Document : JBT24-RPT6C-WaterManagementStrategy.docx PAGE 272
108 Table 1-2 : Raw Water Dam RW1 Annual Stored Volume, Overflows and Releases Climate Risk Peak Water Volume Stored in the Dam (ML/a) Peak TDS of Stored Water in the Dam (mg/l) Annual Total Uncontrolled Overflow Vol (ML/a) Annual Days Uncontrolled Overflow (num/a) Peak TDS of Uncontrolled Overflow (mg/l) Annual Total Release Vol (ML/a) 95 Percentile Percentile Percentile Percentile Percentile Percentile Percentile Total Number of Uncontrolled Overflow Events During 279 Years of Climate Simulations (93 cycles of 3 years) Equivalent Containment AEP of the Dam, based on Number of Uncontrolled Overflow Events (years) Maximum Volume of Single Uncontrolled Overflow Event During Worst Case 3 Year Mine Life (ML) Annual Days Release (num/a) Peak TDS of Release (mg/l) Document : JBT24-RPT6C-WaterManagementStrategy.docx PAGE 273
109 1.7.2 RAW WATER DAM RW2 Table 1-21 summarises the calculated peak annual stored water volume and the corresponding maximum annual TDS of that stored water, contained in proposed raw water dam RW2, for any year of the mine s life. Table 1-21 also summarises the calculated total annual volume of uncontrolled overflows from the dam, the corresponding TDS of those uncontrolled overflows and the total number of days of uncontrolled overflows, for any year of the mine s life. Table 1-21 also summarises the calculated total annual volume of controlled releases from the dam, the corresponding TDS of those controlled releases and the total number of days of controlled releases, for any year of the mine s life. Table 1-21 also summarises the total number of uncontrolled overflow events from the dam, as predicted during the simulated 93 Monte Carlo realisations of 3 years per realisation, (resulting in 279 years in total). The total number of uncontrolled overflow events has then been assigned an equivalent failure AEP, which represents the level of containment immunity provided by the dam. The calculated maximum overflow volume, predicted to occur during a single uncontrolled overflow event, is also presented in the table, to illustrate the potential worst case overflow volume from the dam, during any 3 year mine life. The modelled capacity of raw water dam RW2 varies from zero to 5 ML, depending on the mine staging year. This raw water dam is only required during mine years 3 to 25 and its purpose is to prevent upstream catchment runoff from spilling over the high wall and into the operating pit E2. All the results for raw water dam RW2 are presented for a range of climate risk cases to demonstrate the performance of the dam under variable climate conditions. The climate risk percentiles were calculated using the results obtained from the modelled 93 Monte Carlo realisations, each representing a different 3 year climate condition. The target containment immunity for acceptable performance of all raw water dams was arbitrarily set at the 1 in 1 year AEP level. The model results presented for raw water dam RW2 indicate that the proposed dam size will not meet the target containment immunity for the dam, as the modelled frequency of uncontrolled overtopping events from the dam was equivalent to the 1 in 3 year AEP level. The model results further indicate that uncontrolled overflows from the dam are only predicted to occur during those 3 year climate risk profiles which exceed the 5 percentile risk. In Table 1-21, the maximum TDS value of 35, calculated in the dam is a ceiling limit of TDS, which was arbitrarily set in the WSBM to correspond to the TDS of sea water. This was done to limit the calculated TDS in the dam during those times when the stored water levels were very low. Document : JBT24-RPT6C-WaterManagementStrategy.docx PAGE 274
110 Table 1-21 : Raw Water Dam RW2 Annual Stored Volume, Overflows and Releases Climate Risk Peak Water Volume Stored in the Dam (ML/a) Peak TDS of Stored Water in the Dam (mg/l) Annual Total Uncontrolled Overflow Vol (ML/a) Annual Days Uncontrolled Overflow (num/a) Peak TDS of Uncontrolled Overflow (mg/l) Annual Total Release Vol (ML/a) 95 Percentile Percentile Percentile Percentile Percentile Percentile Percentile Total Number of Uncontrolled Overflow Events During 279 Years of Climate Simulations (93 cycles of 3 years) Equivalent Containment AEP of the Dam, based on Number of Uncontrolled Overflow Events (years) Maximum Volume of Single Uncontrolled Overflow Event During Worst Case 3 Year Mine Life (ML) Annual Days Release (num/a) Peak TDS of Release (mg/l) Document : JBT24-RPT6C-WaterManagementStrategy.docx PAGE 275
111 1.7.3 RAW WATER DAM RW3 Table 1-22 summarises the calculated peak annual stored water volume and the corresponding maximum annual TDS of that stored water, contained in proposed raw water dam RW3, for any year of the mine s life. Table 1-22 also summarises the calculated total annual volume of uncontrolled overflows from the dam, the corresponding TDS of those uncontrolled overflows and the total number of days of uncontrolled overflows, for any year of the mine s life. Table 1-22 also summarises the calculated total annual volume of controlled releases from the dam, the corresponding TDS of those controlled releases and the total number of days of controlled releases, for any year of the mine s life. Table 1-22 also summarises the total number of uncontrolled overflow events from the dam, as predicted during the simulated 93 Monte Carlo realisations of 3 years per realisation, (resulting in 279 years in total). The total number of uncontrolled overflow events has then been assigned an equivalent failure AEP, which represents the level of containment immunity provided by the dam. The calculated maximum overflow volume, predicted to occur during a single uncontrolled overflow event, is also presented in the table, to illustrate the potential worst case overflow volume from the dam, during any 3 year mine life. The modelled capacity of raw water dam RW3 varies from zero to 5 ML depending on the mine staging year. This raw water dam is only required during mine years 5 to 15 and its purpose is to prevent upstream catchment runoff from spilling over the high wall and into the operating pit E1. All the results for raw water dam RW3 are presented for a range of climate risk cases to demonstrate the performance of the dam under variable climate conditions. The climate risk percentiles were calculated using the results obtained from the modelled 93 Monte Carlo realisations, each representing a different 3 year climate condition. The target containment immunity for acceptable performance of all raw water dams was arbitrarily set at the 1 in 1 year AEP level. The model results presented for raw water dam RW3 indicate that the proposed dam size will exceed the target containment immunity for the dam, as the modelled frequency of uncontrolled overtopping events from the dam was equivalent to the 1 in 21 year AEP level. The model results further indicate that uncontrolled overflows from the dam are only predicted to occur during those 3 year climate risk profiles which exceed the 95 percentile risk. In other words, uncontrolled overflows from the dam are only predicted to occur during the wettest 5 percentile of all 3 year climate risk cases. Document : JBT24-RPT6C-WaterManagementStrategy.docx PAGE 276
112 Table 1-22 : Raw Water Dam RW3 Annual Stored Volume, Overflows and Releases Climate Risk Peak Water Volume Stored in the Dam (ML/a) Peak TDS of Stored Water in the Dam (mg/l) Annual Total Uncontrolled Overflow Vol (ML/a) Annual Days Uncontrolled Overflow (num/a) Peak TDS of Uncontrolled Overflow (mg/l) Annual Total Release Vol (ML/a) 95 Percentile Percentile Percentile Percentile Percentile Percentile Percentile Total Number of Uncontrolled Overflow Events During 279 Years of Climate Simulations (93 cycles of 3 years) Equivalent Containment AEP of the Dam, based on Number of Uncontrolled Overflow Events (years) Maximum Volume of Single Uncontrolled Overflow Event During Worst Case 3 Year Mine Life (ML) Annual Days Release (num/a) Peak TDS of Release (mg/l) Document : JBT24-RPT6C-WaterManagementStrategy.docx PAGE 277
113 1.7.4 RAW WATER DAM RW4 Table 1-23 summarises the calculated peak annual stored water volume and the corresponding maximum annual TDS of that stored water, contained in proposed raw water dam RW4, for any year of the mine s life. Table 1-23 also summarises the calculated total annual volume of uncontrolled overflows from the dam, the corresponding TDS of those uncontrolled overflows and the total number of days of uncontrolled overflows, for any year of the mine s life. Table 1-23 also summarises the calculated total annual volume of controlled releases from the dam, the corresponding TDS of those controlled releases and the total number of days of controlled releases, for any year of the mine s life. Table 1-23 also summarises the total number of uncontrolled overflow events from the dam, as predicted during the simulated 93 Monte Carlo realisations of 3 years per realisation, (resulting in 279 years in total). The total number of uncontrolled overflow events has then been assigned an equivalent failure AEP, which represents the level of containment immunity provided by the dam. The calculated maximum overflow volume, predicted to occur during a single uncontrolled overflow event, is also presented in the table, to illustrate the potential worst case overflow volume from the dam, during any 3 year mine life. The modelled capacity of raw water dam RW4 varies from zero to 5 ML depending on the mine staging year. This raw water dam is only required during mine years 3 to 25 and its purpose is to prevent upstream catchment runoff from spilling over the high wall and into the operating pit W. All the results for raw water dam RW4 are presented for a range of climate risk cases to demonstrate the performance of the dam under variable climate conditions. The climate risk percentiles were calculated using the results obtained from the modelled 93 Monte Carlo realisations, each representing a different 3 year climate condition. The target containment immunity for acceptable performance of all raw water dams was arbitrarily set at the 1 in 1 year AEP level. The model results presented for raw water dam RW4 indicate that the proposed dam size will exceed the target containment immunity for the dam, as the modelled frequency of uncontrolled overtopping events from the dam was equivalent to the 1 in 15 year AEP level. The model results further indicate that uncontrolled overflows from the dam are only predicted to occur during those 3 year climate risk profiles which exceed the 99 percentile risk. In other words, uncontrolled overflows from the dam are only predicted to occur during the wettest 1 percentile of all 3 year climate risk cases. Document : JBT24-RPT6C-WaterManagementStrategy.docx PAGE 278
114 Table 1-23 : Raw Water Dam RW4 Annual Stored Volume, Overflows and Releases Climate Risk Peak Water Volume Stored in the Dam (ML/a) Peak TDS of Stored Water in the Dam (mg/l) Annual Total Uncontrolled Overflow Vol (ML/a) Annual Days Uncontrolled Overflow (num/a) Peak TDS of Uncontrolled Overflow (mg/l) Annual Total Release Vol (ML/a) 95 Percentile Percentile Percentile Percentile Percentile Percentile Percentile Total Number of Uncontrolled Overflow Events During 279 Years of Climate Simulations (93 cycles of 3 years) Equivalent Containment AEP of the Dam, based on Number of Uncontrolled Overflow Events (years) Maximum Volume of Single Uncontrolled Overflow Event During Worst Case 3 Year Mine Life (ML) Annual Days Release (num/a) Peak TDS of Release (mg/l) Document : JBT24-RPT6C-WaterManagementStrategy.docx PAGE 279
115 1.8 PIT FLOOR SUMP STORAGE AND AVAILABILITY PIT E1 Northern Energy Corporation Ltd Table 1-24 summarises the annual dewatering volume pumped from pit E1 into environmental dam EV2, for any year of the mine s life. The calculated TDS of the water stored in pit E1 is also presented in this table. Table 1-24 also summarises the annual maximum water volume calculated to overtop the capacity of the pit floor sump and then flood onto the pit floor, for any year of the mine s life. Table 1-24 also summarises the total number of days that the pit floor sump capacity is calculated to be exceeded, for any year of the mine s life. The table also provides the maximum number of consecutive days that the pit floor sump is expected to be overtopped, thereby identifying the length of the critical overtopping period when the pit floor would be flooded and mining operations would be halted as a result. The modelled capacity of pit floor sump in pit E1 is 4 ML, and the pump dewatering rate for this sump is 2 L/s, for all mine staging years. The pit sump capacity equates to 2.3 days pumping volume at the full pump dewatering rate. Pumped dewatering into environmental dam EV2 is halted if the stored water volume in the receiving dam is at capacity. The target risk for acceptable availability of the pit floor was arbitrarily set at the 8 percentile climate risk. In other words, the pit floor sumps were sized to only overflow and flood the pit floor during the wettest 2 percentile of all climate cases. The model results indicate that this pit floor sump size and dewatering rate will satisfy the target pit availability. Table 1-24 : Pit E1 Annual Flooded Volume, Dewatering, Pit Availability and TDS Climate Risk Annual Pumped Water Volume Dewatered from the Pit (ML/a) Peak TDS of Stored Water in the Pit (mg/l) Annual Total Overflow Vol from Pit Floor Sump into Pit (ML/a) Number of Days the Pit Floor is Flooded (num/a) 95 Percentile Percentile Percentile Percentile Percentile Percentile Percentile Max Number of Consecutive Days the Pit Floor is Flooded (not annualised) 1439 Document : JBT24-RPT6C-WaterManagementStrategy.docx PAGE 28
116 1.8.2 PIT E2 Table 1-25 summarises the annual dewatering volume pumped from pit E2 into environmental dam EV2, for any year of the mine s life. The calculated TDS of the water stored in pit E2 is also presented in this table. Table 1-25 also summarises the annual maximum water volume calculated to overtop the capacity of the pit floor sump and then flood onto the pit floor, for any year of the mine s life. Table 1-25 also summarises the total number of days that the pit floor sump capacity is calculated to be exceeded, for any year of the mine s life. The table also provides the maximum number of consecutive days that the pit floor sump is expected to be overtopped, thereby identifying the length of the critical overtopping period when the pit floor would be flooded and mining operations would be halted as a result. The modelled capacity of pit floor sump in pit E2 is 5 ML, and the pump dewatering rate for this sump is 2 L/s, for all mine staging years except year 3, as this pit is amalgamated with Pit E1 at year 3. The pit sump capacity equates to 2.9 days pumping volume at the full dewatering rate. Pumped dewatering into environmental dam EV2 is halted if the stored water volume in the receiving dam is at capacity. The target risk for acceptable availability of the pit floor was arbitrarily set at the 8 percentile climate risk. In other words, the pit floor sumps were sized to only overflow and flood the pit floor during the wettest 2 percentile of all climate cases. The model results indicate that this pit floor sump size and dewatering rate will satisfy the target pit availability. Table 1-25 : Pit E2 Annual Flooded Volume, Dewatering, Pit Availability and TDS Climate Risk Annual Pumped Water Volume Dewatered from the Pit (ML/a) Peak TDS of Stored Water in the Pit (mg/l) Annual Total Overflow Vol from Pit Floor Sump into Pit (ML/a) Number of Days the Pit Floor is Flooded (num/a) 95 Percentile Percentile Percentile Percentile Percentile Percentile Percentile Max Number of Consecutive Days the Pit Floor is Flooded (not annualised) 29 Document : JBT24-RPT6C-WaterManagementStrategy.docx PAGE 281
117 1.8.3 PIT N Table 1-26 summarises the annual dewatering volume pumped from pit N into environmental dam EV1, for any year of the mine s life. The calculated TDS of the water stored in pit N is also presented in this table. Table 1-26 also summarises the annual maximum water volume calculated to overtop the capacity of the pit floor sump and then flood onto the pit floor, for any year of the mine s life. Table 1-26 also summarises the total number of days that the pit floor sump capacity is calculated to be exceeded, for any year of the mine s life. The table also provides the maximum number of consecutive days that the pit floor sump is expected to be overtopped, thereby identifying the length of the critical overtopping period when the pit floor would be flooded and mining operations would be halted as a result. The modelled capacity of pit floor sump in pit N is 2 ML, and the pump dewatering rate for this sump is 2 L/s, for all mine staging years up to year 1. The pit sump capacity equates to 1.2 days pumping volume at the full dewatering rate. Pumped dewatering into environmental dam EV1 is halted if the stored water volume in the receiving dam is at capacity. After mine year 1, this pit ceases to be an operational pit and it transitions to an in-pit tailings storage. This transition is represented in the GoldSim model by storage dam TDP, which becomes functional after mine year 1, whereas pit N becomes non-functional after mine year 1. The target risk for acceptable availability of the pit floor was arbitrarily set at the 8 percentile climate risk. In other words, the pit floor sumps were sized to only overflow and flood the pit floor during the wettest 2 percentile of all climate cases. The model results indicate that this pit floor sump size and dewatering rate will exceed the target pit availability. Table 1-26 : Pit N Annual Flooded Volume, Dewatering, Pit Availability and TDS Climate Risk Annual Pumped Water Volume Dewatered from the Pit (ML/a) Peak TDS of Stored Water in the Pit (mg/l) Annual Total Overflow Vol from Pit Floor Sump into Pit (ML/a) Number of Days the Pit Floor is Flooded (num/a) 95 Percentile Percentile Percentile Percentile Percentile Percentile Percentile Max Number of Consecutive Days the Pit Floor is Flooded (not annualised) 69 Document : JBT24-RPT6C-WaterManagementStrategy.docx PAGE 282
118 1.8.4 PIT W Table 1-27 summarises the annual dewatering volume pumped from pit W into environmental dam EV3, for any year of the mine s life. The calculated TDS of the water stored in pit W is also presented in this table. Table 1-27 also summarises the annual maximum water volume calculated to overtop the capacity of the pit floor sump and then flood onto the pit floor, for any year of the mine s life. Table 1-27 also summarises the total number of days that the pit floor sump capacity is calculated to be exceeded, for any year of the mine s life. The table also provides the maximum number of consecutive days that the pit floor sump is expected to be overtopped, thereby identifying the length of the critical overtopping period when the pit floor would be flooded and mining operations would be halted as a result. The modelled capacity of pit floor sump in pit W is 3 ML, and the pump dewatering rate for this sump is 2 L/s, for all mine staging years after mine year 1, as this pit does not exist at mine year 1. The pit sump capacity equates to 1.7 days pumping volume at the full dewatering rate. Pumped dewatering into environmental dam EV3 is halted if the stored water volume in the receiving dam is at capacity. The target risk for acceptable availability of the pit floor was arbitrarily set at the 8 percentile climate risk. In other words, the pit floor sumps were sized to only overflow and flood the pit floor during the wettest 2 percentile of all climate cases. The model results indicate that this pit floor sump size and dewatering rate will satisfy the target pit availability. Table 1-27 : Pit W Annual Flooded Volume, Dewatering, Pit Availability and TDS Climate Risk Annual Pumped Water Volume Dewatered from the Pit (ML/a) Peak TDS of Stored Water in the Pit (mg/l) Annual Total Overflow Vol from Pit Floor Sump into Pit (ML/a) Number of Days the Pit Floor is Flooded (num/a) 95 Percentile Percentile Percentile Percentile Percentile Percentile Percentile Max Number of Consecutive Days the Pit Floor is Flooded (not annualised) 2251 Document : JBT24-RPT6C-WaterManagementStrategy.docx PAGE 283
119 1.9 MINE CLOSURE Northern Energy Corporation Ltd As noted in Section 9.17, at mine closure, only pit E1 and pit W are intended to remain. At mine closure, pit E2 will have amalgamated with pit E1 and this transition has been represented in the GoldSim model by pit E2 becoming non-functional after mine year 25. As the Horse Creek diversion channel is proposed to be constructed through dumped spoil overburden, there is some uncertainty regarding the amount of water which could be potentially lost from the creek watercourse into the surrounding spoil material. Two alternative mine closure models were prepared to evaluate the hydrologic performance of the Elimatta mine closure case and to test the sensitivity of the model s results to varying amounts of flow leakage from Horse Creek into the surrounding spoil material. The first mine closure model did not include any flow leakage from the diverted Horse Creek watercourse into the surrounding spoil material and into the final voids. This model assumed that the Horse Creek diversion channel would perform like an impermeable pipe, with all creek flows being able to flow past the final voids, without any leakage into the spoil and hence into the final voids. The second mine closure model made allowance for flow leakage from the diverted Horse Creek watercourse into the surrounding spoil material and into the final voids on either side of the diverted creek channel. The leakage rates for Horse Creek water into the surrounding spoil material were varied from 1. m/day to.1 m/day over the first 1 years after the mine closure. The leakage rate was then kept constant at.1 m/day for the remainder of the simulation. Refer to Section 9.17 for additional details IMPACTS TO HORSE CREEK RUNOFF QUANTITY NO LEAKAGE FROM HORSE CREEK Table 1-28 summarises the calculated daily runoff rates for the Horse Creek receiving waters at the upstream boundary of the site (northern boundary of MLA 5254) and at the downstream boundary of the Elimatta Coal Mine Development site (southern boundary of MLA 527), for the mine closure case. The calculated daily flow leakage from the Horse Creek watercourse into the surrounding spoil material, and hence into the final voids, is also presented in Table 1-28 (this flow is zero for the no leakage sensitivity case). Table 1-28 also presents the corresponding calculated daily runoff rates for Horse Creek at the downstream boundary of the site, for the pre-mining case. This has enabled a comparison of the pre-mining flow rates against the mine closure flow rates, to assess the relative impacts of the closed mine on the Horse Creek flow behaviour. The model results are presented for a range of climate risk cases to demonstrate the potential impacts of the Elimatta Coal Mine under variable climate conditions. The climate risk percentiles were calculated using the results obtained from the modelled 93 Monte Carlo realisations, each representing a potentially different 3 year climate condition. The results indicate that the final landform proposed for the Elimatta Coal Mine closure will reduce daily runoff rates by between zero and 1%, which is consistent with the relative proportion of catchment area affected by the closed mine site. The model results indicate that the Elimatta mine closure will have no measurable impact on Horse Creek flow behaviour, for climate risk up to the 5 percentile case. Document : JBT24-RPT6C-WaterManagementStrategy.docx PAGE 284
120 Table 1-28 : Predicted Impacts of Mine Closure on Horse Creek Flow Behaviour No Modelled Flow Leakage from Horse Creek to the Surrounding Spoil and Final Voids Climate Risk Horse Creek Daily Runoff Upstream Elimatta Mine All Cases (ML/d) Horse Creek Daily Flow Leakage to Spoil / Voids Mine Close Case (ML/d) Horse Creek Daily Runoff Downstream Elimatta Mine Pre-Mine Case (ML/d) Horse Creek Daily Runoff Downstream Elimatta Mine Mine Close Case (ML/d) Relative Change Pre-Mine to Mine Close (%) 95 Percentile % 9 Percentile % 8 Percentile % 5 Percentile % 2 Percentile.% 1 Percentile.% Document : JBT24-RPT6C-WaterManagementStrategy.docx PAGE 285
121 1.9.2 PIT E1 FINAL VOID LONG TERM BEHAVIOUR NO LEAKAGE FROM HORSE CREEK Table 1-29 summarises the calculated maximum water volume stored in the pit E1 final void and the corresponding TDS of the stored water, throughout the entire 123 year long term simulation. Table 1-29 also summarises the calculated total volume of uncontrolled overflows from pit E1, and the total number of days of uncontrolled overflows, throughout the entire 123 year long term simulation. The capacity of the final void for pit E1 is estimated at 72, ML. The results shown in Table 1-29 indicate that the water volumes expected to be collected in the pit E1 final void will be well contained in the void, with the model results indicating that there would be no overflows to the Horse Creek receiving waters, for all modelled climate risk cases. In Table 1-29, the maximum TDS value of 35, calculated in the pit is a ceiling limit of TDS, which was arbitrarily set in the WSBM to correspond to the TDS of sea water. This was done to limit the calculated TDS in the pit during those times when the stored water levels were very low. The modelling results indicate that the TDS of the stored water in the final void of pit E1 will be very high. This is partly due to the residual exposed areas of hard stand catchment (pit floor), and spoil catchment (void batters), which will continue to leach saline runoff during storm events of sufficient magnitude to create runoff into the final void. However, the high saline levels are primarily due to the effects of evaporation. As can be noted from Figure 1.1, evaporation is predicted to stabilise the stored water volume in the void over time, however, the stored salt content will continue to gradually increase due to salt leaching from the catchment, resulting in an increased salt concentration of the stabilised water volume. Table 1-29 : Pit E1 Final Void - Long Term Behaviour (No Horse Creek Leakage) Climate Risk Maximum Water Volume Stored in the Pit (ML) Maximum Uncontrolled Overflow Vol from Pit (ML) Days of Uncontrolled Overflow from Pit (number) Maximum TDS of Water Stored in the Pit (mg/l) 95 Percentile Percentile Percentile Percentile Document : JBT24-RPT6C-WaterManagementStrategy.docx PAGE 286
122 Figure 1.1 : Pit E1 Final Void - Long Term Behaviour (No Horse Creek Leakage) Document : JBT24-RPT6C-WaterManagementStrategy.docx PAGE 287
123 1.9.3 PIT W FINAL VOID LONG TERM BEHAVIOUR NO LEAKAGE FROM HORSE CREEK Table 1-3 summarises the calculated maximum water volume stored in the pit W final void and the corresponding TDS of the stored water, throughout the entire 123 year long term simulation. Table 1-3 also summarises the calculated total volume of uncontrolled overflows from pit W, and the total number of days of uncontrolled overflows, throughout the entire 123 year long term simulation. The capacity of the final void for pit W is estimated at 34, ML. The results shown in Table 1-3 indicate that the water volumes expected to be collected in the pit W final void will be well contained in the void, with the model results indicating that there would be no overflows to the Horse Creek receiving waters, for all modelled climate risk cases. In Table 1-3, the maximum TDS value of 35, calculated in the pit is a ceiling limit of TDS, which was arbitrarily set in the WSBM to correspond to the TDS of sea water. This was done to limit the calculated TDS in the pit during those times when the stored water levels were very low. The modelling results indicate that the TDS of the stored water in the final void of pit W will be very high. This is partly due to the residual exposed areas of hard stand catchment (pit floor), and spoil catchment (void batters), which will continue to leach saline runoff during storm events of sufficient magnitude to create runoff into the final void. However, the high saline levels are primarily due to the effects of evaporation. As can be noted from Figure 1.2, evaporation is predicted to stabilise the stored water volume in the void over time, however, the stored salt content will continue to gradually increase due to salt leaching from the catchment, resulting in an increased salt concentration of the stabilised water volume. Table 1-3 : Pit W Final Void - Long Term Behaviour ( No Horse Creek Leakage) Climate Risk Annual Water Volume Stored in the Pit (ML/a) Annual Volume of Uncontrolled Overflow from Pit (ML/a Days of Uncontrolled Overflow from the Pit (num/a) TDS of Water Stored in the Pit (mg/l) 95 Percentile Percentile Percentile Percentile 4 35 Document : JBT24-RPT6C-WaterManagementStrategy.docx PAGE 288
124 Figure 1.2 : Pit W Final Void - Long Term Behaviour (No Horse Creek Leakage) Document : JBT24-RPT6C-WaterManagementStrategy.docx PAGE 289
125 1.9.4 IMPACTS TO HORSE CREEK RUNOFF QUANTITY WITH LEAKAGE FROM HORSE CREEK Table 1-31 summarises the calculated daily runoff rates for the Horse Creek receiving waters at the upstream boundary of the site (northern boundary of MLA 5254) and at the downstream boundary of the Elimatta Coal Mine Development site (southern boundary of MLA 527), for the mine closure case. The calculated daily flow leakage from the Horse Creek watercourse into the surrounding spoil material, and hence into the final voids, is also presented in Table 1-31 Table 1-31 also presents the corresponding calculated daily runoff rates for Horse Creek at the downstream boundary of the site, for the pre-mining case. This has enabled a comparison of the pre-mining flow rates against the mine closure flow rates, to assess the relative impacts of the closed mine on the Horse Creek flow behaviour. The model results are presented for a range of climate risk cases to demonstrate the potential impacts of the Elimatta Coal Mine under variable climate conditions. The climate risk percentiles were calculated using the results obtained from the modelled 93 Monte Carlo realisations, each representing a potentially different 3 year climate condition. The results indicate that the final landform proposed for the Elimatta Coal Mine closure could potentially reduce daily runoff rates by up to 7%. However, as noted in Section 9.17, this result is most certainly conservative, given the relatively high permeability rates adopted for this sensitivity case model. We would expect that the real answer will lie somewhere between the results quoted for the no leakage from Horse Creek sensitivity case and this leakage sensitivity case. In reality, there will be some natural leakage from the natural creek channel into the surrounding natural ground profile and this leakage has already been inherently allowed for in the AWBM runoff model parameters adopted for the catchment upstream of the mine site and the catchments through the mine site. The conservative sensitivity case reported herein has simply assumed that additional leakage would occur into the spoil from the diverted Horse Creek channel, whereas in fact, some of that leakage would have already been accounted for in the AWBM parameters adopted in the modelling. Nevertheless, the model results for this flow leakage sensitivity case do highlight the potential for large volumes of flow leakage from the Horse Creek channel into the surrounding spoil material and hence into the final voids. This highlights the need for the diversion channel to be designed and constructed to minimise the potential for leakage into the underlying spoil material. This will require the selection of appropriate bedding material which is relatively impermeable for the channel bed, together with the application of sound construction techniques to achieve reliable compaction of that bedding material to minimise the potential leakage. Document : JBT24-RPT6C-WaterManagementStrategy.docx PAGE 29
126 Table 1-31 : Predicted Impacts of Mine Closure on Horse Creek Flow Behaviour With Modelled Flow Leakage from Horse Creek to the Surrounding Spoil and Final Voids Climate Risk Horse Creek Daily Runoff Upstream Elimatta Mine All Cases (ML/d) Horse Creek Daily Flow Leakage to Spoil / Voids Mine Close Case (ML/d) Horse Creek Daily Runoff Downstream Elimatta Mine Pre-Mine Case (ML/d) Horse Creek Daily Runoff Downstream Elimatta Mine Mine Close Case (ML/d) Relative Change Pre-Mine to Mine Close (%) 95 Percentile % 9 Percentile % 8 Percentile % 5 Percentile % 2 Percentile.% 1 Percentile.% Document : JBT24-RPT6C-WaterManagementStrategy.docx PAGE 291
127 1.9.5 PIT E1 FINAL VOID LONG TERM BEHAVIOUR WITH LEAKAGE FROM HORSE CREEK Table 1-32 summarises the calculated maximum water volume stored in the pit E1 final void and the corresponding TDS of the stored water, throughout the entire 123 year long term simulation. Table 1-32 also summarises the calculated total volume of uncontrolled overflows from pit E1, and the total number of days of uncontrolled overflows, throughout the entire 123 year long term simulation. The capacity of the final void for pit E1 is estimated at 72, ML. The results shown in Table 1-32 indicate that the water volumes expected to be collected in the pit E1 final void will be contained in the void, with the model results indicating that there would be no overflows to the Horse Creek receiving waters, for all modelled climate risk cases. In Table 1-32, the maximum TDS value of 35, calculated in the pit is a ceiling limit of TDS, which was arbitrarily set in the WSBM to correspond to the TDS of sea water. This was done to limit the calculated TDS in the pit during those times when the stored water levels were very low. The modelling results indicate that the TDS of the stored water in the final void of pit E1 will be very high. This is partly due to the residual exposed areas of hard stand catchment (pit floor), and spoil catchment (void batters), which will continue to leach saline runoff during storm events of sufficient magnitude to create runoff into the final void. However, the high saline levels are primarily due to the effects of evaporation. As can be noted from Figure 1.3, evaporation is predicted to stabilise the stored water volume in the void over time, however, the stored salt content will continue to gradually increase due to salt leaching from the catchment, resulting in an increased salt concentration of the stabilised water volume. Table 1-32 : Pit E1 Final Void - Long Term Behaviour (With Horse Creek Leakage) Climate Risk Maximum Water Volume Stored in the Pit (ML) Maximum Uncontrolled Overflow Vol from Pit (ML) Days of Uncontrolled Overflow from Pit (number) Maximum TDS of Water Stored in the Pit (mg/l) 95 Percentile Percentile Percentile Percentile Document : JBT24-RPT6C-WaterManagementStrategy.docx PAGE 292
128 Figure 1.3 : Pit E1 Final Void - Long Term Behaviour (With Horse Creek Leakage) Document : JBT24-RPT6C-WaterManagementStrategy.docx PAGE 293
129 1.9.6 PIT W FINAL VOID LONG TERM BEHAVIOUR WITH LEAKAGE FROM HORSE CREEK Table 1-33 summarises the calculated maximum water volume stored in the pit W final void and the corresponding TDS of the stored water, throughout the entire 123 year long term simulation. Table 1-33 also summarises the calculated total volume of uncontrolled overflows from pit W, and the total number of days of uncontrolled overflows, throughout the entire 123 year long term simulation. The capacity of the final void for pit W is estimated at 34, ML. The results shown in Table 1-33 indicate that the water volumes expected to be collected in the pit W final void will be contained in the void, with the model results indicating that there would be no overflows to the Horse Creek receiving waters, for all modelled climate risk cases. However, the model results do indicate that the final void does come close to overtopping in the initial years of the simulation, due to the high leakage rates adopted for the early years of the Horse Creek channel diversion. The modelling results indicate that the TDS of the stored water in the final void of pit W will be high. This is partly due to the residual exposed areas of hard stand catchment (pit floor), and spoil catchment (void batters), which will continue to leach saline runoff during storm events of sufficient magnitude to create runoff into the final void. However, the high saline levels are primarily due to the effects of evaporation. As can be noted from Figure 1.4, evaporation is predicted to stabilise the stored water volume in the void over time, however, the stored salt content will continue to gradually increase due to salt leaching from the catchment, resulting in an increased salt concentration of the stabilised water volume. Table 1-33 : Pit W Final Void - Long Term Behaviour (With Horse Creek Leakage) Climate Risk Annual Water Volume Stored in the Pit (ML/a) Annual Volume of Uncontrolled Overflow from Pit (ML/a Days of Uncontrolled Overflow from the Pit (num/a) TDS of Water Stored in the Pit (mg/l) 95 Percentile Percentile Percentile Percentile Document : JBT24-RPT6C-WaterManagementStrategy.docx PAGE 294
130 Figure 1.4 : Pit W Final Void - Long Term Behaviour (With Horse Creek Leakage) Document : JBT24-RPT6C-WaterManagementStrategy.docx PAGE 295
131 11. - INDICATIVE EA CONDITIONS (WATER) Northern Energy Corporation Ltd Based on the review of the recorded and modelling water quality data and quantity data available for the Horse Creek receiving waters and for the surrounding regional environment, indicative Environmental Authority conditions for the management of mine affected water associated with the Elimatta Coal Mine Project, have been prepared. The following Table 11-1 presents indicative mine water release limits for the project. Table 11-1 : Mine Affected Water Release Limits Quality Characteristic Release Limits Monitoring Frequency Comments Electrical Conductivity (µs/cm) Horse Creek < 7 Daily during the release, with first sample taken within the first 2 hours of the release ph (ph Unit) 6.5 (min) and 9. (max) Daily during the release, with first sample taken within the first 2 hours of the release Turbidity (NTU) Suspended Solids (mg/l) 7 Daily during the release, with first sample taken within the first 2 hours of the release Suspended Solids are required to measure the performance of sediment and erosion control measures Sulphate SO4 (mg/l) 25 Daily during the release, with first sample taken within the first 2 hours of the release Drinking water environmental values from NHMRC 26 or ANZECC guidelines. Document : JBT24-RPT6C-WaterManagementStrategy.docx PAGE 296
132 The following Table 11-2 presents indicative mine water release contaminant trigger levels for the project. Table 11-2 : Release Contaminant Trigger Investigation Levels Quality Characteristic Trigger Levels (µg/l) Comment on Trigger Level Monitoring Frequency Aluminium 55 Arsenic 13 Cadmium.2 Chromium 1 Copper 2 Iron 3 Lead 4 Mercury.2 Nickel 11 Zinc 8 Boron 37 Cobalt 9 Manganese 19 Molybdenum 34 Ammonia 9 Nitrate 11 Petrol Hydrocarbons (C6-C9) 2 Petrol Hydrocarbons (C1-C36) 1 Fluoride 2 For aquatic ecosystem protection, based on SMD guideline For aquatic ecosystem protection, based on SMD guideline For aquatic ecosystem protection, based on SMD guideline For aquatic ecosystem protection, based on SMD guideline For aquatic ecosystem protection, based on LOR for ICPMS For aquatic ecosystem protection, based on low reliability guideline For aquatic ecosystem protection, based on SMD guideline For aquatic ecosystem protection, based on LOR for CVFIMS For aquatic ecosystem protection, based on SMD guideline For aquatic ecosystem protection, based on SMD guideline For aquatic ecosystem protection, based on SMD guideline For aquatic ecosystem protection, based on low reliability guideline For aquatic ecosystem protection, based on SMD guideline For aquatic ecosystem protection, based on low reliability guideline For aquatic ecosystem protection, based on SMD guideline For aquatic ecosystem protection, based on ambient Qld WQ guideline for TN (26) Protection of livestock and short term irrigation guideline Document : JBT24-RPT6C-WaterManagementStrategy.docx PAGE 297
133 The following Table 11-4 and Figure 11.1 present indicative gauging and monitoring station locations for the project. Table 11-3 : Gauging and Monitoring Station Locations Receiving Waters Gauging Station Gauging Station Coordinates (MGA94 Z55) Purpose Horse Creek SM1 Easting Northing Measure flow rate in Horse Creek at upstream boundary of the MLA 5254 for passing flows release triggers Horse Creek SM3 Easting Northing Measure water quality in Horse Creek at downstream boundary of MLA 5254 for assessment of in-stream water quality in the vicinity of the wetland Horse Creek SM7 Easting Northing Measure water quality in Horse Creek at downstream boundary of MLA 527 for assessment of in-stream water quality downstream of all release points Document : JBT24-RPT6C-WaterManagementStrategy.docx PAGE 298

134 Figure 11.1 : Gauging and Monitoring Station Locations Document : JBT24-RPT6C-WaterManagementStrategy.docx PAGE 299