ALLEGHENY COUNTY May 9, 2008
|
|
|
- Lesley Cummings
- 5 years ago
- Views:
Transcription
1 ALLEGHENY COUNTY May 9, 2008
2 What can you expect? In the next two hours An overview of the task force A video and verbal overview of our region s water-related problems Overview of southwestern Pennsylvania s current institutional system Exploration of multi-governmental collaboration Public input on problems and regional models

3 Task Force Background Over the last decade, several regional studies have provided extensive information on our region s water and sewage problems. These efforts have consistently recommended regional collaboration to adequately confront our problems. The Regional Water Management Task Force was formed to begin achieving consensus on action steps.

4 Representation/Scope Diverse, high-level representation from 11 southwestern Pennsylvania counties Appointed with input from county commissioners and state legislators Chair Dr. Jared Cohon President, Carnegie Mellon University Vice Chair Dr. Angelo Armenti President, California University of Pennsylvania 15 additional members from throughout the region Dr. Jared Cohon


5 Public Water and Public Sewage Services in Southwestern Pennsylvania
6 Mission Solving our region s water-related problems in a way that best serves our citizens Protect the public s health, ensure environmental sustainability, provide for the region s economic vitality, and avoid costly regulatory actions Institutional not technical project Public engagement to determine consensus Implementation


7 Our water seems fine The region has made great strides, BUT Southwestern Pennsylvania continues to face one of the worst combinations of water problems in the nation.
8 Water Quality has Improved, but Many Problems Remain 900% 800% 700% 600% 500% 400% 300% 200% 100% 0% Industrial Metals 70 s 90 s Fecal Coliform Industrial Metals Fecal Coliform Drinking Water Standard Source: Analysis of U.S.G.S. data monitoring
9 Problems Sewage An urban problem combined and sanitary sewer overflows And a rural problem malfunctioning septic systems Wildcat sewers
10 Sewage Overflows From Sewers Into Our Rivers and Streams By design and by failure.


11 Combined Sewer Overflows
12 SW PA Has Among the Worst Sewage Overflow Problem in the U.S. States with the Most Combined Sewer Overflows RANK STATE CSOS 1 Pennsylvania 1,631 2 Ohio 1,378 3 New York 1,032 4 Indiana Illinois West Virginia Missouri Kentucky Massachusetts Michigan 262 Communities with CSOs Combined Sewer Overflows by Region RANK PA REGION CSOS 1 Southwest Northeast Southeast North Central South Central Northwest 65 TOTAL 1631
13 Sewage Overflows Exist Throughout the Region States with the Most Combined Sewer Overflows RANK STATE CSOS 1 Pennsylvania 1,631 2 Ohio 1,378 3 New York 1,032 4 Indiana 876 Southwest PA Illinois West Virginia Missouri Kentucky Massachusetts Michigan Communities with CSOs Number of CSOs by County

14 Major Rivers are Unsafe for Bodily Contact 4 Out of Every 5 Days 100% Allegheny County Health Department CSO Warnings May 15 - September 30 80% 60% 40% 20% 0%


15 Sanitary Sewer Overflows 600+ Each Year
16 Allegheny Armstrong Beaver Butler Fayette Greene Indiana Lawrence Somerset Washington Westmoreland Another Sewage Problem: On-lot septic system malfunction 300,000 Homes Are Not on Public Sewers - 10,000 20,000 30,000 40,000 50,000
17 100% 90% 80% 70% 60% 50% 40% 30% 20% 10% 0% Allegheny Armstrong Beaver Butler Fayette Greene Indiana Lawrence Somerset Washington Westmoreland Human waste disposal methods by county in southwestern Pennsylvania. Black (centralized WWTP); gray (on-site systems); white ( other; e.g., cesspools, straight pipes)
18 but most of SWPA is Unsuitable for Conventional On-lot Systems USDA Soil Surveys show most of our soil does not support the use of traditional septic systems. Limited Use Slight or No Limitation


19 Thousands of Homes Have No Sewage Treatment At All As many as 27,000 homes in SWPA discharge untreated sewage directly into streets or streams.


20 SW PA Has Worst Contamination Problems in Ohio River Basin % Water Samples Violating Safe Contact Standards for Fecal Coliform/E. coli, 2006
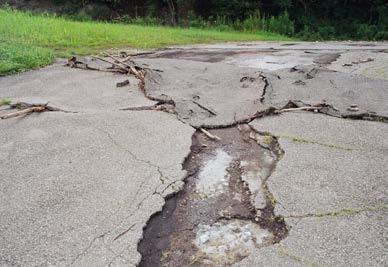
21 Problems Flooding and Stormwater Between 1955 and 2000, PA s median yearly flood damage was $9.5 million $4.4 billion in cumulative damages Southwest PA has been declared a federal disaster area due to flooding 7 times since 1984 Continuing disconnect between land use and stormwater will only worsen these problems


22 September, 2004


23
24 Problems Abandoned Mine Drainage 2,800 of 4,000 miles of PA s AMD degraded streams are located in the Ohio River basin. Moreover, northern West Virginia has 1,100 abandoned mines discharging into the Monongahela River watershed.

25


26
27 Only some of our problems Sewage, AMD and stormwater are only three of our region s many problems Others include water main breaks, aging infrastructure, industrial pollution In a recent task force poll, 49% of respondents reported being directly affected by at least one of the region s water problems Holistic approach needed


28 Why should we care? Water does not recognize human or political boundaries Affects all of our region s residents Urban and rural Regardless of age, sex, race or income level
29 Why should we care? Significant costs of inaction While there have been no recent outbreaks of waterborne disease, our current situation is extremely vulnerable Imposed limits on growth and development due to inadequate infrastructure State and federal regulatory actions, which will lead to even greater costs With aging infrastructure, our problems will only get worse The status quo is at best untenable Neither safe, economically beneficial, nor legal for us to continue in this manner


30 Water is One of Southwestern PA s Greatest Regional Assets Ohiopyle Pittsburgh Recreation Tourism Economic Development National Security Quality of Life Kittanning Beaver
31 These important problems must be confronted aggressively, but significant obstacles exist to fixing them.
32 Huge Cost of Addressing the Needs Existing sewer systems New sewer systems Septic system upgrades Total need $8.0 billion $0.5 billion $0.5 billion $9 billion DOES NOT ACCOUNT FOR NEEDED WATER INFRASTRUCTURE, AMD, AND STORMWATER MONIES
33 Our Financing Approach Makes Improving the Systems Difficult Some public needs are broadly funded through taxes (e.g. education, welfare, roads) Others are funded by insurance (health care) Water and sewage system funding through direct user expenditures with less state or federal monies Applies to both public and on-lot systems

34 Water Quality Problems Downstream The Causes of the Problems Are Complex and Regional Are Caused by problems Upstream in Different Communities, Counties, and States Pittsburgh Surface Water Intake Ground Water Intake CSO Outfalls Malfunctioning Septics Morgantown

35 Over 1,000 Different Entities and 1,100,000+ Homes Responsible 11 Counties 601 M unicipalities 268 Authorities M any other jurisdictions 1,140,300 Households
36 Number of Authorities by County Allegheny Armstrong Beaver Butler Fayette Greene Indiana Lawrence Somerset Washington Westmoreland
37 Number of People per Authority Allegheny Armstrong Beaver Butler Fayette Greene Indiana Lawrence Somerset Washington Westmoreland
38 Number of Square Miles per Authority Allegheny Armstrong Beaver Butler Fayette Greene Indiana Lawrence Somerset Washington Westmoreland
39 Some of these entities are doing well and some not doing so well Deteriorating infrastructure Average age is increasing Large disparity in investment Lack of planning Sewage discharges overlooked Corrective action plans, consent orders, tap in restrictions Aging workforce
40 Cooperation Takes Many Forms As a region, we value the autonomy of municipalities and there are strengths to this system which can be capitalized on However, sometimes we pay a cost Not local ineptitude but regional inefficiency Water is a multi-municipal problem Nuances of regional approaches to regional problems Not about losing identity or voice Task Force does not have a preconceived solution, but rather trying to determine the best way to proceed because we all live downstream
41 Regional approaches can work Examples in the region Indiana County Municipal Services Authority (ICMSA) Bundles investments to get best funding, solving serious problems, enjoys economy of scale Municipal Authority of Westmoreland County (MAWC) Efficiently interconnected water systems Consolidated infrastructure and expertise in both water and sewage 3 Rivers Wet Weather, Inc. Southwestern Pennsylvania Commission (SPC)
42 Regional approaches can work Other metro areas: Milwaukee (Southeastern Wisconsin Regional Planning Commission) Minneapolis-St. Paul (Metropolitan Council) Cleveland (Northeastern Ohio Areawide Coordinating Agency) Atlanta (Metropolitan North Georgia Water Planning District)
43 How multi-municipal collaboration might help us Efficiency Operations and management Shared equipment, technology and personnel Money Greater access to funding Coordinated investment Equity Greater ability to work out problems on a watershed basis Stabilized, appropriate and common fees Shared planning regarding future water decisions Upstream/downstream, Long term sustainability Regulatory Relief
44 Models for Input These models are offered simply to give you a clearer sense of the possibilities and should not be interpreted as recommendations. 4 models constructed to aid in public input process
45 Evaluation Criteria Ranked in order of importance Efficiency/cost Environmental protection/sustainability Accountability Leadership Security Equity Regional Competitiveness (Political Feasibility)
46 Model A Regional Planning Southwestern PA Regional Water District Integrated and comprehensive regional water planning Recommendations on sewage service areas, which problems should be addressed first and by which means Per capita tax to support planning functions No specific enforcement power
47 Model B Regional Planning and Financing Southwestern PA Regional Water District Integrated and comprehensive regional water planning Per capita tax to support planning functions Taxing authority to create regional water trust fund Pooling federal, state and local dollars to confront problems in coordinated fashion Local and regional water plans required
48 Model C Watershed/County Operations and Planning Creation of multiple authorities on watershed or county basis Each authority would complete enforceable water resource plans for its area Taxing authority for infrastructure investment Transfer of system ownership and/or operations to authority would be permissible Creation of regional coordinating committee
49 Model D Incentives for Decentralized Collaboration SWPA Water Management Advisory Committee Include participation from all local, regional, state and federal stakeholders Best Management Practices collection and circulation Review of specific problems or situations and provides recommendations for solving Could occur under current situation
50 Mix and Match Components Local operation of systems would continue Incentives for multi-jurisdictional collaboration Governance of each model could be established in any number of ways Technical assistance on a regional level Education efforts on water/sewage issues Data collection and analysis of water and water systems Advocacy on behalf of the region to state and federal government
51 Evaluation Criteria Ranked in order of importance Efficiency/cost Environmental protection/sustainability Accountability Leadership Security Equity Regional Competitiveness (Political Feasibility)
52 Phase II Goal Production of a highly specific proposal for water planning/management in southwestern Pennsylvania with an implementation strategy. Task Force will remain focused on seeking institutional solutions that will improve planning and management in the region
53 Task Force Timeline and Plans
54 Questions/comments Ty Gourley, Project Manager (W) (C) Sign up for our distribution list Additional public meetings/individual presentations available


55 SW PA is the Most Reliable Watershed in the U.S. Drought Area Drought Watch Area Drought Status in April, 2002


56 Water is Vital to our Quality of Life