Wood Products Climate Change & Carbon Benefits
|
|
|
- Amice Lily Andrews
- 5 years ago
- Views:
Transcription


1 Wood Products Climate Change & Carbon Benefits (USEPA) Adam Robertson, M.A.Sc., P.Eng. Canadian Wood Council Ontario Wood Solutions Fair November 2, 2017
2 Presentation Outline Motivations & navigating the landscape Global; National; Provincial; Municipal Three S s of carbon (sink, storage, & substitution) Embodied & operational emissions Design tools for environmental evaluation Environmental product declarations (EPD) Additional information & resources
3 No challenge poses a greater threat to future generations than climate change (Barack Obama)

4 UN Sustainable Development Goals

5 Paris Agreement COP 21 Plenary meeting space, Paris
6 Climate Change Mitigation Mitigating options by the forest sector include extending carbon retention in HWP, product substitution, and producing biomass for bioenergy. (IPCC, 2007) In the long term, a sustainable forest management strategy aimed at maintaining or increasing forest carbon stocks, while producing an annual sustained yield of timber fibre or energy from the forest, will generate the largest sustained [climate change] mitigation benefit. (IPCC, 2007) Increasing the global forest land base and increasing the capacity of each forest, while using them as a sustainable supply of wood for building materials and fuel to offset the need for other energy intensive materials and fossil fuels represents an important carbon mitigation option over the long term. (UNFAO, 2010)
 all Provinces required by 2018 (www.pm.gc.")
7 Vancouver Declaration October 2015: Pan Canadian agreement by Provinces to reduce GHG emissions by 30% below 2005 levels by 2030 BC, AB, ON, QC, MB have carbon pricing mechanisms in place (carbon tax or cap andtrade system) all Provinces required by 2018 (

8 Federal Sustainable Development Strategy Reduce GHG emissions by 40% from 2005 levels by 2030

9 Pan Canadian Framework on Clean Growth and Climate Change
10 Pan Canadian Framework on Clean Growth and Climate Change Make new & existing buildings more efficient by: Requirements for labeling of building energy use by national model code for retrofit of existing homes and buildings net zero energy ready model building code adopted by provinces in 2030

11 Pan Canadian Framework on Clean Growth and Climate Change Make new & existing buildings more efficient by: GoC $2 billion Low Carbon Economy Fund: help interested provinces and territories expand their efforts to improve building energy performance support Indigenous communities and governments as they improve the energy efficiency of their buildings

12 Pan Canadian Framework on Clean Growth and Climate Change Increase carbon removals & carbon sinks by: Enhancing carbon storage in forests Support increased use of wood for construction Generating fuel from bioenergy and bioproducts Advancing innovation in bio based product development and forest management practices

13 FPAC 30 by 30 Challenge Canadian forest industry is pledging to remove 30 MT of CO 2 a year by 2030 Equivalent to 13% of Canada s national commitments under Paris Agreement

14 FPAC 30 by 30 Challenge Product displacement bio based products in place of fossil fuel products & energy sources Forest management increased utilization, improved residue use, better growth & yield, land use planning Accounting of long lived bio based product carbon pools Higher efficiencies in manufacturing processes
15 Building Sector Contributions Construction and operation of buildings are responsible for (UNEP, 2009): 40% of global energy use 30% of anthropogenic GHG emissions worldwide Building sector is 3 rd largest GHG emitter in Canada (17% of emissions including plug loads) Energy/resource use outpacing population growth Decreasing environmental impacts of buildings offers high environmental returns for low 15 economic investment

16
17 City of Toronto Transform TO Based on 1990 GHG emission levels: Short term: reduce GHGs by 30% by 2020 Long term: reduce GHGs by 80% by 2050 Buildings produce half of TO s GHG emissions
18 City of Toronto Transform TO Goals: 100% of new buildings are built to be near zero GHG emissions by 2030 (city owned by 2026) 100% of existing buildings retrofitted to achieve 40% energy performance improvement by % of energy comes from renewable or lowcarbon sources by % of waste diverted from landfills by 2050
19 City of Toronto Transform TO Support energy efficiency in buildings through technical and financial assistance (Better Buildings Partnership) Toronto Green Standard v3.0 (May 1, 2018) Recognized need to develop workforce that can implement high performance buildings

 Building labeling related to performance targets (operational")
20 City of Toronto Transform TO Zero emissions building framework: Support the use of passive design strategies to improve building resilience Higher quality building envelopes over improvements in equipment efficiency Low carbon energy sources (on site & grid sourced) Building labeling related to performance targets (operational and embodied?)

21 City of Vancouver July 5, 2016 Policy Report Development And Building Passed July 12, 2016 THAT COUNCIL: Direct staff to build all new City-owned and Vancouver Affordable Housing Agency (VAHA) projects to be Certified to the Passive House standard or alternate zero emission building standard. (Applicable for all City-owned and VAHA building projects by 2018.) Incorporate requirements for calculating and reporting embodied emissions in the restructured Rezoning Policy for Green Buildings

22 Netherlands Whole Building LCA U. K. BREEAM LCA Germany BNB Whole Building LCA Belgium Embodied Impacts France EPD Zurich 2000-watt Society and Minergie (Eco Version) Decarbonization increasing polices affecting both performance and embodied impacts.
 + O 2 Wood is 50%")

")
23 Wood A Natural Building Material Mitigation: CO 2 + H 2 O + Sunlight Sugars Cellulose (Wood) + O 2 Wood is 50% carbon by dry weight (a natural carbon storage device) Adaptation: Hygroscopic (stores or releases moisture to external environment, i.e. shrinks & swells) High thermal resistance properties (resulting from trapped still air) (Wood Handbook)
24 CARBON CONSIDERATIONS SINK STORAGE SUBSTITUTE TIME OPERATIONS

 (Tackle Climate")
25 Three S s of Carbon Forests as Sinks Carbon flows Forest cover has remained constant for last 100 yrs. Sustainable management is paramount (Federal Actions for a Clean Growth Economy, 2016) (Tackle Climate Change, Use Wood)
")
26 (NRCan, 2016)
27 Canadian Certification in the Global Context 2015 Year end Net Total for Canada (Double counting of areas certified to more than one standard has been removed). Millions of hectares certified Sources: as of Dec 31/15 as of Jan. 5/16 as of Dec 31/15 Forest Products Association of Canada Association des produits forestiers du Canada 6
 Change in Global Forest Cover 2000-2005 FAO")
28 Importance of Forests as Carbon Sinks Deforestation account for 20% of GHGs (IPCC, 2007) Change in Global Forest Cover FAO 2006

29

30 Carbon Fluxes in Sustainably Managed Forests

 1 m 3 of S P F stores 1 tonne of CO 2 eq.")
31 Three S s of Carbon Storage Wood products & building systems have ability to store large amounts of carbon (CO 2 eq.) 1 m 3 of S P F stores 1 tonne of CO 2 eq. Amount of carbon stored wood density (Johal) (APA)
32 Tracking Carbon Pools
33 Three S s of Carbon Substitution Wood products can substitute for other more carbon intensive building materials Embodied emissions are avoided by using wood Displacement factors (kg CO 2 avoided/kg wood used) can be estimated to calculate carbon avoided

34 Net Carbon Emissions in Producing 1,2 a kg of: 1/ Values are based on life cycle assessment and include gathering and processing of raw materials, primary and secondary processing, and transportation. 2/ Source: USEPA (2006) and Bowyer (2015)
35 Net Production Emissions


36 Whole Building Evaluation
37 Forest, Product and Substitution Pools Forest, Product, Emissions, Displacement & Substitution Carbon by Component Stem Root Crown Litter Dead Chips Lumber HarvEmis ManufEmis Displacement Substitution with Substitution with Products Forest Metric Tons Per Hectare Year

38 End of life Alternatives Energy recovery Recycle Reuse Landfill (CEI Bois/EPF)
 2.")

39 Cumulative benefit of avoided 1 kg CO 2 emission 3.5E 13 3E 13 Avoided radiative forcing (W.yr.m 2 ) 2.5E 13 2E E 13 1E 13 5E Years Net present value of 1 tonne CO 2 in 80 years.24 tonne
40 Whole Life Cycle Emissions 80 Year Building Life Operational Embodied
41 Operational Emissions Year 0 Embodied Emissions
42 Operational Emissions Year 12 Operational = Embodied Embodied Emissions
43 Operational Emissions Year 80 Embodied Emissions BUT

 energy?")
44 What if. The building is poorly maintained and becomes decrepit before 80 years? The building is operated more efficiently? The land becomes more valuable for another use and the building is removed? The building uses renewable (zero emission) energy? The building is rendered unusable (fire, storm, flood ) A carbon tipping point is reached before the modeled savings are reached? Or.???


45 Rising Importance of Embodied Material Impacts (PE International)


46 Rising Importance of Embodied Material Impacts (Architect: Richard Rogers) (CPA, 2012)


47 Green design choices are complex


48 Whole Building Evaluation Tools Building Code NBC plans to develop a stretch code/code plus IgCC, ASHRAE & CalGreen have codified green building practices in U.S. Green Building Rating Systems & Challenges LEED, Green Globes, Living Building, Architecture 2030

49 Online Carbon Calculator For Wood Buildings Updated Resources Electronic Tools

50 Online Carbon Calculator

51 Online Carbon Calculator (ESSB, Vancouver Perkins + Will)

52 Online Carbon Calculator


53 Online Carbon Calculator

")

54 UBC Brock Commons (18 storeys) NRCan, 2016
55 Example Study of GHG emissions of a functionally equivalent floor structure: 6m x 6m bay size in office building. Steel deck and concrete solution Wood solution 55

56 Steel Concrete Solution Steel girders and steel deck with concrete slab Concrete Steel deck Steel girders Steel reinforcement Quantity of materials 3 m tonnes 0.2 tonnes 0.03 tonnes CIRAIG Data Potential GHG emissions 540 kg CO kg CO kg CO 2 27 kg CO 2 Results 1633 kg CO 2 éq. 56

57 Wood Solution Wood floor trusses with OSB Truss plates Nails OSB Softwood lumber Quantity of materials 0.05 tonnes 0.04 tonnes 75 m m 3 CIRAIG Data Potential GHG emissions 63 kg CO 2 37 kg CO 2 75 kg CO 2 32 kg CO 2 Results 276 kg CO 2 éq. 57
58 BEES Select Alternatives Based on functional unit


59 BEES Reporting Results
60 Publicly available at: resources/software/bees


61 Athena Impact Estimator


62 ATHENA Impact Estimator Custom Wall


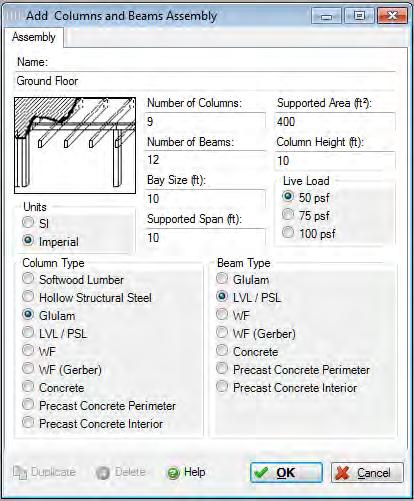
63 ATHENA Impact Estimator


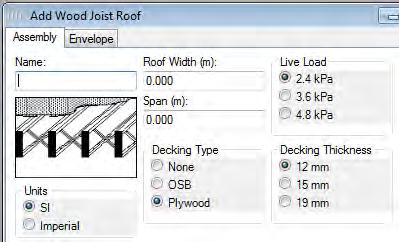

64 Athena Impact Estimator Floors & Roof


65 Impact Estimator Design Comparison


66 Available for free:

67 Environmental Product Declarations (EPD) Nutrition labels conveying LCA derived environmental impact data about products Transparently discloses standardized data about potential environmental impacts Simple & user friendly mechanism to bring LCA data into the marketplace


68 EPD for Softwood Lumber Data averaged for North America NRCan, 2016
69 EPDs for North American Wood Products Industry wide EPDs for wood products (available at 1. Softwood lumber 2. Plywood 3. OSB 4. Glulam 5. LVL 6. I Joists 7. LSL 8. MDF 9. Particleboard 10. Preservative treated lumber (ACQ & Borate) 11. Redwood decking Data weighted by production volume
70 Resource Materials CWC Sustainability Fact Sheets: Carbon Life Cycle Assessment Resilient & Adaptive Design Social & Economic Benefits (cwc.ca/publications/technical/fact sheets) rethinkwood.com naturallywood.com Free online tools: Carbon Calculator BEES Athena Impact Estimator


71 NRCan CFS Resources

72

73 What Lies Ahead


74 Questions & Comments?? Adam Robertson, M.A.Sc., P.Eng. Manager, Codes and Standards Structural Engineering and Sustainability Canadian Wood Council