City of Novato 2014 GREENHOUSE GAS EMISSIONS INVENTORY
|
|
|
- Paul Jacobs
- 5 years ago
- Views:
Transcription
1 City of Novato 2014 GREENHOUSE GAS EMISSIONS INVENTORY

2 Marin Climate & Energy Partnership Partnership of all Marin jurisdictions, MCE, TAM and MMWD Working together since 2007 Develop greenhouse gas inventories, climate action plans, model ordinances and policies Implement mutual climate action programs like Resilient Neighborhoods
3
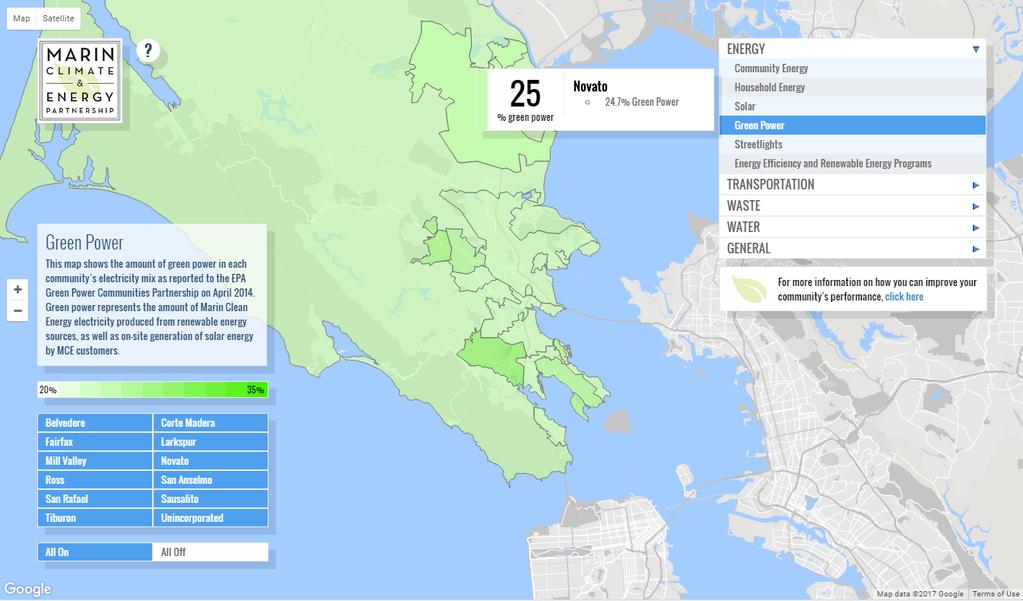
4 Marin Sustainability Tracker
5 State of the Climate 2016

6 Carbon Dioxide Levels Are Rising 400+ ppm For millennia, atmospheric carbon dioxide had never been above this liner Source: NASA
7 Global Surface Temperatures Are Rising 2016 Source: NASA


8 Consequences of Climate Change Melting ice sheets in Greenland and Antarctica Sea levels have already risen 8 Projected to rise 3 feet by and maybe more
9

10 Consequences of Climate Change Warming oceans Coral reef bleaching Ocean acidification

11 Consequences of Climate Change Changing and migrating flora and fauna


12 Consequences of Climate Change More wildfires Heat waves, droughts, desertification and climate refugees More intense storms

13 Where We re Headed On a path to increase temperatures 4 o C by 2100 Need to limit warming to 2 o C to avoid catastrophic impacts of climate change We re already halfway there!
14 Good News The Paris Agreement was ratified and went into force on November 4. International Civil Aviation Organization plan to offset airplane emissions. Cost of wind and solar keep falling -- and utility scale plants can be cheaper to build than new coal and natural gas power plants even without government subsidies. Governor Brown: California will launch its own damn satellite.
 levels by 2020 SB 32 (2016) 40% below 1990 by 2030 Executive Order S-3-05 80% below 1990 by")
15 Greenhouse Gas Reduction Goals AB 32 (2006) 1990 levels by 2020 AB 32 Scoping Plan 15% below current (2008) levels by 2020 SB 32 (2016) 40% below 1990 by 2030 Executive Order S % below 1990 by 2050
16 Novato Addresses GHG Emissions Greenhouse gas inventories since 2005 Climate Action Plan adopted in 2009 and is being incorporated into General Plan 2035 Goal to reduce emissions 15% below 2005 baseline emissions by 2020 and 40% by 2035
17 Sector Share of Emissions 2014 Off-Road 1% Commercial 20% Residential 24% Water & Wastewater <1% Waste 3% Transportation 48%
18 Annual Inventories Annual inventories for years Updated historical energy use data Updated historical transportation emission factors
19 MTCO2e Trend in Community Emissions 350, , ,000 Baseline -11% 200, , ,000 50,
20 Sector Reductions Change from 2005 % Change from 2005 Residential Energy -20,297-24% Commercial Energy -5,179-9% Transportation -1,358-1% Waste -3,642-32% Water % Wastewater % Off-Road % TOTAL -30,870-11%
21 Sector Share of Reductions Off-Road 2% Water 1% Commercial 16% Waste 12% Transportation 4% Residential 65%
22 kwhs (Thousands) Electricity Use Electricity use declined 2% between 2013 and 2014 and less than 1% since Residential electricity use accounts for about 44% of electricity use. Residential electricity use declined 5% but commercial electricity use went up 3%. 180, , , , ,000 80,000 60,000 40,000 20, Commercial Residential
23 Solar is Making Gains 175 solar energy systems installed in the Novato area (including unincorporated areas) in ,200 1, Solar PV Systems Installed in Novato Area 1,148 systems as of September % are residential Annual Installed Solar Capacity Previous Years' Installed Solar Capacity
24 MTCO2e Electricity Emissions Electricity emissions declined 5% between 2013 and 2014 and 25% since Mostly due to lower carbon intensity. PG&E electricity 11% less carbon intensive over MCE electricity 23% less carbon intensive than PG&E in MCE carries 61% of the load. About 0.4% of MCE customers are Deep Green. 70,000 60,000 50,000 40,000 30,000 20,000 10,000 0
25 Natural Gas Use (therms) Heating Degree Days Natural Gas Use Natural gas use and emissions declined 12% since Natural gas use is Natural Gas Use, highly correlated 18,000,000 16,000,000 with outdoor 14,000,000 12,000,000 temperatures. 10,000,000 8,000,000 6,000,000 4,000,000 2,000, ,000 5,000 4,000 3,000 2,000 1,000 0 Natural Gas Use Heating Degree Days Source (heating degree days): U.S. Department of Commerce, National Climatic Data Center
26 Transportation Vehicle Miles Travelled has increased 2% since 2005, but transportation emissions have declined 1%. Due to improved vehicle fuel efficiency (and low-carbon fuels). 300,000,000 Vehicle Miles Travelled 250,000, ,000, ,000, ,000,000 50,000, Source: Caltrans Highway Performance Monitoring System Public Roads Data
27 Waste Disposal Landfilled waste has declined 27% since Waste disposal has maintained declines despite improved economy. 70,000 60,000 50,000 40,000 Landfilled Waste 9.0% 8.0% 7.0% 6.0% 5.0% 30,000 20,000 10, % 3.0% 2.0% 1.0% % Waste (tons) Marin County Unemployment Rate Source (unemployment rates): California Employment Development Department
28 Community Emissions Recap 350, , , Baseline 2020 Target 200, , ,000 50,
29 Compared to Future Targets 350, , , Goal 200, , Local Goal 2030 State Goal 100,000 50, State Goal
30 Questions?
31 Implementation of Novato CAP Conversion of 4,500+ street lights to LEDs Solar panels at 5 City facilities New Administrative Offices building built to LEED Silver stds. Cal Green Building code with Tier 1 for new construction and 15% more energy efficient Approval of 5 PACE loan providers for energy/water efficiency upgrades
32 Climate Action Coordinator Coordinating City facility & fleet efficiency measures Staffing internal Green Team to promote resource reduction in city operations Promoting: waste reduction, energy efficiency, Resilient Neighborhoods program Coordinating Transportation Demand Management programs at major employers Coordinating City response to Sea Level Rise Vulnerability report Seeking grants Monitoring and updating CAP and GHG inventory
33 Climate Action Coordinator Salary + benefits: $100,000 annually Operating/marketing expenses: $20,000 annually