Western Regional Boiler Association
|
|
|
- Erik Gibbs
- 5 years ago
- Views:
Transcription
1 Western Regional Boiler Association MACT Solution Synergies: How Improving Combustion Can Reduce MACT APC Footprint, Investment and Operating Cost Edmundo R. Vasquez Dennis Shanahan March
2 Content Background Stacked Air System (SAS) Combustion Emission Solutions SAS Impact on ESP design SAS Impact on ACI/DSI Design Conclusions 2
3 BACKGROUND

4 Project Goal: Begin with the End in Mind CBPG Solutions for Industrial Boiler MACT
5 Boiler MACT Facts: Emission Limits, Existing Units, Solid Fuels Source: Federal Register, Vol. 78, No. 21, Dated January 31, 2013; Part V, EPA 40 CFR Part 63 Data provided is for information purposes only. The rule shall be the governing authority. Subcategory PM (Input) [lb/mmbtu] PM (Output) [lb/mmbtu] TSM (Input) [lb/mmbtu] TSM (Output) [lb/mmbtu] HCl (Input) [lb/mmbtu] HCl (Output) [lb/mmbtu] Hg (Input) [lb/mmbtu] Hg (Output) [lb/mmbtu] CO (Input) 3 Run Avg. [ppm@3%o2, dry] CO CEMS (Input) 30 Day Avg. (a) [ppm@3%o2, dry] Coal Stoker E E E E CO (Output) 3 Run Avg. [lb/mmbtu] Pulverized Coal E E E E Coal Fluid Bed E E E E Coal Fluid Bed w/fb Heat X Biomass Wet Stoker/ Sloped Grate/ Other Biomass Kiln- Dried Stoker/ Sloped Grate/ Other Biomass Fluid Bed Biomass Suspension Burner Biomass Dutch Oven/ Pile Burner Biomass Fuel Cell E E E E E E E E-06 1, E E E E ND E E E E E E E E-06 2,400 2,000 (b) E E E E (b) E E E E-06 1,100 ND 2.40 Biomass Hybrid Susp Grate E E E E-06 2, (Input) = Heat input basis (Output) = Steam output basis (a) = 30 day rolling average, except as noted (b) = 10 day rolling average 5

6 Biomass Combustion Ash formation Source: Van Loo, The Handbook of Biomass Combustion & Co-firing 6
7 Combustion Products: Gases and Gas Pollutants Combustion products of standard fossil fuels and biomass in commercial and industrial boilers produce the following main gases: carbon dioxide (CO 2 ) nitrogen (N 2 ) oxygen (O 2 ) water (H 2 O) carbon monoxide (CO) nitrogen oxides (NO and NO 2 called NOx, N 2 O) sulfur oxides (SOx: SO 2, SO 3 ) volatile organic compounds (VOC) and hydrocarbons (HC) CO, NOx (NO+NO 2 ), N 2 O, SOx (SO 2, SO 3 ) and VOC s and HC s are considered pollutants The primary greenhouse gases in the Earth s atmosphere are water vapor, CO 2, methane, nitrous oxide and ozone. 7
8 In-Furnace Emission Control Techniques Reducing CO/NOx emission formation in-furnace requires the proper burner/boiler design and a delicate balance of operating conditions Grate/Burner: - Design for Low NOx Modifications - Optimize operation to control emissions Combustion Tempering: - Water/Steam Injection - Near burner zone water wall cleaning Flue Gas Recirculation Air staging: Overfire Air Fuel staging: Reburning Oxygen use: Oxy Fuel 8
9 STACKED AIR SYSTEM
10 Conventional Overfire Air System Flue gas The result is a central column with no lateral motion OFA Volatiles UGA With such an air system, neither the UGA or OFA is effectively utilized, necessitating more excess air OFA pushes air & volatiles to the centre, but does not mix them well Volatiles and UGA parallel flow, little mixing as they rise 10
11 CBAM Stacked Air System The OFA makes use of the UGA to burn the volatiles, allowing reduced excess air Flue gas SAS OFA Resulting in two upwardly spiraling vortices, utilizing entire furnace area SAS entrains and circulates rising air and volatiles Volatiles UGA Volatiles and UGA parallel flow, little mixing 11

12 Case Study Interlaced vs SAS Air goes straight up central chimney Rapidly carried up and out of the combustion zone Air swirls around, utilizing all of furnace volume Longer residence time in the furnace 12

13 SAS Reduces Excess O2 5.3% O 2 2.5% O 2 O2 is lower at each level, also more uniform 13
14 CO Reduction 420 ppm CO reduced by half despite O 2 reduction 180 ppm 14

15 Reduction in Boiler Exit Gas Temperature Hot central core, trapped in the center Exit Plane Temperature is reduced 55 F Top is cooler. Hot central core is eliminated Bottom is hotter 15
16 Combustion Modifications Impact on APC Technologies Reducing unburned gases CO and unburned solids (LOI) Reducing Particulate matter carryover Reducing combustion air, flue gas flow and excess O 2 Reducing NOx Reducing FEGT (Furnace Exit Gas Temperature) by helping transfer heat to the waterwall) Increasing boiler efficiency and improving fuel utilization Improving Inlet Conditions to APC Control Equipment FEGT and Profiles Flue Gas Flow Flue Gas velocity and Profiles Flue Gas NOx and Profiles Total Comb. Air UBC CO Fuel Use Impacts 16

17 Clyde Bergemann Stacked Air System Schematic 17


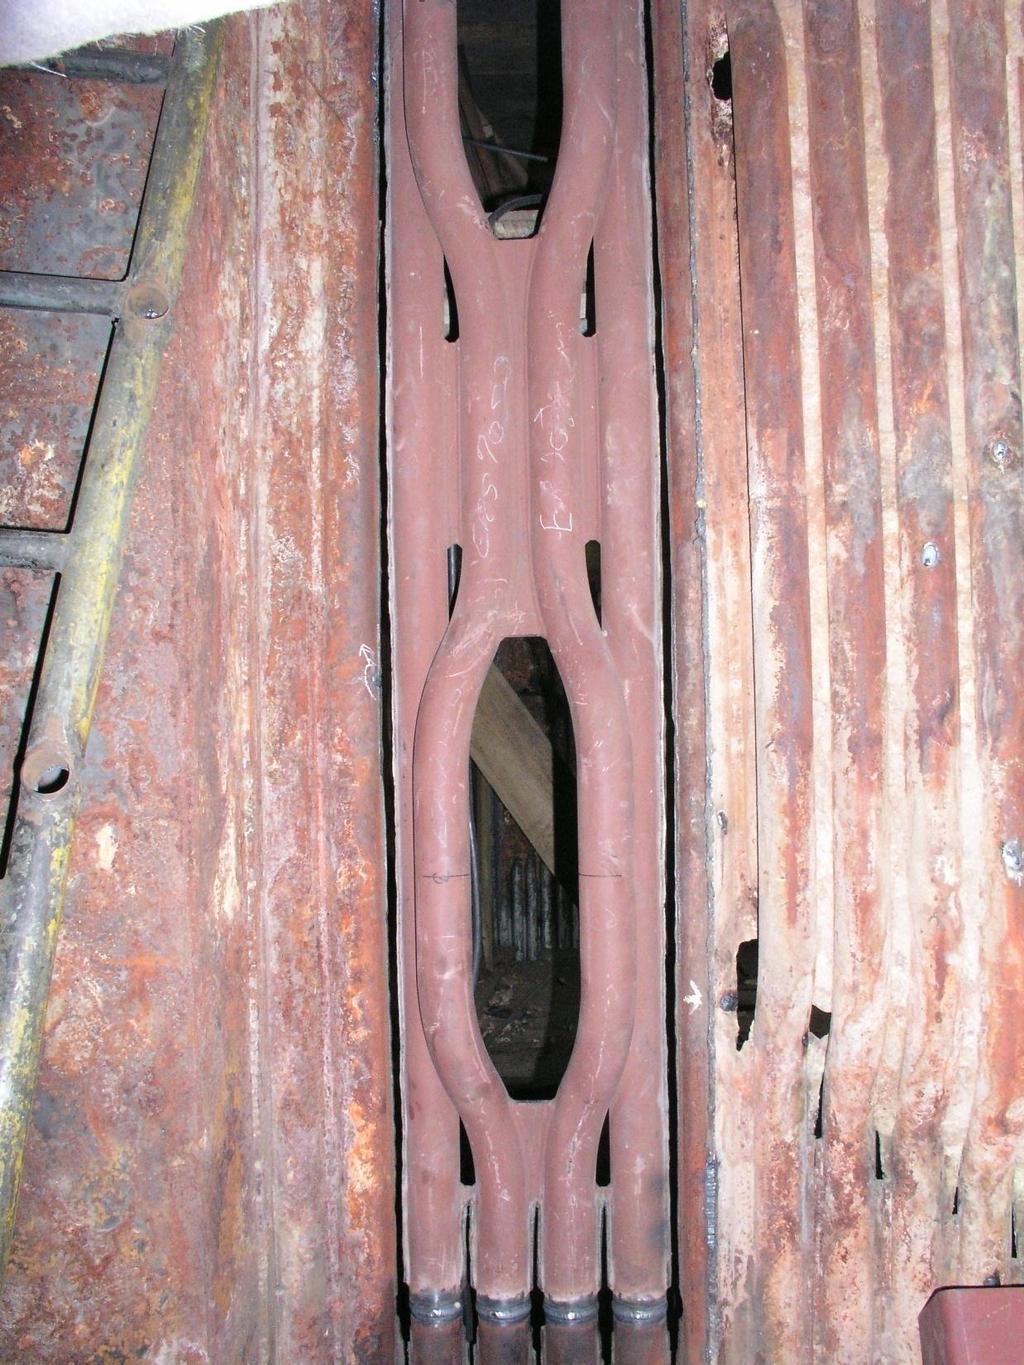
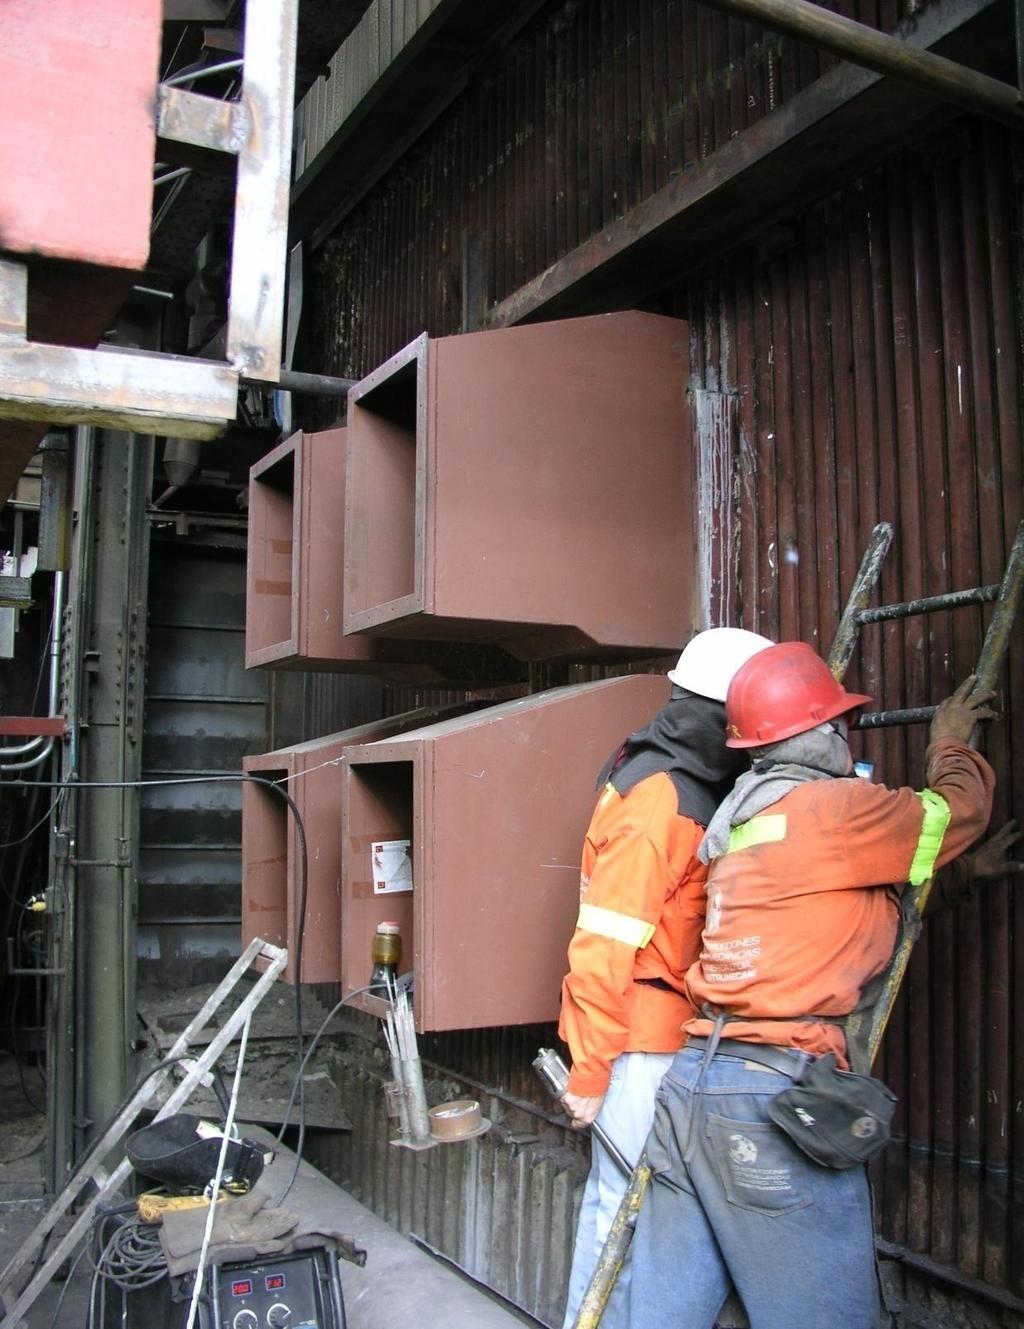
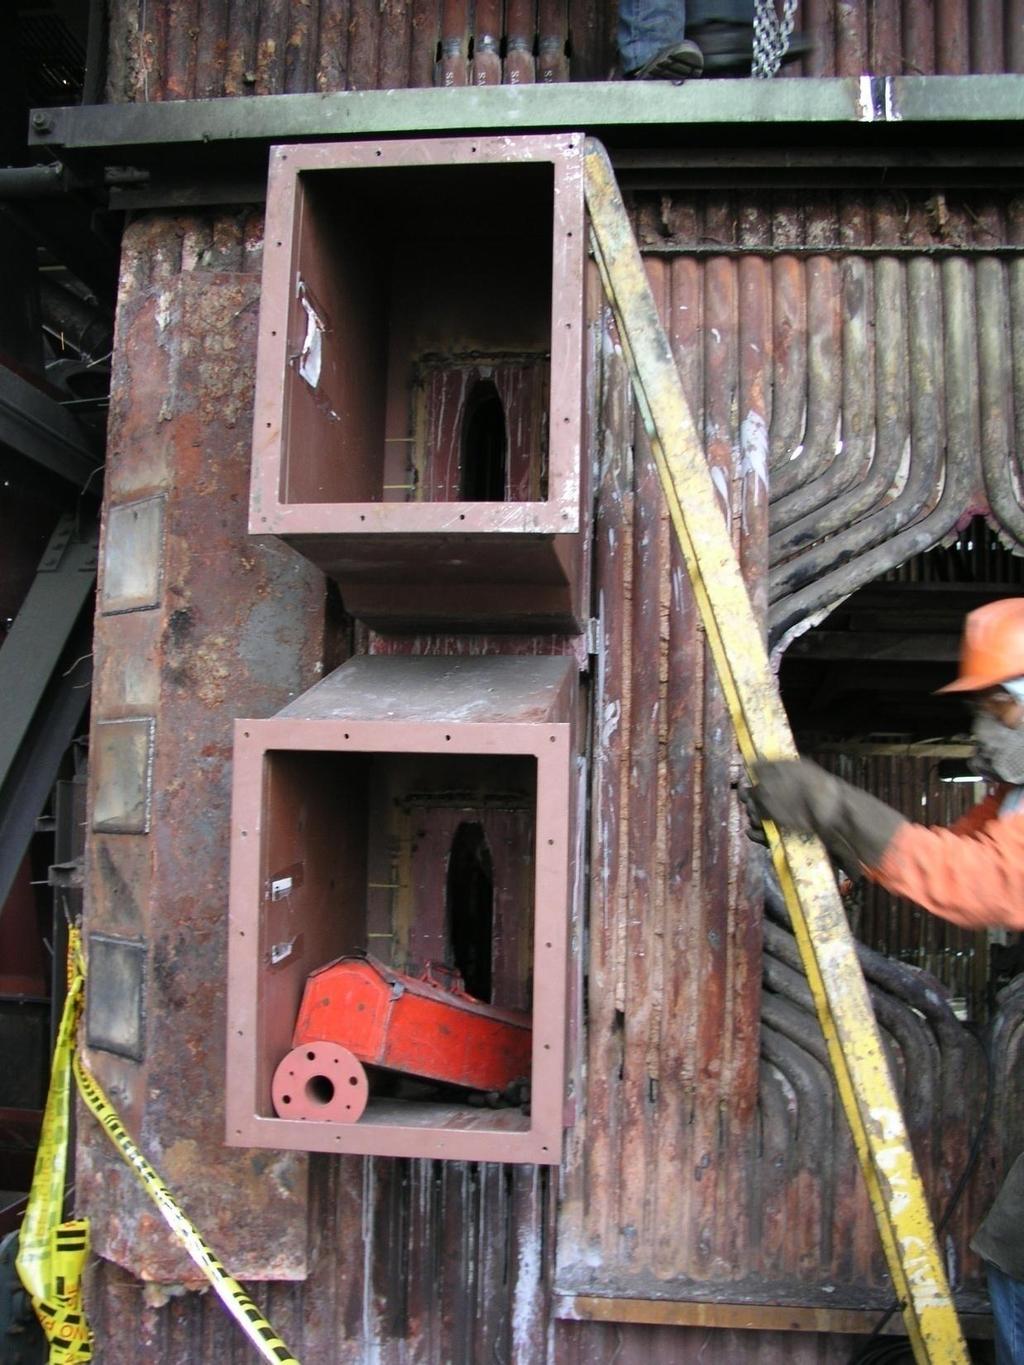
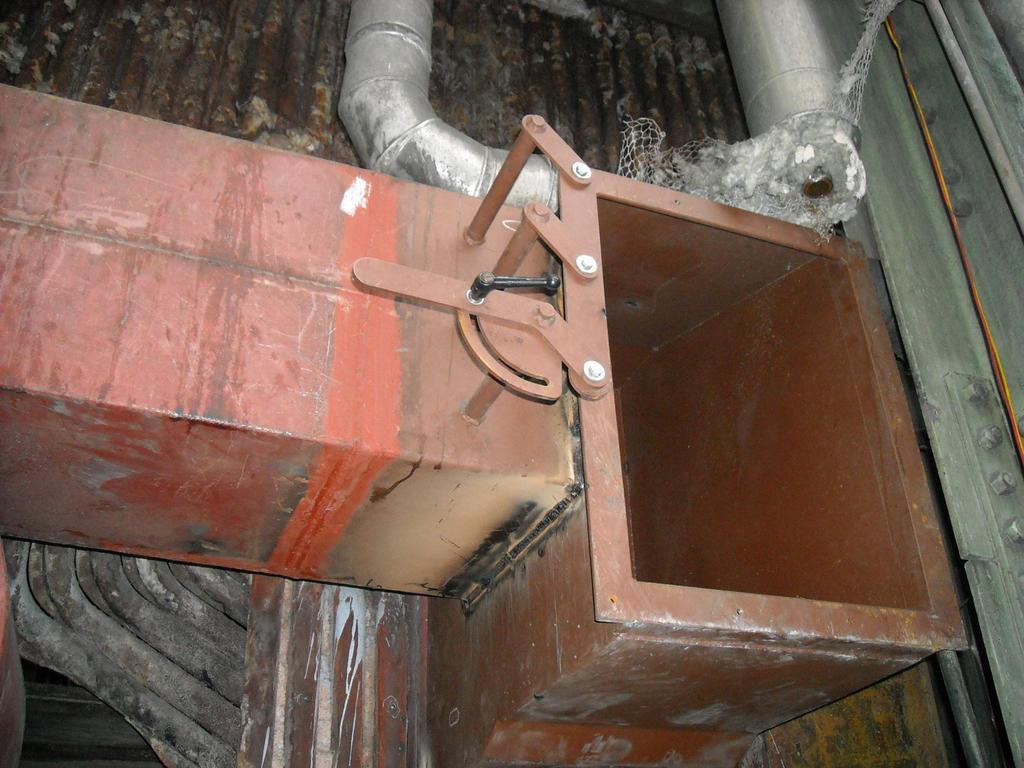
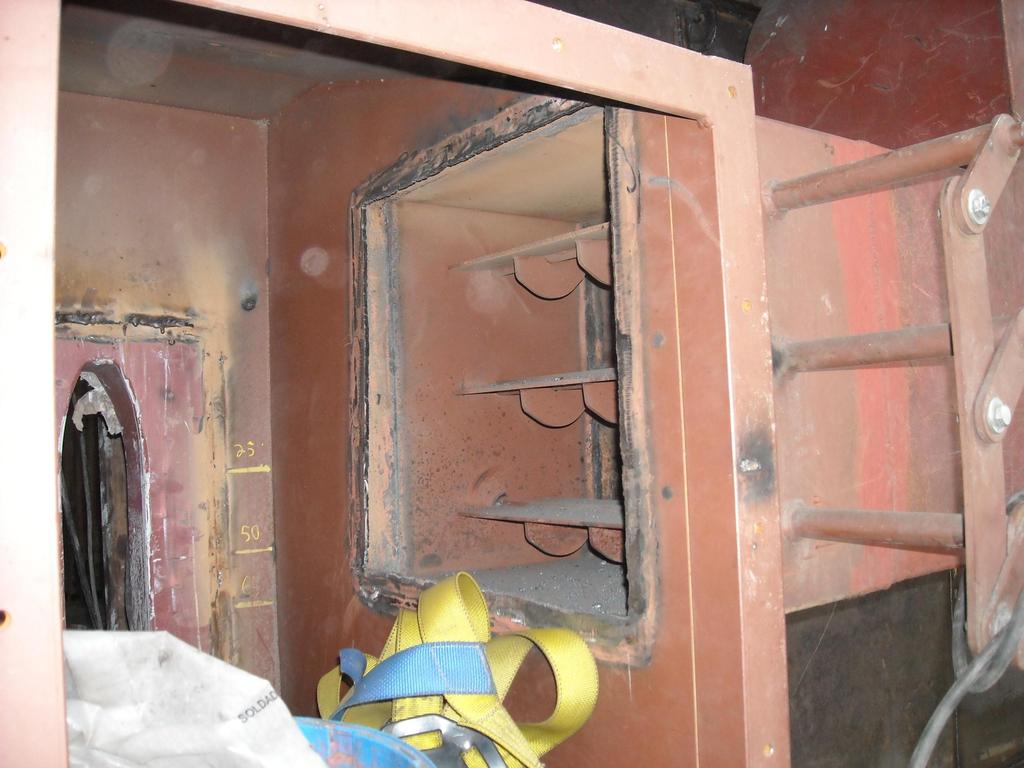
18 SAS Modifications Waterwall ports Port enclosures Mass flow dampers Complete inboard ports with positioners Complete outboard ports with positioners 18


19 Clyde Bergemann Wind box Nozzle, Positioner and Components The most important feature of this design is that it provides the ability to independently control jet mass flow and jet velocity 19

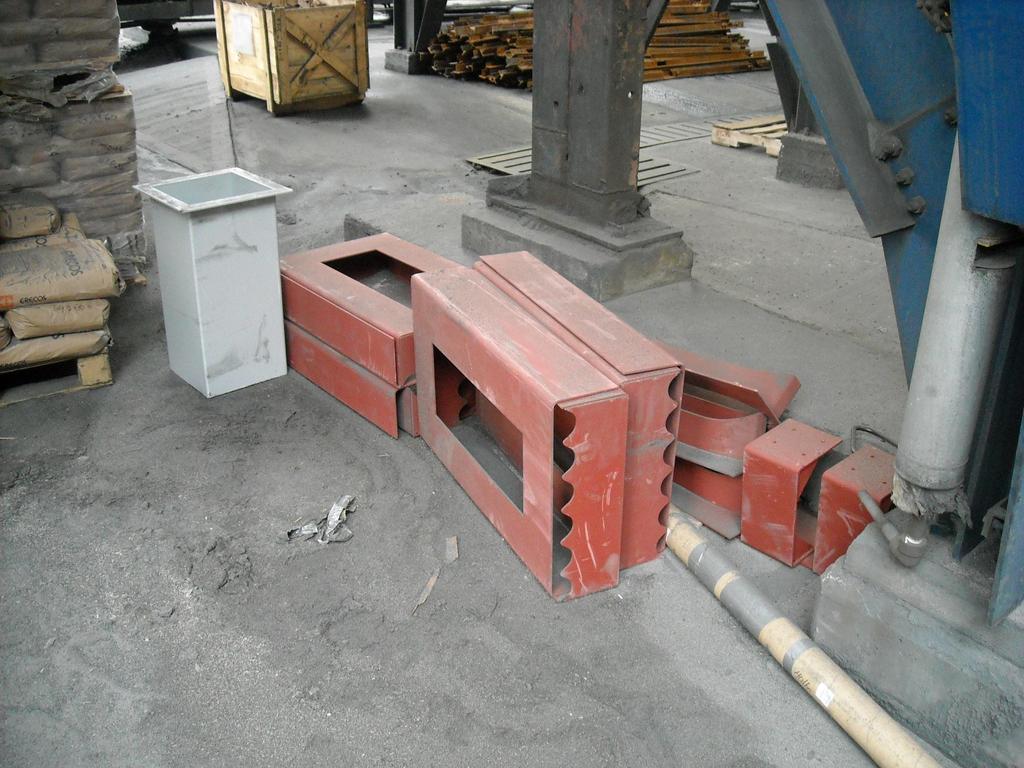
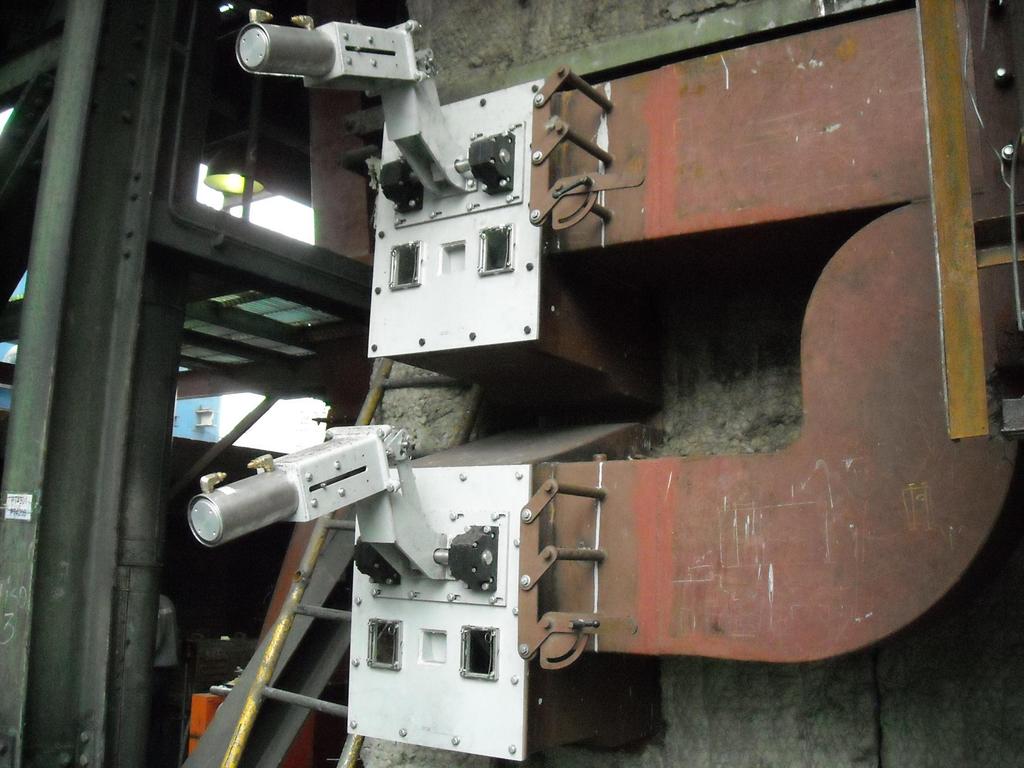
20 Outboard Port Assembly 20

21 Air Duct 22
22 24
23 25
24 26
25 27
26 28
27 29
28 30
29 31
30 SAS Impact on ESP Design 32
31 ESP Inlet Design Parameters Boiler type Fuel analysis Fly ash analysis Operating conditions Temperature, pressure Heat Rate Flue gas volume & constituents Particulates Inlet particulate loading Outlet emission requirements 33
32 Boiler/Fuel Type Impact on ESP Fuel/Fly ash Analysis PC, Cyclone, CFB, and Stoker all have different particle sizes Mechanical collector will impact particle size of particulate Fuel analysis provides indication of particle size and flue gas environment (amount of SO 3 and moisture present) Fly ash Resistivity is the fundamental basis of ESP sizing Ash analysis provides an indication of the resistivity of fly ash Na 2 O, Fe 2 O 3 are beneficial to good resistivity CaO, MgO counter effects of SO 3 - not beneficial Al 2 O 3, SiO 2 are insulators - create excessive resistivity Resistivity is temperature related. Higher temps (on a cold-side ESP) usually lead to higher resistivity 34
33 ESP Operating Conditions and Flue Gas Operating Conditions Resistivity is temperature related - Higher temps (on a cold-side ESP) usually lead to higher resistivity Temperature and pressure are used to correct from actual to standard conditions Flue Gas Volume Used to size ESP in terms of gas velocity and time of treatment - Typical gas velocity for most applications is between fps - Typical treatment times are seconds Lower gas velocity and higher time of treatment are more conservative, yet may be necessary for very low emission levels 35
34 Flue Gas and Particulates Design Inputs Gas constituents Moisture is a conditioning agent - Increased moisture improves (lowers) resistivity slightly SO 3 is a conditioning agent, related to amount of sulfur in fuel - Increased SO 3 improves (lowers) resistivity Inlet particulate loading Related to Efficiency calculation Impacts size of ESP Affects discharge electrode selection & sizing Also affects size & type of power supply (transformer rectifier, or T/R) 36
35 ESP Outlet Requirements Outlet emission requirements Related to efficiency calculation Impacts size of ESP - Desired efficiency - Desired gas velocity & time of treatment Low outlet emission requirements may necessitate - Slowing down gas velocity - Extending time of treatment (TOT) Some requirements may be too low to commercially guarantee 37

36 Technology CBPG Rigitrodes Over 170 new installations with Rigid Electrodes Developed By CBPG 81 New Recovery installations Numerous retro-fits More Rigid Electrode Experience than ALL others combined! Stable High Voltage Frame System Bolted Top & Bottom Frame to form Rigid matrix design Solid Large Diameter Pipe (one-piece) Design Bolted / Closed ends prevent build-up NO Weights required Multiple Pin Designs tailored to Application Power Boiler Design Salt cake Design 38

37 CBPG Collecting Plates and Rigitrodes. 39

38 Rigitrode Electrodes Does not exhibit the corona suppression associated with some rigid electrodes. Various pin configurations provide corona densities less than and greater than other designs The most energy efficient rigid electrode available 40

39 Rigitrodes. 41

40 Direct Collecting Plate Rapper System. 42

41 Collecting Plate Rapping Provide energy directly into plate No disturbance to dust build-up on adjacent plates Rapping forces not dampened by mass of other plates/casing 43
42 RD 3000 Automatic Voltage Controls The latest innovation in improving an existing precipitator performance without mechanical modifications The best bang for the $ Simple installation on existing esp sometimes while online with a field out of service (reduced production rate) Existing TR may be used 44

43 Controls T/R Metering: Primary Voltage and Current Secondary Voltage and Current 45
44 APC Performance Case Study Plant A Steam flow: 300 KPPH, 600 psig,750 F PRB coal: ~26% moisture & 8911 Btu/hr Fuel Emissions: 0.21% Sulfur 0.03% (max.) Chlorine 0.10 ppm (max.) Mercury Design Operating Conditions: Excess O2 8.4% O2 ESP & DSI design 4% O2 SAS Fuel Flow(#/h) 48,869 46,542 Heat Input(MMBtu/hr) Comb.Air(ACFM@105F) 133,115 91,211 Flue Gas(ACFM@375F) 210, ,200 Boiler Efficiency (%) 80.0% 84.0% HCl Emissions (lb/mmbtu) HCl Emissions (lb/hr) SO 2 Emissions (lb/mmbtu) SO 2 Emissions (lb/hr) Hg Emissions (lb/tbtu)
45 Flow Rate (ACFM) % Total Air Flue Gas and Combustion Air Flow Rate vs. % Excess O2 % Total Air vs % Excess O2 250, ,000 Comb Air Flue Gas 250.0% 200.0% 150.0% 150, ,000 50, % 50.0% 0.0% 4% 6% 8% 10% % Excess O % 5.0% 6.0% 7.0% 8.0% 9.0% % Excess O2 29% reduction on flue gas, 32% reduction on combustion air Heat input reduce 20.8 MMBtu/hr 47
46 ID and FD Auxiliary Power Savings The ID and FD power savings are based on electricity rate $0.06/KWh Fan Savings 8.4% to 4% O2 ID (360 F) FD (105F) Flow Rate (ACFM) 61,092 41,904 Pressure Drop (in) Fan Efficiency 70% 70% Motor HP $/y $ 50,205 $ 34,436 Total $/y $ 84,641 48
47 ESP SAS Economic Analysis 8.4% to 4% O2 Fuel Savings (MMBtu/h) (85% capacity) equivalent 17.7 Steam Increase (kpph) (85% capacity) equivalent 12.7 Fuel Saved per year(mmbtu/y) (85% capacity) 148,512 Savings ($/y): PRB Coal ($2/MMBtu) $297,024 Aux Power $84,641 Other (Maintenance, Operations, etc.) $80,000 Annual Savings Estimate +$460,000 ESP Size Price differential $5.47M to $4.65M +820,000 SAS Cost -$1,200,000 ROI (years)
48 Conclusions for ESP Impact For this unit(~300 kpph), current operating is 8.4% excess O2, with SAS can operate at 4% excess O2 with this type of coal (PRB ~26% moisture). Flue gas can be reduced from ~210,000 ACFM to 149,000 ACFM which is ~30% reduction due to a more efficient combustion obtained 4.0% with the installation of SAS. According to our boiler efficiency estimates, can be explained by a reduction of excess O2 level from 8.4% to 4% lower CO emissions due to combustion improvement by SAS (~2500 ppm to ~500 ppm) a reduction in total unburned fuel to 1.5% to 2.5% from much higher inefficient burnouts Return on investment is less than one year for the new SAS system with a reduced size ESP and 2.5 years with same size ESP. 50
49 SAS Impact on ACI/DSI Design 51
50 ACI SAS Performance Analysis Mercury Emissions Design: Excess O2 8.4% O2 ESP & DSI design 4% O2 SAS Flue 210, ,200 Hg Emissions (lb/tbtu) Hg Outlet (lb/tbtu) Reduction % 49% 49% PAC Consumption Rate (lb/mmacf) PAC Consumption Rate (lb/hr) PAC Consumption Rate (lb/yr) 446, ,360 PAC Cost $1.00/lb $446,760 $315,360 SAS Improvements: Boiler Efficiency Reduction of Comb. Air Reduction of Flue Gas volumetric flow rate SAS Savings: Reduction of Sorbent consumption rate Total Sorbent consumption savings per year Sorbent Savings from SAS ($/yr) N/A $131,400 Note: ACI equipment scope and capital cost remains unchanged 52
51 DSI SAS Performance Analysis Acid Gas Emissions Design: Excess O2 8.4% O2 ESP & DSI design 4% O2 SAS Heat Input(MMBtu/hr) HCl Emissions (lb/mmbtu) HCl Emissions (lb/hr) HCl Outlet (lb/mmbtu) Reduction % 52% 52% Trona Consumption Rate (lb/hr) Trona Consumption Rate (tons/yr) 1,406 1,336 Trona Cost $200/ton $281,200 $267,200 Sorbent Savings from SAS ($/yr) N/A $14,000 SAS Improvements: Boiler Efficiency Reduction of Heat Input Reduction of Acid Gas Emissions (Mass Flow Rate) SAS Savings: Reduction of Sorbent consumption rate Total Sorbent consumption savings per year Note: DSI equipment scope and capital cost remains unchanged 53
52 CONCLUSIONS 54
53 Conclusions for ESP, ACI and DSI Impact SAS Improvements: Boiler Efficiency Reduction of Heat Input ESP Reduction of Acid Gas Emissions (Mass Flow Rate) Reduced Foot print ACI Reduced Operating Costs Reduction of Sorbent consumption rate DSI Total Sorbent consumption savings per year Reduction of Sorbent consumption rate Total Sorbent consumption savings per year 55
54 56