Rainbow Creek TMDL Monitoring Program Report for October 2016 through September 2017
|
|
|
- Clinton Neal
- 5 years ago
- Views:
Transcription
1 Rainbow Creek TMDL Monitoring Program Report for October 2016 through September 2017 Introduction The Rainbow Creek monitoring program has been developed to provide water quality data in support of the Total Maximum Daily Loads (TMDLs) for Total Nitrogen and Total Phosphorus in the Rainbow Creek Watershed, San Diego County ( ). The objective of this monitoring program is to track progress on decreasing nutrient concentrations in the Rainbow Creek watershed. In the present report, the following questions were addressed: 1. How do the mean concentrations, instantaneous loading and instantaneous flux of total nitrogen and total phosphorus vary among the sampling sites along the main stem of Rainbow Creek? 2. How do the mean concentrations, instantaneous loading and instantaneous flux of total nitrogen and total phosphorus vary among the sampling sites in the tributaries to Rainbow Creek? 3. Are there any significant trends in total nitrogen and total phosphorus concentrations in the Rainbow Creek main stem and tributaries over time? Monitoring locations (Figure 1; Table 2a/2b) included those identified as strategic nodes by the San Diego Regional Water Quality Control Board (Regional Water Board) during the development of the TMDL technical report. This report satisfies the requirement of annual monitoring required by Attachment E.3 of the California Regional Water Quality Control Board, San Diego Region Order No. R as amended by Orders No. R and R , National Pollutant discharges Elimination System (NPDES) Permit and Waste Discharge Requirements for Discharges form the Municipal Separate Storm Sewer Systems (MS4s) Draining the Watersheds within the San Diego Region (Permit). Methods Data Collection Sampling was conducted at 13 monitoring locations in Rainbow Creek and its tributaries. Table 2a/2b and Figure 1 present sampling sites and monitoring frequencies. All samples were collected during dry weather (at least 72 hours following any rain event with precipitation greater than or equal to 0.10 inches). In-situ physical measurements of ph, specific conductance, turbidity, dissolved oxygen, temperature, and salinity were collected using the Horiba U-10 multimeter probe. On each sampling occasion, a hand-held flow meter or the floating object technique was used to measure current velocity that was then multiplied by the approximate channel width and depth to estimate instantaneous flow rate. Water quality samples were also collected and taken to the laboratory to test for nitrate as N, nitrite as N, total Kjeldahl nitrogen (TKN), ammonia, ortho-phosphate as P, total phosphate as P, total dissolved solids (TDS), total iron, and sulfate. Total nitrogen concentration was calculated for each sample by adding together the corresponding concentrations of TKN, nitrate as N and nitrite as N. Table 1 provides a summary of all parameters measured and the corresponding methods.
2 Table 1: Water Quality Parameters and Methods for Rainbow Creek Monitoring Measured Parameter Field or Lab Method Reporting Limits Flow Field Flow Probe FP101/FP cfs ph Field In-situ, Horiba U-10/U units Temperature Field In-situ, Horiba U-10/U C Conductivity Field In-situ, Horiba U-10/U ms/cm Dissolved Oxygen Field In-situ, Horiba U-10/U mg/l Turbidity Field In-situ, Horiba U-10/U53 5 NTU Ammonia Lab SM 4500 NH3 B,C 0.05 mg/l Nitrate as N Lab SM 4500 NO3 E, EPA mg/l Nitrite as N Lab SM 4500 NO2 B, EPA mg/l Total Kjeldahl Nitrogen Lab SM 4500 N C 0.5 mg/l Total Nitrogen Lab By calculation NA Ortho-phosphate as P Lab SM 4500 P E 0.05 mg/l Total Phosphate as P Lab SM 4500 P 0.05 mg/l Total Dissolved Solids Lab SM 2540 C 20 mg/l Total Iron Lab EPA mg/l Sulfate Lab SM 4500 SO4 E 5 mg/l Table 2a: Sample Dates and Monitoring Locations (Main Stem) Site ID Monitoring Location Oct 11 Nov 2 Dec 7 / 8 Jan 4 Feb 2 / 3 Mar 8 / 9 Apr 10 / 11 May 15 / 16 Jun 7 / 8 Jul 25 Aug 15 / 16 Sep 11 / 12 RBC01 Rainbow Jubilee Way D D D D F F F F F D D D RBC02 Rainbow Huffstatler Road F F F F F F F F F F F F RBC04 Rainbow Old Highway 395 F F F F F F F F F F F F RBC06 Rainbow 2219 Willow Glen Road F F F* F F* F* F* F* F* F* F* F* RBC10 Rainbow MWD Crossing D D D F F F F F F P D P SMG05 Rainbow Willow Glen Road F F F* F F* F* F* F* F* F F* F* SMG06 Rainbow Stage Coach Lane F F F* F F* F* F* F* F* F F* F* F flowing water sampling was conducted P ponded water no sampling D dry/ no flowing or ponded water no sampling * - Site was sampled on the second of the two dates during monthly monitoring
3 Table 3b: Sample Dates and Monitoring Locations (Tributaries) Site ID Monitoring Location Oct 11 Nov 2 Dec 7 / 8 Jan 4 Feb 2 / 3 Mar 8 / 9 Apr 10 / 11 May 15 / 16 Jun 7 / 8 Jul 25 Aug 15 / 16 Sep 11 / 12 RVT02 HST01 HST02 MGT01 RGT01 WGT01 VMT01 Chica 1 st Street Brow Ditch to Rainbow Huffstatler Road Brow Ditch to Rainbow Huffstatler Road Margarita Glen Tributary to Rainbow Creek Rainbow Glen Tributary to Rainbow Creek Willow Glen Willow Glen Road Via Milpas Tributary to Rainbow Creek P D F F F F F F F F F F D D P F F F F F P D D P D D D F F F F F P D D D D D D* D D* F* D* D* D* D D* D* F F F F F* F F F F* F F F F F F* F F* F* F* F* F* F F* F* D D D* D D* F* D* D* D* D D* D* F flowing water - sampling was conducted P ponded water no sampling D dry/ no flowing or ponded water no sampling * - Site was sampled on the second of the two dates during monthly monitoring Data Analysis Data collected during the Monitoring Year (October 2016 September 2017) were combined with all data collected since the inception of the Rainbow Creek TMDL monitoring (in May 2003). Total nitrogen and total phosphorus concentrations (in mg/l), estimated loadings (in kg/yr) and estimated flux (in kg/yr/acre) were calculated for each sampling occasion. The values of discharge used to compute loadings and flux were calculated using instantaneous measurements of flow (by means of a hand-held flow meter) and estimates of channel width and depth at each site on each sampling occasion. Caution should be used in extrapolating instantaneous measurements of both concentration and flow to annual values. Additionally, the data set includes dry weather data only (no samples were collected during storm events and up to 72 hours following rain with daily precipitation > 0.1 in). Flux was calculated as a ratio of each loading value and a contributing watershed/ drainage area at each sampling site. For the tributaries, flux estimates facilitate comparisons among tributary drainage areas of varying sizes. For the main stem of Rainbow Creek, flux was calculated cumulatively with the drainage area increasing progressively at each downstream sampling site. Mean concentrations (mg/l), loadings (kg/yr) and flux (kg/yr/acre) of total nitrogen and total phosphorus were calculated for each sampling site. For each mean, 95% confidence intervals were also
4 calculated at α = The data were then represented graphically. It must be noted that the mean total nitrogen and total phosphorus concentrations, loadings and flux were calculated using laboratory data only, therefore bar graphs are more representative of data collected in 2006 through 2016 than in 2003 through 2005 when field test kits were usually used to estimate nutrient levels. This has also resulted in a reduced number of data points that could be included in the analysis (i.e. laboratory analysis for total nitrogen and total phosphorus were not performed for April-August and October 2004, and January-April and June-September 2005; total phosphorus data are not available for February-May 2006). Total nitrogen and total phosphorus concentrations at all sampling locations were analyzed for trends. The analysis was performed using linear regression. The distributions of data points over time were then graphed and lines were fitted to the data (Figures in Attachment A). Line equations are also shown on the graphs. The graphs with downward sloping lines (negative slopes) indicate those sampling locations where negative trends were observed. Furthermore, r 2 values were calculated for each relationship and significance at α = 0.05 was determined for each r 2. The r 2 values range from 0 to 1. The higher the value of r 2, the stronger the trend with no trend indicated where r 2 =0 and all of the variation in data is explained by the linear relationship where r 2 = 1.

5 Figure 1: Monitoring Locations along Rainbow Creek and its Tributaries.
6 Results All field and laboratory data collected from October 2016 through September 2017 are presented in Attachment 1. The data were combined with those of previous years for further analysis as presented in Tables 3 and 4 and in Figure 2 below.
7 Table 3: Sample size (n), means and standard deviations (St. Dev.) of concentrations, loadings and flux for total nitrogen and total phosphorus calculated for each main stem sampling site for the combined seasons. Concentration (mg/l) Loading (kg/year) Flux (kg/yr/acre) Main Stem Location Drainage Area (Acres) Total Nitrogen Total Phosphorus Total Nitrogen Total Phosphorus Total Nitrogen Total Phosphorus n mean St. Dev. n mean St. Dev. n mean St. Dev. n mean St. Dev. n mean St. Dev. n mean St. Dev. RBC ,437 22, RBC ,356 30, RBC ,003 24, RBC ,472 42, SMG ,931 44, RBC ,236 34, SMG ,885 42, Table 4: Sample size (n), means and standard deviations (St. Dev.) of concentrations, loadings and flux for total nitrogen and total phosphorus calculated for each tributary sampling site for the combined seasons. Concentration (mg/l) Loading (kg/year) Flux (kg/yr/acre) Tributary Location Drainage Area (Acres) Total Nitrogen Total Phosphorus Total Nitrogen Total Phosphorus Total Nitrogen Total Phosphorus n mean St. Dev. n mean St. Dev. n mean St. Dev. n mean St. Dev. n mean St. Dev. n mean St. Dev. RVT ,715 7, HST , HST , RGT ,162 1, MGT , WGT ,800 1, VMT ,839 1,
8 A. B.
 and the tributaries (C-D) of Rainbow Creek from May 2003 through September")
9 C. D. Figure 2a: Mean concentrations of total nitrogen and total phosphorus as measured along the main stem (A-B) and the tributaries (C-D) of Rainbow Creek from May 2003 through September 2017
10 A. B.
11 C. D. Figure 2b: Mean loadings of total nitrogen and total phosphorus as measured along the main stem (A-B) and the tributaries (C-D) of Rainbow Creek from May 2003 through September 2017
12 A. B.
13 C. D. Figure 2c: Mean flux of total nitrogen and total phosphorus as measured along the main stem (A-B) and the tributaries (C-D) of Rainbow Creek from May 2003 through September 2017
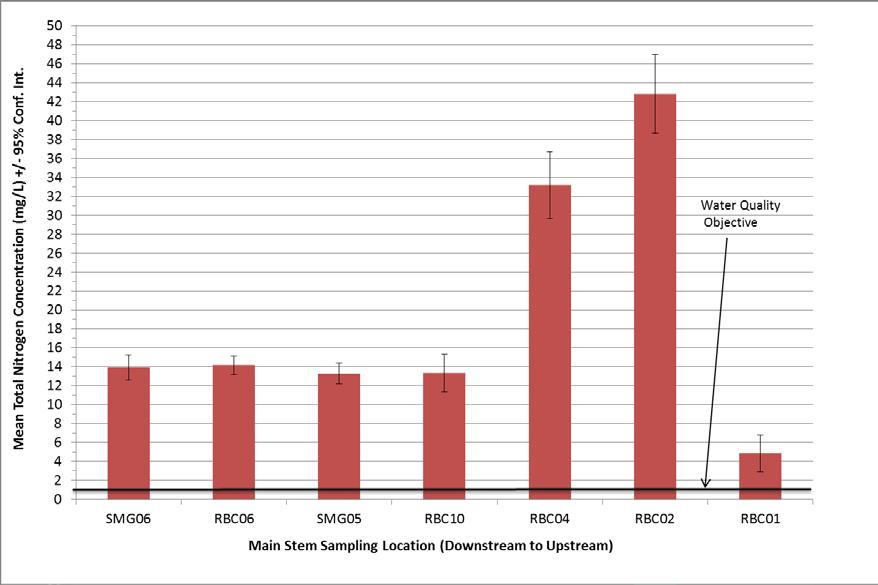
14 For all data combined (from May 2003 through September 2017), sample sizes (n), means and standard deviations of concentrations, loadings and flux for total nitrogen and total phosphorus are presented by sampling location for the main stem of Rainbow Creek (Table 3) and the tributaries (Table 4). For greater ease of interpretation, the mean concentrations, loadings and flux were then graphed with their respective 95% confidence intervals (shown with the error bars) (Figure 2a, 2b, and 2c). Sampling locations in Figure 2a-c are listed along the horizontal axis from the site furthest downstream to one furthest upstream. Separate bar graphs were prepared for locations along the Creek s main stem (Fig. 2a (A-B), 2b (A-B), and 2c (A-B)) and for its tributaries (Fig. 2a (C-D), 2b (C-D), and 2c (C-D)). Nutrient Concentrations To evaluate the overall differences in total P and total N concentrations among the monitoring locations, the combined dry and wet season mean concentrations were used. Main Stem Concentrations As shown in Fig. 2a (A-B), the mean total nitrogen and total phosphorus concentrations at monitoring locations along the main stem of Rainbow Creek exceeded their corresponding Basin Plan numerical water quality objectives (NWQO) for biostimulatory substances for the protection of the COLD and WARM beneficial uses (NWQO for total nitrogen =1.0 mg/l; NWQO for total phosphorus = 0.1 mg/l). The highest mean total nitrogen and total phosphorus concentrations along the main stem of Rainbow Creek were measured at Huffstatler Rd. (RBC02); Old Highway 395 (RBC04) had the second highest (Table 4, Fig. 2a (A-B)). Since the sampling sites in Fig.2a-c are arranged along the horizontal axis from West to East (from downstream up), this may indicate that nutrients were added to the system downstream of Jubilee Way (RBC01) and upstream of MWD Crossing (RBC10). Also, the total phosphorus concentration at MWD Crossing (RBC10) was significantly higher than those measured at all main stem sites downstream (SMG05, RBC06, SMG06). Tributary Concentrations As shown in Fig. 2a (C-D), the mean total nitrogen and total phosphorus concentrations at all tributary sampling locations exceeded their corresponding Basin Plan objectives of 1.0 mg/l and 0.1 mg/l. Rainbow Glen (RGT01) located just downstream of MWD Crossing (RBC10) had a total nitrogen concentration that was significantly lower than any of the remaining sampling sites (Fig. 2a (C)). The highest mean total N and Total P concentrations were found at the Chica tributary (RVT02) and Brow Ditch (HST01 and HST02). These tributaries enter Rainbow Creek downstream of Jubilee Way (RBC01) and just upstream of Huffstatler Rd. (RBC02). Instantaneous Nutrient Loadings Mean nutrient loadings and 95% confidence intervals for each sampling location are presented in Figure 2b (A-D). The loadings are only very rough estimates of true loadings since they are based on single instantaneous measurements of velocity (velocity measurements were averaged across the width of the channel as they were taken over a period of approximately seconds per sampling occasion) and only rough estimates of the cross-sectional area (area calculated on each sampling occasion from one measurement of width multiplied by an average of a few measurements of depth throughout a single cross-section of the channel). It should also be realized that the loading for each tributary was measured close to the downstream end and is unique to that tributary, while along the main stem of the Creek, loading values reflect all nutrients added to/ removed from the Creek as it flows downstream.
15 Main Stem Instantaneous Loadings As would be expected based on its location furthest upstream, Jubilee Way (RBC01) had the lowest mean nutrient loading. Just downstream of RBC01, at Huffstatler Rd. (RBC02), mean loading for both nutrients increased and remained high further down along the Creek as the loads are cumulative (Fig. 2b (A-B)). Tributary Instantaneous Loadings The highest mean loading for total phosphorus was found at Chica (RVT02). Mean loadings for total nitrogen were highest at Chica (RVT02) but also at Willow Glen (WGT01) and Via Milpas (VMT01), the two tributaries located furthest downstream. A high mean total nitrogen loading was also observed at Rainbow Glen tributary (RGT01). This suggests that nutrients, including total nitrogen and total phosphorus, were added to Rainbow Creek downstream of Jubilee Way (RBC01) and upstream of Huffstatler Rd. (RBC02) predominantly from the Chica tributary (RVT02). Further downstream, Rainbow Glen (RGT01), Via Milpas (VMT01) and Willow Glen (WGT01) tributaries may have also contributed significant amounts of total nitrogen to the system. Nutrient Flux Mean nutrient flux +/- 95% confidence intervals for each sampling location are presented in Figure 2c (A-D). The flux values were calculated from loadings (above) and they are therefore only very rough estimates of true flux. It should be noted that, while for each tributary, flux was calculated for its unique drainage area, whereas, along the main stem of the Creek, flux values are cumulative as nutrient loading changes and drainage area increases from upstream down. Main Stem Flux Nutrient flux did not significantly differ between main stem sampling locations; however, it appears that values decreased downstream of Jubilee Way (RBC01). Tributary Flux The mean total nitrogen flux was significantly higher for Willow Glen (WGT01) than for the four of five remaining tributaries (Fig. 2c (C)). The exception was Brow Ditch which also had high total nitrogen flux. In addition, the total phosphorus flux for the Brow Ditch was higher than those of all other monitored tributaries (Fig. 2c (D)). Trend Analysis As shown in Table 5 and in Attachment A, significant positive (increasing) trends in total nitrogen concentrations were evident at most locations along Rainbow Creek s main stem, while both positive and negative trends were observed at the tributaries. The most significant positive trends in total nitrogen concentrations along the main stem occur at Huffstatler Rd. (RBC02), Old Highway 395 (RBC04), and MWD Crossing (RBC10); no negative trends in total nitrogen concentrations along the main stem were observed. The most significant positive trend in total nitrogen concentrations at the tributaries occurred at Chica Tributary (RVT02), while the most significant negative trend occurred at Margarita Glen Tributary (MGT01). For total phosphorus concentrations, most of the main stem locations had statistically significant negative (decreasing) trends. Huffstatler Rd. (RBC02) had the most significant decreasing trend, while Old Highway 395 (RBC04) also had a significant decreasing trend. As for the tributary locations, the
16 Brow Ditch (both HST01 and HST02) had a significantly increasing trend in total phosphorus concentrations, while Chica Tributary (RVT02) had a decreasing trend. Table 5. Results of trend analysis for total nitrogen and total phosphorus concentrations at different sampling locations along Rainbow Creek s main stem and tributaries. Trend indicates positive or negative trend over time; r 2 is directly proportional to the fraction of the variability in the data that can be explained by the regression equation; values in bold indicate statistically significant r 2 at α = 0.05 (two-tailed). Site ID Total Nitrogen Total Phosphate as P Trend r 2 Trend r 2 Main Stem Locations RBC RBC RBC RBC SMG RBC SMG Tributary Locations RVT HST HST RGT MGT WGT VMT Conclusions With respect to the first question of How do the mean concentrations, loading and flux of total nitrogen and total phosphorus vary among sampling sites along the main stem of Rainbow Creek? Mean concentrations of total nitrogen and total phosphorus significantly increased in the main stem of Rainbow Creek from Jubilee Way (RBC01), located furthest upstream, to Stage Coach Lane (SMG06) furthest downstream. Also, for both total nitrogen and total phosphorus, there was a significant increase in mean concentration just downstream of Jubilee Way (RBC01) and a significant decrease downstream of the Old Highway 395 (RBC04). This may suggest that nutrients were added to the system just downstream of Jubilee Way (RBC01) and upstream of Huffstatler Rd. (RBC02) and that there may have been some nutrient assimilation downstream of the Old Highway 395 (RBC04). The estimated mean nutrient loading in Rainbow Creek increased from upstream to downstream. The mean loadings per year at the upstream-most location sampled (RBC01) were 8,437 kg for total nitrogen and 181 kg for total phosphorus; they were 25,885 kg for total nitrogen and 498 kg for total phosphorus at the mouth of Rainbow Creek (SMG06). With respect to the second question of How do the mean concentrations, loading and flux of total nitrogen and total phosphorus vary among sampling sites in the tributaries of Rainbow Creek? All of the sampled tributaries exhibited mean total nitrogen and total phosphorus concentrations that exceeded their corresponding water quality objectives of 1 mg/l and 0.1 mg/l. This suggests that all tributaries in the current study contributed nutrients to Rainbow Creek. The Brow Ditch at Huffstatler
17 Road (HST01 and HST02), Willow Glen (WGT01) and Via Milipas (VMT02) had mean total nitrogen flux values that were significantly higher than those of the three remaining tributaries making them noteworthy as potential sources of total nitrogen in the Creek. The Chica tributary (RVT02) had the highest mean total nitrogen and total phosphorus loadings but its total nitrogen flux did not exceed those of Via Milpas (VMT01), Brow Ditch (HST01), and Willow Glen (WGT01). With respect to the third question of Are there any significant trends (positive or negative) in total nitrogen and total phosphorus concentrations in Rainbow Creek main stem and tributaries over time? Since sampling begun, in May 2003, through the end of June 2011, concentrations of total nitrogen and total phosphorus showed statistically significant decreases at all but two sampling locations along Rainbow Creek s main stem (WURMP 2011). During that time, significant negative trends in total nitrogen concentrations were also observed at four of the six tributary locations sampled; one of the six tributaries, RVT02, also showed a significant decrease in total phosphorus concentrations. However, when data collected from July 2011 through the end of September 2017 were added to the analysis, all negative trends for total nitrogen concentrations along the main stem of Rainbow Creek have now become positive (Table 5; Attachment A). Only two of the main stem locations (RBC01, the most upstream, and SMG06, the most downstream) showed positive, but not statistically significant, trends. For total phosphorus concentrations along the main stem, decreasing trends continued at all locations, while only two locations did not show a statistically significant decreasing trend (RBC10 and RBC06). Some of the tributaries (MGT01, WGT01 and VMT01) still exhibited significant negative trends in total nitrogen concentrations, while the Brow Ditch at Huffstatler Rd. (HST01 and HST02) and Chica Tributary (RVT02) show increasing trends in total nitrogen concentrations. Chica Tributary (RVT02) has also shown a significant decreasing trend in total phosphorus concentrations, while the Brow Ditch (HST01 and HST02) have shown significant increasing trends; the remaining tributary locations do not show any significance in increasing or decreasing trends (r 2 < 0.05). In conclusion, nutrient loads in Rainbow Creek generally increased downstream and all sampled tributaries contributed at least some nutrients to the Creek. Total nitrogen concentrations tended to increase over time in the main stem of the creek.
18 References California Regional Water Quality Control Board (CRWQCB) San Diego Region Order No. R National Pollutant Discharge Elimination System (NPDES) Permit and Waste Discharge Requirements for Discharges from the Municipal Separate Storm Sewer Systems (MS4s) Draining the Watersheds within the San Diego Region Attachment E pp. E9-E13: Total Maximum Daily Loads for Total Nitrogen and Total Phosphorus in Rainbow Creek Watershed / _Order_No._R _COMPLETE.pdf California Regional Water Quality Control Board (CRWQCB) San Diego Region Resolution No. R Basin Plan Amendment and Final Technical Report for the Total Nitrogen and Total Phosphorus Maximum Daily Loads for Rainbow Creek. San Diego, California. WURMP Santa Margarita River Watershed Watershed Urban Runoff Management Plan (WURMP) Fiscal Year Annual Report. Margarita/SMR_WURMP_FY1011AR.pdf
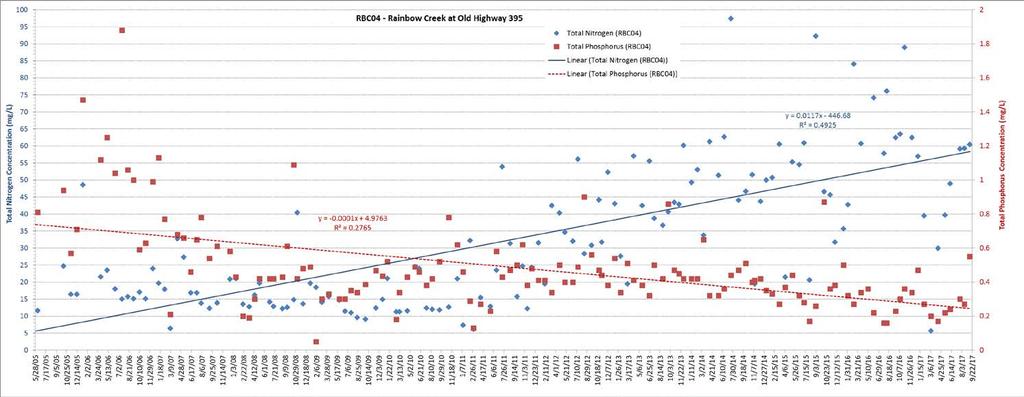
19 Attachment A Distributions of total nitrogen concentrations (left axis; in blue) and total phosphate as P concentrations (right axis; in red) over the entire sampling period. For each sampling location, a line was fitted to the data; the line equations are also shown on the charts.
20
21
22
23
24
25
26
27
28
29
30
31
32
33