Clear/Clarks Creek Basin Plan
|
|
|
- Samuel Patrick
- 5 years ago
- Views:
Transcription


1 Clear/Clarks Creek Basin Plan Volume 1 - Basin Plan & SEIS CLEAR/CLARKS CREEK BASIN PLAN Volume 1 Basin Plan & SEIS As Adopted PCC s May 2006
2 Clear / Clarks Creek Basin Plan TABLE OF CONTENTS ITEM PAGE CHAPTER 1: INTRODUCTION 1.1 BASIN PLANNING PROGRAM CLEAR / CLARKS CREEK BASIN PLAN Study Area Description of Subbasins Key Elements of Basin Plan STATEMENT OF PURPOSE GOALS AND OBJECTIVES Chapter 1: Table of Figures Figure 1-1 Clear / Clarks Creek Basin & Vicinity Figure 1-2 Study Area Chapter 1: Tables Table 1 1 Goals and Objectives CHAPTER 2: APPLICABLE PROGRAMS, POLICIES, AND REGULATIONS 2.1 FEDERAL REGUALTIONS, POLICIES AND PROCEDURES Clean Water Act Endangered Species Act National Flood Insurance Program Settlement Agreement with the Puyallup Tribe STATE REGULATIONS, PLANS AND PERMITS State Water Quality Standards Aquifer and Wellhead Protection The Growth Management Act and the Comprehensive Plan for Pierce County, Washington Shoreline Management Act State Hydraulic Code The Nonpoint Rule PIERCE COUNTY REGULATIONS, POLICIES AND PROGRAMS Pierce County Storm Drainage and Surface Water Management Master Plan Army Corps of Engineers General Investigation New Starts Program Studies and Reports Chapter 2: Tables Table 2-1 Federal and State Laws and Regulations CHAPTER 3: STAKEHOLDER INVOLVEMENT 3.1 STAKEHOLDERS AND RELATIONSHIP TO BASIN PLAN Pierce County Planning and Land Services (PALS) TOC - 1
3 3.1.2 Washington State Department of Ecology (ECOLOGY) Washington State Department of Wildlife (WDFW) Puyallup Tribe of Indians Cities and Towns Other Agencies or Groups Citizens within the Clear / Clarks Creek Basin ROLES AND RESPONSIBILITIES Responsibility for Decision-Making Communication Public Involvement at Key Points Chapter 3: Table of Figures Figure 3.1 Basin Relationship to Community Planning Areas Figure 3.2 Relationship of The Clear / Clarks Creek Basin To Local Governments Figure 3.3 Communications with Public and Other Agencies Chapter 3: Tables Table 3-1 Areas of Local Government in the Clear/Clarks Creek Basin CHAPTER 4: CURRENT CONDITIONS 4.1 TOPOGRAPHY, SOILS, AND RAINFALL Topography Soils Rainfall LAND USE AND POPULATION Land Use Population NATURAL AND CONSTRUCTED DRAINAGE Drainage Overview Natural Drainage Basin Constructed Drainage System Stream Flow Characteristics Floodplains Groundwater AQUATIC AND RIPARIAN HABITAT Historical Fish Presence Stream Evaluation Water Features Crucial To Fish Habitat WETLAND HABITAT AND UPLANDS HABITAT Wetland Habitat Upland Habitat 4.6 WATER QUALITY Roosevelt Ditch Basin Clear Creek Basin Clarks Creek Basin Potholes Basin TOC - 2
4 Chapter 4: Table of Figures Figure 4.1 Topography Figure 4.2 Soils Map Figure 4.3 Average Monthly Rainfall at McMillan Reservoir Figure 4.4 Historic Annual Precipitation at McMillan Reservoir Figure 4.5 Existing Land Use Figure 4.6 Zoning Map Figure 4.7 Population Trends in Clear/Clarks Creek Basin Figure 4.8 Natural and Constructed Drainage System Figure 4.9 Stream Gauge and Water Quality Sampling Locations Figure 4.10 Floodplain Map Figure 4.11 Habitat Field Observations Figure 4.12 Wetlands Figure 4.13 Clarks Creek Microbial Source Tracking Results Figure 4.14 Rody Creek Microbial Source Tracking Results Figure 4.15 Diru Creek Microbial Source Tracking Results Figure 4.16 Woodland Creek Microbial Source Tracking Results Figure 4.17 Meeker Ditch Microbial Source Tracking Results Chapter 4: Tables Table 4-1 Existing and Future Land-Use Conditions EIA Table 4-2 Drainage Inventory Table 4-3 Drainage Facilities Table 4-4 List of Active and Historical Stream Gauges Table 4-5 Statistics of Monthly Mean Data for Water Years Table 4-6 Peak Discharge Frequency Relationships Table 4-7 Summary Of 100- And 500- Year Floodplain Table 4-8 Fish Species of Concern Table 4-9 LWD Statistics per Stream Table 4-10 Fish Passage Barrier Locations Table 4-11 B-IBI Scores Table 4-12 Summary of Number and Acreage of Wetlands Table Assessment of Water Quality Table 4-14 Average Water Quality Date and Geometric Mean for Fecal Coliform Table 4-15 Water Quality Criteria for Freshwater Class A in the State of Washington Table 4-16 Clear Creek Sampling Summary Table 4-17 Swan Creek Sampling Summary Table 4-18 Clarks Creek Sampling Data Table 4-19 Rody Creek Sampling Data Table 4-20 Diru Creek Sampling Data Table 4-21 Woodland Creek Sampling Data Table 4-22 Meeker Ditch Sampling Data TOC - 3
5 CHAPTER 5: IDENTIFICATION OF PROBLEM SOURCES USED FOR PROBLEM IDENTIFICATION PROBLEM INVESTIGATION Chapter 5: Table of Figures Figure 5-1a Swan Creek Flooding, Riparian /Aquatic Habitat, Erosion, and Water Quality Problems Figure 5-1b Squally Creek Flooding, Riparian /Aquatic Habitat, Erosion, and Water Quality Problems Figure 5-1c Clear Creek Flooding, Riparian /Aquatic Habitat, Erosion, and Water Quality Problems Figure 5-1d Canyon Creek Flooding, Riparian / Aquatic Habitat, Erosion and Water Quality Problems Figure 5-2a Rody Creek Flooding, Riparian / Aquatic Habitat, Erosion and Water Quality Problems Figure 5-2b Diru Creek Flooding, Riparian / Aquatic Habitat, Erosion and Water Quality Problems Figure 5-2c Woodland Creek Flooding, Riparian / Aquatic Habitat, Erosion and Water Quality Problems CHAPTER 6: STORMWATER DRAINAGE AND FLOODING ANALYSIS 6.1 FLOW MODELING AND ANALYSIS Stream Flow Hydraulic Analysis EXISTING PROBLEMS Flooding Storm Drainage and Surface Water Management Plan Culverts and Channel Capacity Stream Bank Erosion/Instability Groundwater Recharge FUTURE PROBLEMS Flooding Stream Bank Erosion/Instability Groundwater Recharge POTENTIAL SOLUTIONS Problems Resolved or Not Addressed In the Basin Plan Small Works Projects, Maintenance, and Enforcement Issues Capital Improvement Program Projects Potential Programmatic Measures SITES REQUIRING MORE DETAILED DATA OR ANALYSIS Chapter 6: Table of Figures Figure Figure 6.2 Hydraulic Modeling Locations Chapter 6: Tables Table 6-1 Existing and Future Flood Frequency Table 6-2 Existing and Future Flow Duration Table 6-3 Average Number of Hours per Year with Flow Duration Above 2-Year Peak Flow TOC - 4
6 Table 6-4 Frequency of Flooding at Undersized Roadway Culverts under Existing Land Use Conditions Table 6-5 Frequency of Flooding in Storm Drain Systems under Existing Land Use Conditions Table 6-6 Frequency of Flooding in Roadside Ditch and Culvert Systems under Existing Land Use Conditions Table 6-7 Problem Locations with Increased Frequency of Flooding Under Future Land Use Conditions Table 6-8 Resolved Drainage Issues Table 6-9 Private Property Drainage Issues Table 6-10 Drainage Issues Referred To Other Jurisdictions Table 6-11 Small Works Drainage Issues Identified for Clear/Clarks Creek Subbasins Table 6-12 Flooding and Drainage CIP Projects CHAPTER 7: WATER QUALITY ANALYSIS 7.1 INTRODUCTION WATER QUALITY PROBLEMS REVIEW Existing Stormwater Treatment Facilities Water Quality Facilities in Private Development Monitoring Data Temperature Dissolved Oxygen Nutrients Fecal Coliform Turbidity and Suspended Solids ph Sediment Excessive Growth of Invasive Aquatic Vegetation WATERSHED ANALYSIS Watershed Treatment Model Model Development Model Results Existing Loads ANALYSIS OF THE RESULTS FUTURE CONDITIONS Upcoming Projects Future Land Use PROGRAMMATIC RECOMMENDATIONS Water Quality Monitoring Plan Adopt Updated Stormwater Management Standards Invasive Species Management Program Floodplain/Riparian Corridor Land Management Stormwater Structure Retrofits Street Sweeping Education Programs Structural Stormwater Management Practices SITE-SPECIFIC WATER QUALITY RECOMMENDATIONS Roosevelt Ditch Drainage Area TOC - 5
7 Chapter 7: Tables Table 7-1 Water Quality Problems Table 7-2 Predicted Existing Loads for Clear Creek and Clarks Creek Basins from Watershed Treatment Model Table 7-3 Comparison of Date with Results of the Watershed Treatment Model Table 7-4 Predicted Load Reduction Benefits Of Future Management Practices Clear Creek Basin Table 7-5 Predicted Load Reduction Benefits Of Future Management Practices Clarks Creek Basin CHAPTER 8: STREAM HABITAT AND RIPARIAN AREAS ANALYSIS 8.1 SUMMARY OF AQUATIC HABITAT FIELD INVESTIGATION LIMITING FACTORS EXISTING AQUATIC HABITAT PROBLEMS Fish Passage Barriers Altered Stream Flows Riparian Corridors Instream Habitat Stream Bank Erosion & Instability Channel Morphology FUTURE HABITAT CONDITIONS Fish Passage Barriers Stream Flows and Stream Bank Erosion Riparian, Instream Habitat and Channel Morphology POTENTIAL SOLUTIONS Special Considerations in Solution Development Problems Resolved or Not Addressed in the Basin Small Works Projects, Maintenance, and Enforcement Issues Capital Improvement Program Projects Problems Requiring More Detailed Data or Analysis Chapter 8: Table of Figures FIGURE 8.1 Average Monthly Flow at Swan Creek FIGURE 8.2 B-IBI Scores and EIA Chapter 8: Tables Table 8-1 USBEM Phase II Habitat Condition Assessment Table 8-2 Limiting Factors Table 8-3 Level B Fish Passage Barrier Analysis Table 8-4 Resolved Aquatic Habitat Issues Table 8-5 Aquatic Habitat Issues Referred to Other Parties Table 8-6 Aquatic Habitat CIP Projects CHAPTER 9: BASIN PLAN 9.1 SUMMARY OF PLAN RECOMMENDATIONS Capital Improvement Projects Programmatic Measures Additional Studies Implementation Strategy TOC - 6
8 9.2 PLAN APPROACH TO BASIN NEEDS Preference for Non-Structural Solutions Low Impact Development Economic Development Critical Areas Conservation Public Involvement and Education Compliance with Storm Drainage and Flood Hazard Regulations Drainage and Flood Hazard Management Water Quality Aquatic (Floodplain) Habitat Protection SPECIFIC RECOMMENDATIONS Project Identification Codes Capital Improvements Programmatic Measures IMPLEMENTATION Capital Facilities Element of Pierce County Comprehensive Plan Annual Budget for Pierce County Water Programs Order of Implementation Economic Development Criteria Voluntary Actions By Other Interested Parties Chapter 9: Table of Figures Figure 9.1 Squally Creek Recommended CIP Figure 9.2 Clarks Creed Basin CIP Projects Figure 9.3 Potholes Basin CIP Projects Figure 9.4 Recommendations for Monitoring and Additional Studies Chapter 9: Tables Table 9.1 Estimated Costs of Plan Recommendations Table 9.2 High Priority Recommended Projects Table 9.3 Medium-Priority Recommended Projects Table 9.4 Low-Priority Recommended Projects Table 9.5 Summary of CIP Projects Table 9.6 Roosevelt Ditch Table 9.7 Swan Creek Table 9.8 Squally Creek Table 9.9 Clear Creek Table 9.10 Canyon Creek Table 9.11 Rody Creek Table 9.12 Diru Creek Table 9.13 Woodland Creek Table 9.14 Clarks Creek Table 9.15 Potholes Table 9.16 Recommended Programmatic Measures by Priority Table 9.17 Recommended Flow and Water Quality Monitoring Table 9.18 Recommended Studies to Fill Information Gaps TOC - 7
9 CHAPTER 10: SUPPLEMENTAL ENVIRONMENTAL STATEMENT FACT SHEET i 10.1 SUMMARY DSEIS Supplements 1991, Non-Project and Phased Environmental Review Format DSEIS Summary of Impacts ALTERNATIVES, INCLUDING THE PROPOSED ACTION Introduction Background SWM Plan (1991) Use of the 1991 Plan as Principal Focus of CIP has Evolved Proposed Action No Action Alternative AFFECTED ENVIRONMENT, SIGNIFICANT IMPACTS, AND MITIGATION MEASURES Water Resources Water Quality Other Agencies Conducting Water Resource Enhancement Projects Fishery Resources Plants and Animals Soils Land and Shoreline Use Aesthetic, Historic and Cultural Resources Public Services and Utilities Chapter 10: Tables Table 10-1 Summary Comparison of Impacts Table 10.2 Goals of Pierce County Storm Drainage and SWM Plan Table 10-3 Original High Priority CIP Projects TOC - 8
10 EXECUTIVE SUMMARY EXECUTIVE SUMMARY ES.1 Introduction and Purpose The Clear/Clarks Creek Basin Plan (Basin Plan) is intended to serve as a comprehensive guide to storm drainage and surface water management in unincorporated parts of the Roosevelt Ditch drainage area, Clear Creek drainage basin, Clarks Creek drainage basin, and the Potholes drainage area. The Basin Plan addresses many aspects of surface water management with emphasis on flooding, erosion, water quality, and habitat problems and solutions to the problems identified. The purpose of the Clear/Clarks Creek Basin Plan is to establish the actions Pierce County Public Works and Utilities, will take over the next ten years to reduce flood hazards, to protect water quality, and to protect associated riparian and aquatic habitat in the basin. Recommended actions are based on the physical characteristics of the basin; the laws, policies, and regulations that apply to storm drainage and surface water management in unincorporated Pierce County; the preferences of citizens in the County and in the Clear/Clarks Creek Basin; and the character of existing land use and planned growth as set out in the Comprehensive Plan for Pierce County, Washington. The Basin Plan will guide annually updated work plans for capital improvement projects and programmatic measures of Water Programs. ( Programmatic refers to non-structural actions, such as changes to regulations, policies, programs, and how they are administered.) The Basin Plan also identifies key supportive actions needed from other parts of county government and other jurisdictions to ensure that flooding, habitat, and water quality issues in this basin are addressed in a coordinated manner. Water Programs managers will convey these needs to appropriate programs (e.g., Transportation Division, Planning and Land Services Department, Tacoma-Pierce County Health Department, Pierce Conservation District, community planning boards and forums, and Washington State Department of Transportion. This Basin Plan has been developed as part of Water Program s basin planning program. The program updates the Pierce County Storm Drainage and Surface Water Management (1991 Plan) by developing ten basin-specific plans. The 1991 Plan has guided storm drainage and surface water management facilities and services for over a decade and much of the 1991 Plan has been implemented. The 1991 Plan studied the Clear/Clarks Creek Basin and recommended $11.2 million dollars in improvements, many that have been constructed. Clear/Clarks Creek is one of 26 Pierce County drainage basins (see Figure ES-1). The Basin Plan supports or furthers Pierce County s: Compliance with its federal "Clean Water Act" National Pollution Discharge Elimination System (NPDES) municipal stormwater permit Compliance with the "Endangered Species Act" (ESA) by eliminating or reducing existing or potential habitat issues that could cause jeopardy for protected species Upgrade to a "Class 4," rating or better under the Federal Emergency Management Agency s (FEMA) "Community Rating System" (CRS) Pierce County Public Works & Utilities ES-1
11 EXECUTIVE SUMMARY ES.2 Goals of the Clear/Clarks Creek Basin Plan Specific goals and objectives of the Clear/Clarks Creek Basin Plan are as follows: Reduce Flood Hazards Incidents of property loss and repeat damage are reduced Streams will not be adversely affected by flood events Pierce County s standing under the FEMA Community Rating System is improved New development is located outside of flood prone areas Improve Water Quality State Surface Water Quality Standards (WAC a) are met or exceeded Number of impaired (303d listed) water bodies is reduced Pierce County is in compliance with its NPDES permit for stormwater by meeting permit terms and conditions to the maximum extent practicable Risk of groundwater contamination is reduced Rates of erosion are reduced Improve Associated Fish and Wildlife Habitat Number of stream miles available for wild, native fish populations is increased Population numbers of species listed as "endangered" or "threatened" under the Federal Endangered Species Act are maintained or increased Quality and quantity of available wetland, riparian, and upland habitat is improved Demonstrate coordinated and responsible use of public resources Cost of maintaining stormwater facilities is reduced Project value is favorable when measured against costs and benefits Polls demonstrate that public awareness of flooding, habitat, and water quality issues has increased Monitoring and enforcement programs demonstrate an increase in services per dollar spent Basin plan implementation also implements elements of other Pierce County plans. Basin plan findings are used by other agencies and jurisdictions in planning their activities. Influence location and methods for new development New development in flood-prone, riparian, or significant habitat areas is prohibited. Low Impact Development techniques are widely used. Effective storm drainage best management practices (BMPs) are identified and widely used. Pierce County Public Works & Utilities ES-2
12 EXECUTIVE SUMMARY ES.3 Basin Description The Clear/Clarks Creek Basin is composed of the drainage areas tributary to the south side of the Puyallup River between River Mile- (RM)-2.8 and RM-7. Like the Mid-Puyallup Basin, it excludes the main stem of the Puyallup River (see Figure ES-2). The main stem of the Puyallup River is covered in the Puyallup River Comprehensive Flood Control Management Plan. Major flooding concerns related to the levee system along the lower Puyallup River are principally addressed in the Puyallup River Comprehensive Flood Control Management Plan. The entire Clear/Clarks Creek Basin encompasses 32.9 square miles of which 27.4 square miles (83%) exist within unincorporated Pierce County. The remaining 5.5 square miles (17%) lay within the cities of Tacoma and Puyallup. For a description of the roles of the cities and the Puyallup Tribe in the Basin and in this Basin Plan, refer to Chapter 3, Stakeholder Involvement. The Clear/Clarks Creek Basin is part of Washington State Water Resource Inventory Area (WRIA) 10, the Puyallup-White River Basin. Clear/Clarks Creek Basin contains two major tributaries plus a small area called the Roosevelt Ditch drainage area and an area that is internally drained called the Potholes. The Clear/Clarks Creek Basin Plan includes the Roosevelt Ditch and Potholes drainage areas because they are adjacent areas that do not fall logically into any other drainage basin, they are not large enough for the cost-efficient preparation of individual basin plans, and the areas were included in the Clear/Clarks Creek study area of the 1991 Plan. ROOSEVELT DITCH DRAINAGE AREA: Flows into the City of Tacoma & the T Street drainage CLEAR CREEK BASIN: CLARKS CREEK BASIN: Swan Creek Squally Creek Clear Creek Canyon Creek Rody Creek Diru Creek Woodland Creek Clarks Creek POTHOLES: Afdem Black Swamp Capital Heritage Glen Tip Top 128 th Street Meridian Street 135 th Street Candlewood-Manorwood 117 th Street Lower 144 th Street Alderwood Upper 144 th Street Springfield South Central 110 th Avenue Pierce County Public Works & Utilities ES-3
13 EXECUTIVE SUMMARY repeat of County figure 1-2 from Chapter 1 Figure ES-1 Study Area Pierce County Public Works & Utilities ES-4
14 EXECUTIVE SUMMARY ES.4 Problems, Proposed Solutions and the Prioritization Process Problems identified in the Basin Plan include: flooding of property and roads, impaired water quality, stream channel incising, erosion and sedimentation, loss of floodplain, and degraded aquatic habitat. The Basin Plan addresses the adverse effects of these problems and issues, such as: property damage from flooding; violations of federal, state, and local regulations; and threats to public health and safety. It explores the causes behind the problems Each potential Capital Improvement Project (CIP) and programmatic recommendation was evaluated for its net natural resource management benefit and then prioritized based on cost-tobenefit considerations. In determining net benefit, each project and program was scored using a system that assigned points for the project or program s potential for various aspects of flood reduction, water quality protection or improvement, natural resource improvement, and other factors such as economic development, multiple use, education, and recreation. Each project and program was reviewed and scored using approximately 40 specific criteria. Recommended CIPs and programs were then put in rank order, based on their numeric benefit score, and grouped by "High," "Medium," and "Low" priority order. In total, the Basin Plan recommends $65,557,000 of projects, programs, and studies for the Clear/Clarks Creek Basin. This includes $33,114,000 of "High Priority" projects; $27,612,000 of "Medium Priority" projects; and $4,607,000 of "Low Priority" projects. Additionally, the Basin Plan recommends gathering more information in various studies estimated to cost $224,000. ES.4.1 Recommended Actions The Clear/Clarks Creek Basin Plan contains 65 capital improvement projects, 12 programmatic measures, and four studies to remedy flooding, erosion, water quality, and stream habitat problems resulting from surface water runoff in the Basin. Table ES-1 Estimated Costs of Plan Recommendations Project Type High Medium- Low- Priority Priority Priority Capital Improvement Projects $30,474,000 $27,591,000 $4,585,000 Programmatic Measures $2,716,000 $21,000 $22,000 Studies $224,000 Total Estimated Cost $65,595,000 Pierce County Public Works & Utilities ES-5
15 EXECUTIVE SUMMARY Capital improvement projects and programmatic measures have been divided into High- Priority, Medium-Priority, and Low-Priority 1 groups. Priorities were not established for studies. Estimated costs of recommendations by priority group are as follows: Table ES-2 ID Code HIGH-PRIORITY RECOMMENDED PROJECTS Project Title Rating Score Estimated Cost PRG00-02 Update Stormwater Management Standards (Manual) 380 $6,200 * PRG00-01 Low-Impact Development ,600 * PRG00-11 PRG00-08 Enhanced Cooperative Arrangements with Cities & Other Jurisdictions ,000 * Establish a BMP Manual for Surface Water Maintenance Activities ,600 * PRG00-09 Invasive Species Management Program ,600 * PRG00-04 PRG00-06 Land Management Program for Flood Hazard Reduction & Storm Drainage Practices Impact Mitigation ,000 * Create an Education, Outreach, & Technical Assistance Program ,000 * PH-IP th Street East Infiltration Pond ,000 PRG00-05 Riparian & Wetland Restoration Program to Restore Flood Storage & Maintain Water Quality ,000 * PRG00-07 Surface Water Monitoring Program 985,000 * CL-RST01 RY-RST01 Clear/Clarks Creek Basin Monitoring 244 Clear Creek Stream Corridor Restoration Rody Creek Stream Corridor Restoration ,000 Segment 1: 402,000 Segment 2: 402,000 Segment 3: 402,000 TOTAL: 1,207,000 Segment 1: 410,000 Segment 2: 410,000 Segment 3: 410,000 TOTAL: 1,231,000 PRG00-03 Increase Enforcement Inspections 398 1,272,000 * PH-PL04 144th and 94th Avenue Pipeline 252 1,282,000 1 Low-Priority does not mean not a priority. No Priority actions have already been excluded from this Basin Plan. Rather, Low-Priority means the project rated lower than other needs in the Basin. Examples of these include projects with only a single-benefit; the rating system is weighted toward multiple benefits. Pierce County Public Works & Utilities ES-6
16 EXECUTIVE SUMMARY HIGH-PRIORITY RECOMMENDED PROJECTS - continued ID Code SW-AC01 WO-RST01 CY-RST01 CK-RST01 RD-DP01 CL-AC01 Project Title Swan Creek at 112th Street Floodplain Storage/Headwaters Preservation Woodland Creek Stream Corridor Restoration Canyon Creek Stream Corridor Restoration Clarks Creek Stream Corridor Restoration Rating Score Estimated Cost Segment 1: 343,000 Segment 2: 442,000 Segment 3: 442,000 TOTAL: 1,306,000 Segment 1: 490,000 Segment 2: 490,000 Segment 3: 490,000 TOTAL: 1,470,000 Segment 1: 472,000 Segment 2: 472,000 Segment 3: 472,000 Segment 4: 472,000 Segment 5: 472,000 Segment 6: 472,000 TOTAL: 2,834,000 Segment 1: 470,000 Segment 2: 470,000 Segment 3: 470,000 Segment 4: 470,000 Segment 5: 470,000 Segment 6: 470,000 Segment 7: 470,000 TOTAL: 3,287,000 Portland Avenue Regional Detention Facility, Roosevelt Ditch Area 276 3,884,000 Clear Creek Floodplain Repetitive Loss Land Acquisition 345 6,455,000 SW-DP01 Swan Creek Regional Detention Facility 259 6,455,000 Total Estimated Cost $33,152,200 * indicates the Clear/Clarks Creek Basin share (21.2%) of the estimated cost of a program of County-wide applicability Pierce County Public Works & Utilities ES-7
17 EXECUTIVE SUMMARY Table ES-3 MEDIUM-PRIORITY RECOMMENDED PROJECTS ID Code Project Title Rating Score Estimated Cost PRG00-12 Stormwater Facility Design Process ,200 * SW-SBS03 RD-SWL01 CL-SBS03 CL-SBS04 DU-SBS01 RY-SBS01 CL-CR01 CL-VC01 RY-SBS02 CK-SP01 Swan Creek 64th Street East Culvert Outfall Repair ,000 20th Avenue East Drainage Swale, Roosevelt Ditch ,000 Clear Creek Streambank Stabilization in vicinity of 49th Street ,000 Clear Creek Streambank Stabilization on West Fork Clear Creek Downstream of 64th Street E ,000 Diru Creek Streambank Stabilization at 72nd St East ,000 Rody Creek Streambank Stabilization at 72nd Street East ,000 Clear Creek 88th Street E Culvert Replacement ,000 Clear Creek at 104th Street E Vegetation Control ,000 Rody Creek Streambank Stabilization at 80th Street East ,000 Clarks Creek State Hatchery Sedimentation Basin Retrofit ,000 CL-SBS05 Clear Creek Streambank Stabilization 5000 block of Vickery Avenue East ,000 SW-SBS01 SQ-VC01 CL-SBS02 CY-SBS03 CY-SBS01 CY-SBS02 CK-PL01 Swan Creek Streambank/Channel Stabilization at 72nd Street E Outfall ,000 Squally Creek at Pioneer Way E Vegetation Control ,000 Clear Creek Streambank Stabilization on East Fork Downstream of 72nd Street E ,000 Canyon Creek Streambank Stabilization on Reach Upstream of Second Canyon Road Crossing ,000 Canyon Creek Streambank Stabilization on Reach Downstream of 80th Street East ,000 Canyon Creek Streambank Stabilization on Reach Downstream of 72nd Street East , th Street East Drainage Improvement (Woodland Elementary School) ,000 Pierce County Public Works & Utilities ES-8
18 EXECUTIVE SUMMARY MEDIUM-PRIORITY RECOMMENDED PROJECTS - continued ID Code CL-SBS01 Project Title Rating Score Estimated Cost Clear Creek Streambank Stabilization on West Fork Downstream of 72nd Street E ,000 CK-AC01 SW-SBS02 WO-SBS01 CY-SBS04 WO-SBS02 Clarks Creek Property Acquisition at 104th Street East 168 Swan Creek Streambank/Channel Stabilization from 72nd Street E to 64th St E , ,000 Woodland Creek Streambank/Channel 305,000 Stabilization at 84th Street East 150 Canyon Creek Streambank Stabilization Downstream of Second Canyon Road Crossing ,000 Woodland Creek Streambank Stabilization at 80th Street E ,000 PH-PL05 Springfield Pothole Pipeline ,000 CK-PL02 Fruitland Avenue Drainage Improvement - 104th Street E to 96th Street E, Clarks Creek ,000 PH-PL th Street Pipeline, 135 th Street Pothole ,000 CY-SL01 SW-SBS04 DU-RST01 RY-DP01 CY-DP02 PH-PL06 WO-DP01 Canyon Creek 58th Avenue East Setback Levee ,000 Swan Creek Streambank Stabilization Downstream of 64th Street East Diru Creek Stream Corridor Restoration Downstream of Pioneer Way East Segment 1: 380,000 Segment 2: 380,000 Segment 3: 380,000 TOTAL: 1,140,000 Segment 1: 410,000 Segment 2: 410,000 Segment 3: 410,000 TOTAL: 1,231,000 Rody Creek Regional Detention Facility Expansion 123 1,313,000 Canyon Creek 90th Street East Detention (D ) 184 1,586,000 South Hill Pump Station Pipeline to Puyallup River 181 2,466,000 Woodland Avenue Flood Control Phase II CIP 155 2,960,000 CL-DP01 West Fork Clear Creek Regional Detention 163 3,021,000 CY-DP01 Canyon Creek Regional Detention 174 3,930,000 CL-DP02 East Fork Clear Creek Regional Detention 163 4,858,000 Total Estimated Cost $27,612,200 * indicates the Clear/Clarks Creek Basin share (21.2%) of the estimated cost of a program of County-wide applicability Pierce County Public Works & Utilities ES-9
19 EXECUTIVE SUMMARY Table 9.4 ID Code LOW-PRIORITY RECOMMENDED PROJECTS Project Title Rating Score Estimated Cost RY-SWL01 62nd Avenue East Drainage Swale, Rody Creek 32 17,000 RY-CR01 Rody Creek at Pipeline Road & 96th Street East Culvert Replacement 65 19,000 PRG00-10 Flood Disclosure Statements on Property Titles ,400 * WO-CR02 RY-CR02 PH-PL01 SW-PL01 Woodland Creek at 80th Street East Culvert Replacement 88 27,000 Rody Creek at 98th Street East Culvert Replacement 89 31,000 92nd Ave East Storm Drainage Pipeline, Black Swamp Pothole ,000 84th Street East Pipeline Storm Drain Replacement, Swan Creek 99 74,000 RY-RD01 90th Street East at Rody Creek Raise Roadway 84 75,000 CY-FP01 Canyon Creek Driveway Culvert Replacement ,000 WO-CR01 Woodland Creek & 72nd Avenue East Culvert Replacement - 93rd Street East to 96th Street East ,000 SW-CR01 Swan Creek 80th Street E Culvert Replacement ,000 CY-RD02 CY-RD01 CY-AC01 PH-PL02 RY-DIV01 DU-DP01 104th Street East Road Raising & Culvert Replacement - East Fork of Canyon Creek , th Street East Road Raising - West Fork of Canyon Creek ,000 Canyon Creek Property Acquisition at 5600 block of 104th Street E , th Street East Regional Pipeline 85th Street East Diversion, Rody Creek Diru Creek Regional Detention , , ,977,000 Total Estimated Cost $4,607,400 * indicates the Clear/Clarks Creek Basin share of the estimated cost of a program of County-wide applicability Pierce County Public Works & Utilities ES-10
20 EXECUTIVE SUMMARY ES.4.2 Programmatic Recommendations Most of the recommended programs apply county-wide. Cost estimates for implementing the programs in the Clear/Clarks Creek Basin have been calculated based on a 21.2% share of the county-wide costs over ten years. A period of ten years was chosen for estimating costs although many programs are expected to continue indefinitely. Table ES-4 presents the programmatic recommendations. Estimated costs with an asterisk denote the Clear/Clarks Creek Basin share of estimated countywide costs for the program. ES.4.2 Capital Improvement Project Recommendations Tables ES-2, ES-3, and ES-4 summarize the recommended Capital Improvement Projects (CIP). Descriptions of each CIP are provided in Chapter 9, Basin Plan. TABLE ES-5 Recommended CIP Projects for Clear/Clarks Creek Basin By Project Type Subbasin Acquisition Streambank/Channel Stabilization Culvert Replacement Detention Pond Diversion Infiltration Pond Fish Passage Raise Roadway Pipeline Setback Levee Sedimentation Pond Stream Corridor Restoration Swale Vegetation Control Total Number of Projects Est. Cost Swan Creek $ 10,086,000 Squally Creek 1 1 $ 150,000 Clear Creek $ 16,158,000 Canyon Creek $ 10,250,000 Rody Creek $ 2,787,000 Diru Creek $ 4,243,000 Woodland Crk $ 5,221,000 Clarks Creek $ 4,127,000 Potholes $ 5,427,000 Roosevelt Ditch $ 4,276,000 Basin Total $ 65,595,000 Pierce County Public Works & Utilities ES-11
21 EXECUTIVE SUMMARY Table ES-6 CIP Solutions to Problems Cross-Reference RECOMMENDED CAPITAL IMPROVEMENTS HIGH-PRIORITY PROBLEMS ADDRESSED PH-IP th Street East Infiltration Pond PH-1 (Flooding, also Water Quality instream flows) CL-RST01 Clear Creek Stream Corridor Restoration CL-1 (Flooding), CL-16 (Water Quality) RY-RST01 Rody Creek Stream Corridor Restoration RY-16 (Habitat), RY-19 (Water Quality) PH-PL04 144th and 94th Avenue Pipeline PH-14 (Flooding), PH-15 (Flooding), PH- 18 (Flooding) SW-AC01 WO- RST01 Swan Creek at 112th Street Floodplain Storage/Headwaters Preservation Woodland Creek Stream Corridor Restoration SW-5 (Flooding), SW-10(Flooding), SW- 27 (Water Quality-Instream Flow), SW- 30 (Flooding) WO-23 (Water Quality, Habitat), WO-29 (Habitat), WO-30 (Habitat), WO-31 (Water Quality) CY-RST01 Canyon Creek Stream Corridor Restoration CY-25 (Water Quality, Habitat), CY-26 (Habitat) CK-RST01 Clarks Creek Stream Corridor Restoration CK-1 (Flooding), CK-12 (Water Quality), CK-13 (Water Quality, Habitat), CK-14 (Water Quality, Habitat), CK-16 (Flooding), CK-21 (Water Quality) RD-DP01 CL-AC01 Portland Avenue Regional Detention Facility, Roosevelt Ditch Area Clear Creek Floodplain Repetitive Loss Land Acquisition RD-7 (Flooding) CL-1 (Flooding) SW-DP01 Swan Creek Regional Detention Facility SW-3 (Habitat), SW-4 (Flooding), SW-6 (Flooding), SW-21 (Water Quality, Habitat), SW-22 (Water Quality, Habitat), SW-23 (Water Quality, Habitat), SW-30 (Flooding), SW-35 (Water Quality, Habitat), SW-36 (Water Quality), SW-37 (Water Quality) Pierce County Public Works & Utilities ES-12
22 EXECUTIVE SUMMARY MEDIUM-PRIORITY SW-SBS03 Swan Creek 64th Street East Culvert Outfall Repair SW-21 (Water Quality, Habitat), SW-23 (Water Quality, Habitat), RD-SWL01 20th Avenue East Drainage Swale, Roosevelt D RY-5 (Flooding), RY-6 (Flooding) CL-SBS03 CL-SBS04 DU-SBS01 RY-SBS01 Clear Creek Streambank Stabilization in vicinity of 49th Street Clear Creek Streambank Stabilization on West Fork Clear Creek Downstream of 64th Street E Diru Creek Streambank Stabilization at 72nd St East Rody Creek Streambank Stabilization at 72nd Street East CL-17 (Habitat, Water Quality), CL-21 (Habitat, Landslide) CL-17 (Habitat, Water Quality), CL-22 (Habitat, Water Quality) DU-11 (Landslide, Habitat, Water Quality) RY-14 (Habitat, Water Quality) CL-CR01 Clear Creek 88th Street E Culvert Replacement CL-5 (Flooding) CL-VC01 RY-SBS02 CK-SP01 Clear Creek at 104th Street E Vegetation Control Rody Creek Streambank Stabilization at 80th Street East Clarks Creek State Hatchery Sedimentation Basin Retrofit CL-SBS05 Clear Creek Streambank Stabilization 5000 block of Vickery Avenue East SW-SBS01 SQ-VC01 CL-SBS02 CY-SBS03 CY-SBS01 CY-SBS02 CK-PL01 CL-SBS01 CK-AC01 SW-SBS02 WO- SBS01 Swan Creek Streambank/Channel Stabilization at 72nd Street E Outfall Squally Creek at Pioneer Way E Vegetation Control Clear Creek Streambank Stabilization on East Fork Downstream of 72nd Street E Canyon Creek Streambank Stabilization on Reach Upstream of Second Canyon Road Crossing Canyon Creek Streambank Stabilization on Reach Downstream of 80th Street East Canyon Creek Streambank Stabilization on Reach Downstream of 72nd Street East 112th Street East Drainage Improvement (Woodland Elementary School) Clear Creek Streambank Stabilization on West Fork Downstream of 72nd Street E Clarks Creek Property Acquisition at 104th Street East Swan Creek Streambank/Channel Stabilization from 72nd Street E to 64th St E Woodland Creek Streambank/Channel Stabilization at 84th Street East CL-4 (Flooding, Water Quality) RY-3 (Water Quality, Habitat) CK-14 (Habitat, Water Quality), CK-15 (Habitat, Water Quality) CL-33 (Habitat, Water Quality) SW-3 (Habitat, Water Quality), SW-21 (Habitat, Water Quality), SW-35 (Habitat) SQ-4 (Habitat, Water Quality), SQ-6 (Flooding, Habitat, Water Quality) CL-17 (Habitat, Water Quality), CL-20 (Habitat, Water Quality) CY-20 (Habitat, Water Quality), CY-23 (Habitat, Water Quality) CY-18 (Habitat, Water Quality), CY-23 (Habitat, Water Quality) CY-22 (Habitat, Water Quality), CY-23 (Habitat, Water Quality) CK-9 (Flooding) CL-17 (Habitat, Water Quality), CL-10 (Habitat, Water Quality) CK-2 (Flooding) SW-4 (Habitat, Water Quality), SW-21 (Habitat, Water Quality) WO-24 (Habitat, Water Quality), WO-25 (Habitat, Water Quality), WO-26 (Habitat, Water Quality) Pierce County Public Works & Utilities ES-13
23 EXECUTIVE SUMMARY MEDIUM-PRIORITY - continued CY-SBS04 WO- SBS02 Canyon Creek Streambank Stabilization Downstream of Second Canyon Road Crossing Woodland Creek Streambank Stabilization at 80th Street E PH-PL05 Springfield Pothole Pipeline PH-7 (Flooding) CK-PL02 Fruitland Avenue Drainage Improvement - 104th Street E to 96th Street E, Clarks Creek CY-21 (Habitat, Water Quality), CY-23 (Habitat, Water Quality), WO-26 (Habitat, Water Quality), WO-27 (Habitat, Water Quality), CK-10 (Flooding) PH-PL th Street Pipeline, 135 th Street Pothole PH-3 & PH-4 (Flooding) CY-SL01 SW-SBS04 DU-RST01 RY-DP01 CY-DP02 PH-PL06 Canyon Creek 58th Avenue East Setback Levee Swan Creek Streambank Stabilization Downstream of 64th Street East Diru Creek Stream Corridor Restoration Downstream of Pioneer Way East Rody Creek Regional Detention Facility Expansion Canyon Creek 90th Street East Detention (D ) South Hill Pump Station Pipeline to Puyallup River CY-1 (Flooding), CY-5 (Flooding), CY-6 (Flooding) SW-21 (Habitat, Water Quality), SW-24 (Habitat, Water Quality), SW-35 (Habitat, Water Quality) DU-9 (Water Quality), DU-10 (Water Quality, Habitat) RY-14 (Water Quality, Habitat) CY-1 (Flooding), CY-6 (Flooding), CY-18 (Habitat, Water Quality) PH-23 (Flooding) WO-DP01 Woodland Avenue Flood Control Phase II WO-1 (Flooding), WO-2 (Flooding), WO- 5 (Flooding), WO-24 (Habitat, Water Quality, WO-25 (Habitat, Water Quality), WO-26 (Habitat, Water Quality) CL-DP01 West Fork Clear Creek Regional Detention CL-5 (Flooding), CL-17 (Habitat, Water Quality, Flooding), CL-19 (Habitat, Water Quality), CL-21 (Habitat, Water Quality), CL-22 (Habitat, Water Quality) CY-DP01 Canyon Creek Regional Detention CY-1 (Flooding), CY-6 (Flooding), CY-18 (Habitat, Water Quality) CL-DP02 East Fork Clear Creek Regional Detention CL-17 (Habitat, Water Quality, Flooding), CL-20 (Habitat, Water Quality), CL-21 (Habitat, Water Quality), CL-22 (Habitat, Water Quality) Pierce County Public Works & Utilities ES-14
24 EXECUTIVE SUMMARY LOW-PRIORITY RY-SWL01 62nd Avenue East Drainage Swale, Rody Creek RY-5 (Flooding), RY-6 (Flooding) RY-CR01 WO-CR02 RY-CR02 PH-PL01 SW-PL01 Rody Creek at Pipeline Road & 96th Street East Culvert Replacement Woodland Creek at 80th Street East Culvert Replacement Rody Creek at 98th Street East Culvert Replacement 92nd Ave East Storm Drainage Pipeline, Black Swamp Pothole 84th Street East Pipeline Storm Drain Replacement, Swan Creek RY-7 (Flooding) WO-8 (Flooding, Habitat) RY-8 (Flooding) PH-6 (Flooding) SW-16 (Flooding) RY-RD01 90th Street East at Rody Creek Raise Roadway RY-17 (Flooding) CY-FP01 WO-CR01 Canyon Creek Driveway Culvert Replacement at Pioneer Way East Woodland Creek & 72nd Avenue East Culvert Replacement - 93rd Street East to 96th Street East CY-28 (Habitat) WO-6 (Flooding) SW-CR01 Swan Creek 80th Street E Culvert Replacement SW-1 (Flooding, Habitat) CY-RD02 CY-RD01 104th Street East Road Raising & Culvert Replacement - East Fork of Canyon Creek 116th Street East Road Raising - West Fork of Canyon Creek CY-AC01 Canyon Creek Property Acquisition at 5600 block of 104th Street E CY-10 (Flooding) CY-3 (Flooding) CY-30 (Flooding) PH-PL02 156th Street East Regional Pipeline PH-15 (Flooding) DU-DP01 Diru Creek Regional Detention DU-9 (Habitat, Water Quality Pierce County Public Works & Utilities ES-15
25 EXECUTIVE SUMMARY ES.4.3 Implementation Strategy Implementation of the recommended actions will generally follow the prioritization groupings of high, medium, and low and a logical order of sequencing. To ensure that the full benefits of all projects are realized, implementation will not follow the exact sequence of the first project to the last project in the High category, followed by the first action in the Medium category, and so forth. Several factors exist that will result in implementation of actions that are not in the exact sequence as depicted in the projects and programs prioritized by the benefit and ranked by cost table. These factors include the following: Available funds Contingent projects 2 Available staff and professional service needs Cooperation from private landowners The best implementer may be an agency other than Pierce County Public Works and Utilities New information, regulations or emerging issues Coordination with other agencies and/or jurisdictions Economic Development Criteria Implementing projects and programs recommended in the Basin Plan is expected to reduce flood hazards, and preserve or protect water quality and floodplain habitat. Collectively and individually, these projects are aimed at protecting Pierce County s quality of life. Projects and programs in the Basin Plan will: Afford resource protection as the community develops Preserve, enhance or protect natural floodplain functions Balance structural and nonstructural approaches Reduce potential County environmental liabilities Help achieve environmental compliance and long term sustainability Collectively, these attributes help make Pierce County a livable community where quality of life and natural amenities and functions offer economic incentives to businesses and individuals to locate or stay in the County. 2 Contingent projects include projects such as stream restoration projects intended to reduce flood hazards and improve aquatic habitat, and culvert replacement projects intended to improve fish passage. These projects will provide their full benefit after all downstream fish passage barriers are removed, and should be sequenced accordingly. Pierce County Public Works & Utilities ES-16
26 EXECUTIVE SUMMARY In addition to the preceding factors, Water Programs will consider the following criteria in developing its annual proposed capital facilities plan updates: Is the project located in an employment center zone (or handle flow from those zones)? Is the project located in another type of commercial zone (or handle flow from those zones)? Will the project reduce permitting timelines for industrial/commercial projects? Will the project assure access to an employment center via road and /or rail? Will the project increase the supply of developable property? Will the project reduce overall development costs? Are there partners willing to contribute to the development costs of the project? Does the project allow / provide for land development? In light of these and other factors, following action on the Basin Plan, Pierce County will develop an implementation strategy designed to sequence, schedule, and assign resources for the various recommended actions. This implementation strategy will be developed in collaboration and coordination with other potential implementers and in consideration of available financial and staff resources. The implementation strategy will include performance measurements and provide for periodic evaluation of progress. Pierce County Public Works & Utilities ES-17
27 EXECUTIVE SUMMARY Pierce County Public Works & Utilities ES-18
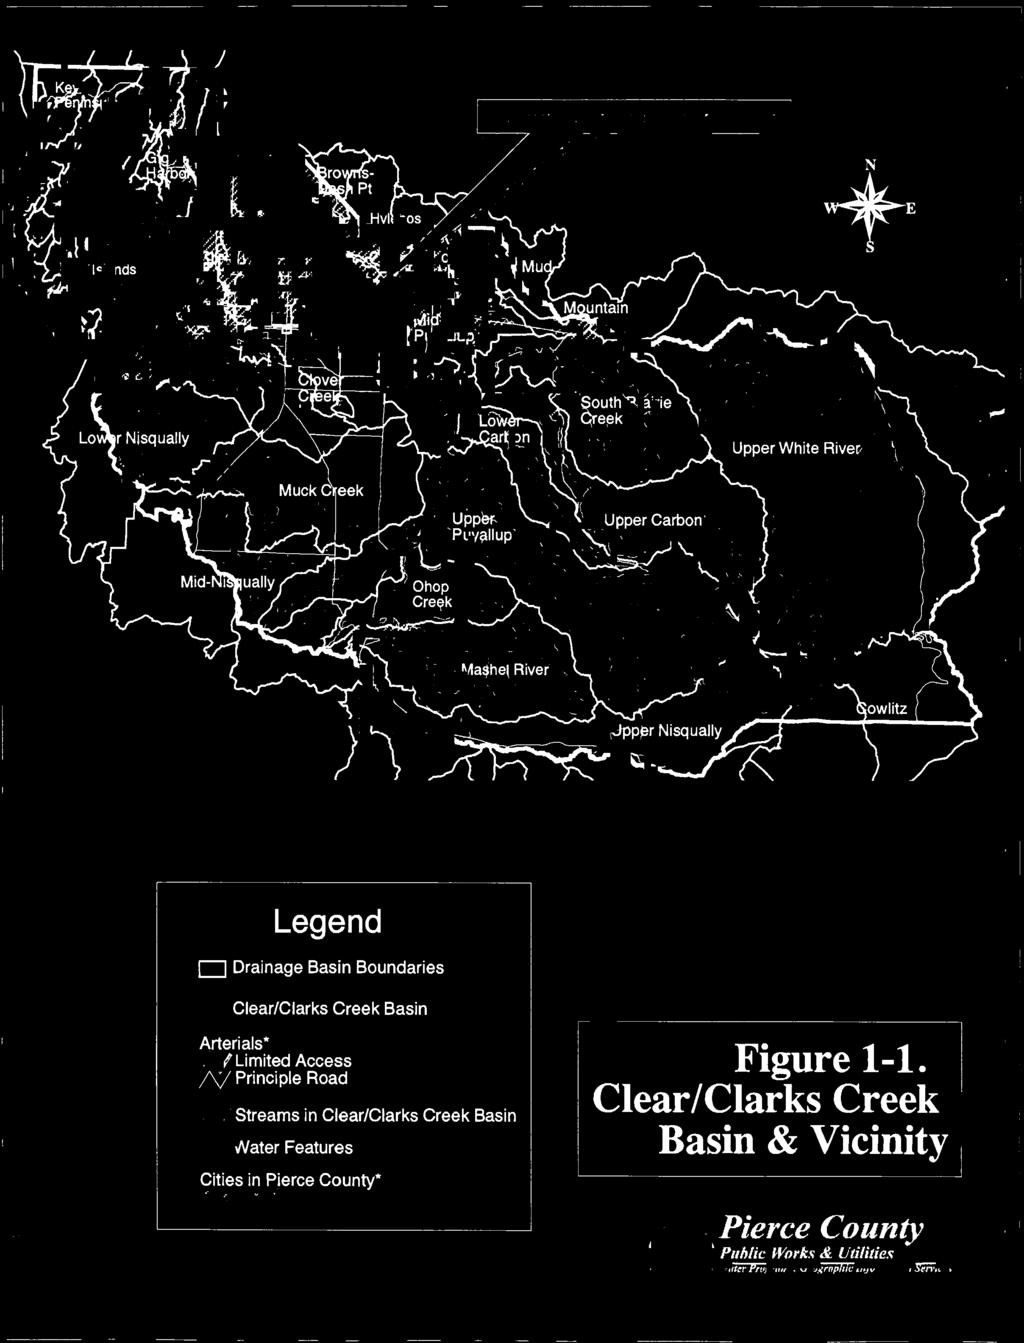
28 INTRODUCTION CHAPTER ONE Introduction Pierce County Public Works and Utilities - (Water Programs), is responsible for surface water management in unincorporated Pierce County. In carrying out this responsibility, Water Programs plans, designs, secures permits for, builds and maintains storm drainage and surface water management facilities. Water Programs also identifies non-structural solutions to surface water problems such as monitoring needs, enforcement, regulatory changes, or services. As one agency of Pierce County government, Water Programs advises and works with other agencies, other jurisdictions, and with private interests to ensure that storm drainage and surface water issues are dealt with by appropriate parties as close as possible to the source of the problem. Related responsibilities include compliance with the stormwater quality requirements of the federal Clean Water Act, the County s Stormwater National Pollution Discharge Elimination System (NPDES) Permit, and the habitat protection requirements of the federal Endangered Species Act. Other related responsibilities consist of river levee maintenance, stream gauging, water quality monitoring, gathering of rainfall data, emergency response during floods, water supply planning and public information. Fees paid by property owners in unincorporated Pierce County and grant funds pay for these facilities and services. 1.1 Basin Planning Program Water Programs is preparing a series of basin plans to identify and prioritize facilities improvements projects and other Water Program activities in individual drainage basins. Basin plans comprehensively tackle flooding, water quality and habitat aspects of surface water management in the major stream systems of the non-federal lands within the County. The basin plans will update the county-wide Pierce County Storm Drainage and Surface Water Management Plan (Montgomery Engineers Inc., 1991)(a.k.a., 1991 Update) by identifying and addressing the flooding, water quality and stream habitat problems in a particular drainage basin in more detail than was possible in They incorporate the requirements of major federal, State and Pierce County laws, regulations and policies enacted since the 1991 Plan, such as the State Growth Management Act, NPDES requirements of the federal Clean Water Act, and the fish listings under the federal Endangered Species Act (ESA). The basin plans will be implemented primarily through Water Programs activities. However, Water Programs will share information from basin plans to convey issues and needs that might most effectively be dealt with by other agencies and jurisdictions. Figure 1-1 shows the location of the Clear/Clarks Creek Basin relative to the other 25 drainage basins in the County. The Clover Creek Basin, Mid-Puyallup Basin and Hylebos Basin lie adjacent to the Clear/Clarks Creek Basin. Of these basins, basins plans have been prepared for the Muck Creek Basin, Clover Creek Basin, Gig Harbor Basin and Mid-Puyallup Basin. Other basin plans will follow. Pierce County Public Works & Utilities 1-1


29
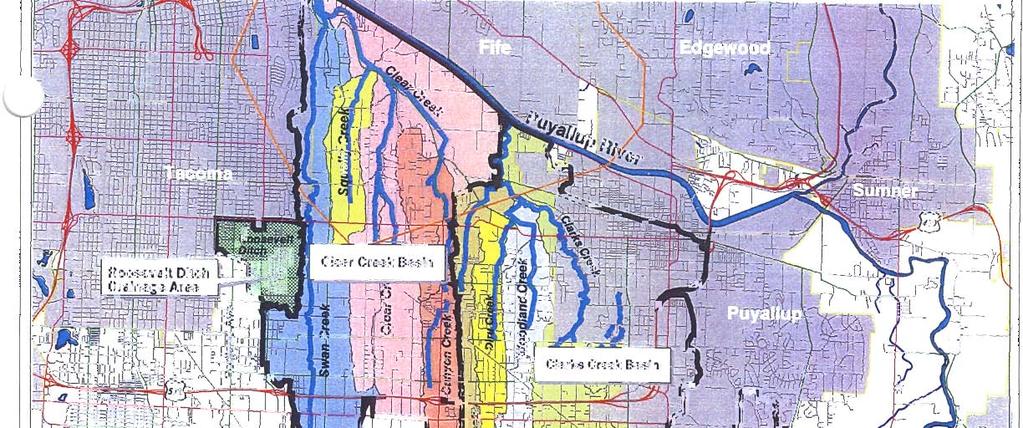
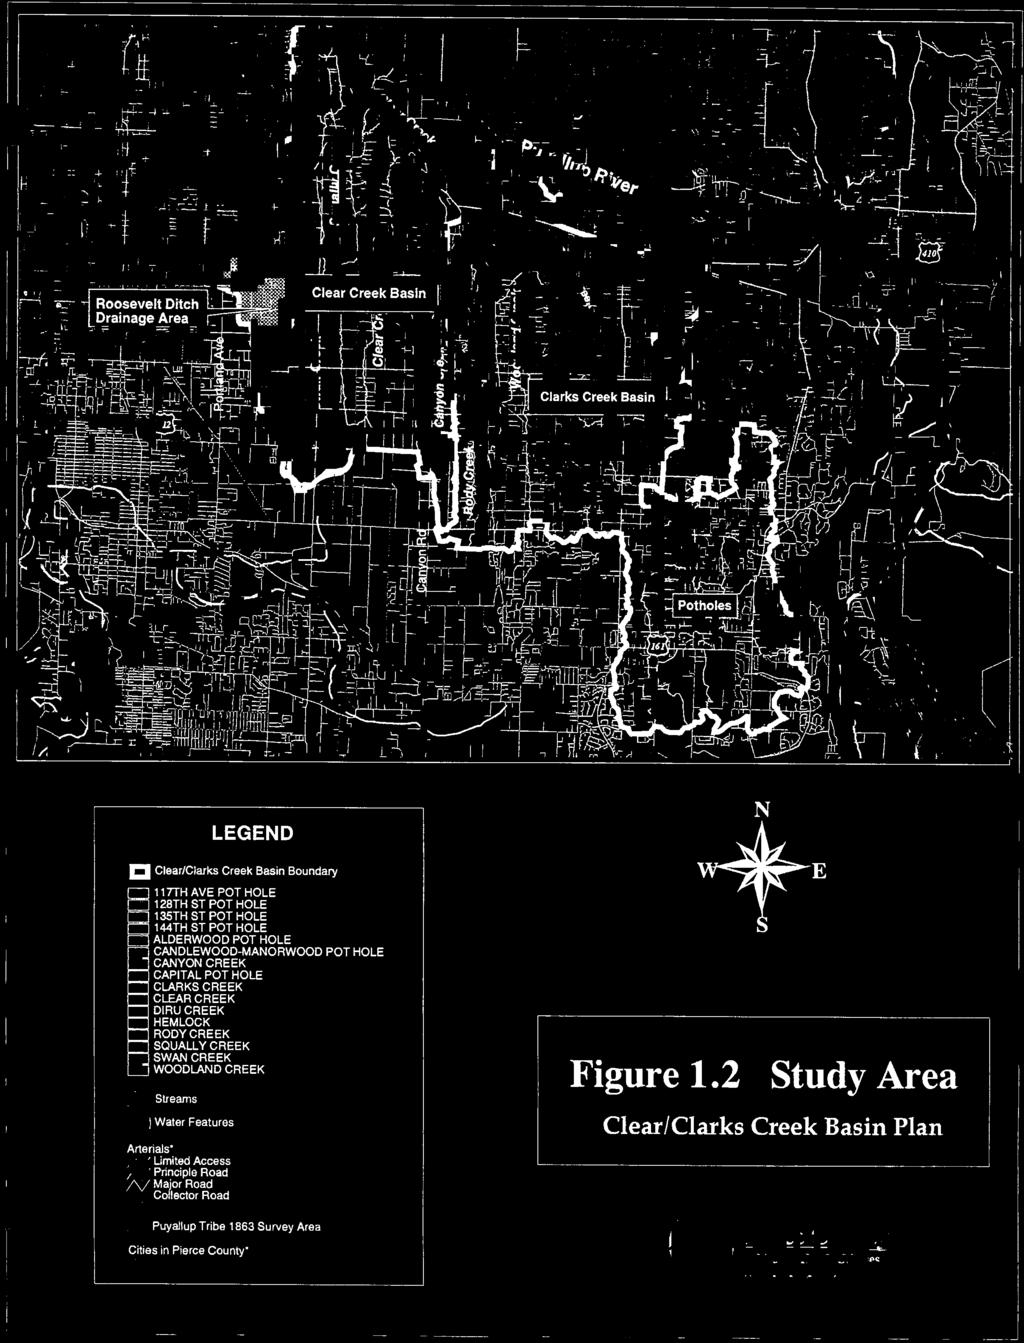
30 INTRODUCTION Basin plans identify existing conditions that affect storm drainage and surface water, forecast future drainage conditions, identify potential solutions, and evaluate alternatives to the degree that they achieve objectives or create probable significant environmental impacts. The basin plans concentrate on remedies for frequently flooded areas, water quality problems, fish and wildlife habitat protection, and other surface water management concerns in the unincorporated parts of Pierce County. Drainage facilities within cities and towns, national forests, parks, and military bases are not within the scope of basin plans unless they affect drainage conditions in unincorporated areas. Basin plans are used to develop capital improvement, maintenance and repair, property acquisition, and program schedules and budgets. The planning process is divided into three phases: Phase 1 is the basin characterization phase. It consists of inventorying and documenting existing conditions, such as flooding, water quality and habitat problems; existing storm drainage and surface water management facilities; regulatory environment; existing and future land use; stream flow characteristics; stream reaches and associated wetlands; other critical areas; the creek s ability to support various fish species; and the fish species present. Phase 2 is the plan development and adoption phase. It builds on the findings of Phase 1 by correcting information, performing hydrologic and hydraulic analyses based on planned future conditions, filling information gaps, investigating problems, identifying solutions, and recommending solutions. This document is the culmination of Phase 2. Phase 3 is the implementation, monitoring and plan update phase. 1.2 Clear/Clarks Creek Basin Plan The Clear/Clarks Creek Basin Plan is the storm drainage and surface water management plan specific to the Clear/Clarks Creek Basin. It presents the results of the Clear/Clarks Creek Basin planning process. The Basin Plan includes an updated Characterization Report from Phase 1, as chapters one through five. Added are chapters six, seven, and eight, which document the analysis of problems, such as the results of hydrologic and hydraulic modeling used to estimate the amount of stormwater and stormwater volume peaks where flooding or other problems occur. Chapter Nine recommends capital improvement projects and programmatic solutions (nonstructural measures, such as recommendations to amend certain regulations) to solve existing and projected future stormwater problems Study Area The Clear/Clarks Creek Basin drains approximately 32.9 square miles (21,038 acres) of northcentral Pierce County, of which 27.4 square miles (83 percent) exist within unincorporated Pierce County. The remaining 5.5 square miles (17 percent) lie in the cities of Tacoma and Puyallup. Pierce County Public Works & Utilities 1-3


31
32 INTRODUCTION The Clear/Clarks Creek Basin is part of Washington State Water Resource Inventory Area (WRIA) 10, the Puyallup-White River Basin. The Basin is an amalgamation of four contiguous drainage basins, knit together for cost-efficiency and in consideration of interconnecting drainage improvements. The four basins are as follows: Roosevelt Ditch Drainage Area, areas draining to Roosevelt Ditch Clear Creek Drainage Basin, areas draining to Clear Creek Clarks Creek Drainage Basin, areas draining to Clarks Creek Potholes Drainage Area, areas draining to the potholes on South Hill Clear and Clarks Creeks generally flow north before discharging into the Puyallup River at points east of the City of Tacoma. Clear Creek drains the western portion of the Basin. Clarks Creek drains the eastern portion of the Basin, including a portion of the City of Puyallup. The major tributaries to Clear Creek include Swan Creek, Squally Creek, and Canyon Creek. The major tributaries to Clarks Creek include Rody Creek, Meeker Ditch, Diru Creek, and Woodland Creek. The Clear/Clarks Creek Basin also includes the Pothole area, an 8.3-square-mile originally internally drained area on South Hill. Roosevelt Ditch Drainage Clear Creek Basin Clarks Creek Basin Swan Creek Squally Creek Clear Creek Canyon Creek Rody Creek Diru Creek Woodland Creek Clarks Creek Potholes Afdem Black Swamp Capital Heritage Glen 128 th Street Meridian Street 135 th Street 117 th Street Candlewood-Manorwood Tip Top Lower 144 th Street Alderwood Upper 144 th Street Springfield South Central 110 th Avenue Pierce County Public Works & Utilities 1-5
33 INTRODUCTION Description of Subbasins Subbasins are the planning units of the basin plans. They are derived by dividing the stream basin into subbasins, then further dividing the subbasins into smaller and more manageable subbasins, generally on the basis of stream reaches. The division is one of the first steps in the basin planning process. Although for this study the Basin is referred to as the Clear/Clarks Creek Basin, for planning purposes it includes the two creek drainage basins, the potholes area of South Hill, and the Roosevelt Ditch drainage area. These drainages constitute the major subbasins of the planning area. First, each basin in the Clear/Clarks Creek Basin was divided into subbasins: Clear Creek Basin was divided into four subbasins: Swan Creek, Squally Creek, Clear Creek, and Canyon Creek. Clarks Creek Basin was divided into four subbasins: Rody Creek (sometimes referred to as unnamed tributary to Clarks Creek ), Diru Creek, Woodland Creek, and Clarks Creek. Pothole Basin was divided into 16 named subbasins; each one a separate pothole area. Next, each of the eight stream subbasins of Clear Creek and Clarks Creeks were divided into 31 smaller, more manageable, planning units based on stream reaches as described in Section 4.7, Aquatic and Riparian Habitat. Some of the Pothole subbasin boundaries and names were based on information from the South Hill Drainage Improvements Report (Pierce County, 2001). The overall Clear/Clarks Creek Basin boundary (including the Pothole areas) delineation came from Pierce County and was not modified as part of this study Key Elements of the Basin Plan Key elements addressed in the Clear/Clarks Creek Basin Plan are: Existing Conditions Characterization of topography, soils, current and future flow volumes, water quality, habitat and land cover factors influencing surface water runoff Problems Flooding due to surface water and/or groundwater Surface water quality impairment related to stormwater runoff Stream and riparian habitat degradation due to stormwater Impacts Loss of beneficial uses (recreation, water supply, habitat, and drinking water, etc.) Negative effects of stormwater runoff on the ability to meet federal, State and local regulations Property damage from flooding, inadequate drainage or high groundwater Threats to public health and safety (road inundation, impaired surface water quality and drinking water quality, etc.) Pierce County Public Works & Utilities 1-6
34 INTRODUCTION Solutions Capital projects (e.g., flood control facilities, creek and watershed restoration, etc., related to storm drainage) Direct or indirect control of land use impacts (e.g., zoning, buffers, and stormwater facility design standards, etc.) Basin-specific development standards (e.g., discharge rates and volume control) Storm drainage system maintenance activities Additional research or on-going monitoring Others as appropriate 1.3 Statement of Purpose The purpose of the Clear/Clarks Creek Basin Plan is to establish the actions Pierce County will take and what is needed to reduce flood hazards and other storm drainage problems, protect water quality, and to protect fish and wildlife habitat in the Clear/Clarks Creek drainage basin. Recommended actions reflect the physical characteristics of the Basin; the laws, policies and regulations that apply to surface water management in Pierce County; the preferences of citizens in the County and in the Clear/Clarks Creek Basin; and the character of existing land use and planned growth as set out in the Comprehensive Plan for Pierce County, Washington. 1.4 Goals and Objectives Water Programs drew up general goals and objectives for basin plans as presented in Table 1-1 to promote consistency between basin plans. The goals and objectives form the base evaluation criteria for selection of recommended facilities, policies, and surface water management program modifications from among the various alternatives. They also permit the facilities recommended by basin plans to be compared and ranked with one another. Pierce County Public Works & Utilities 1-7
35 INTRODUCTION Goal Reduce flood hazards Improve fish & wildlife habitat Improve water quality Demonstrate coordinated & responsible use of public resources TABLE 1-1 Goals of the Clear/Clarks Creek Basin Plan Objectives Incidents of property loss and repeat damage are reduced. Streams will not be adversely impacted by flood events. Pierce County standing under the Federal Emergency Management Agency Community Rating System is improved. New development is located outside of flood-prone area. Number of stream miles available for wild, native fish populations is increased. Population numbers of species listed as endangered or threatened under the Federal Endangered Species Act (ESA) are maintained or increased. Quality and quantity of available wetland, riparian, and upland habitat is improved. State Surface Water Quality Standards (WAC a) are met or exceeded. Number of impaired (303d listed) waterbodies is reduced. Pierce County is in compliance with its NPDES permit for stormwater by meeting permit terms and conditions to the maximum extent practicable. Risk of groundwater contamination is reduced. Rates of erosion are reduced. Cost of maintaining stormwater facilities is reduced. Project value is favorable when measured against costs and benefits. Polls demonstrate that public awareness of flooding, habitat, and water quality issues has increased. Monitoring and enforcement programs demonstrate an increase in services per dollar spent. Basin plan implementation also implements elements of other Pierce County plans. Other agencies and jurisdictions use basin plan findings in planning their activities. Influence location & methods for new development New development in flood-prone, riparian, or significant habitat areas is prohibited. Low Impact Development techniques are widely used. Effective BMPs are identified and widely used. Sources: Guidance for Basin Planning, Pierce County Water Programs, June 2000., Pierce County Public Works & Utilities, Water Programs; Pierce County Storm Drainage and Surface Water Management Advisory Board, June 2005 Pierce County Public Works & Utilities 1-8
36 APPLICABLE PROGRAM, POLICIES & REGS CHAPTER TWO Applicable Programs, Policies, and Regulations Numerous federal, State of Washington and local regulations, laws, policies and programs affect how stormwater and surface water are managed in unincorporated Pierce County. This chapter describes those pertinent to the Clear/Clarks Creek Basin with an emphasis on coordination with other programs and consistency with adopted policies and plans. Chapter Two presents federal regulations and programs first followed by those of the State of Washington (State), Pierce County (County), and other agencies respectively. 2.1 Federal Regulations, Policies and Programs Clean Water Act National Pollutant Discharge Elimination System (NPDES) In 1987, amendments to the Federal Clean Water Act (CWA) required the Environmental Protection Agency (EPA) to promulgate regulations for storm water discharges. EPA defined certain stormwater discharges as point source discharges subject to federal regulations under the National Pollutant Discharge Elimination System (NPDES) Permit Program. Two broad areas were created as follows: 1. "Stormwater Discharges Associated with Industrial Activity" 2. "Municipal Separate Storm Sewer Systems" in two phases. Phase I applies to municipalities with populations greater than 100,000 people. Phase II requirements, expected to be implemented by 2006, apply to municipalities with populations of 10,000 people or more and certain urban areas. EPA delegated responsibility for implementation of the NPDES permit program to the Washington State Department of Ecology (Ecology). Ecology issued the Phase I NPDES permit for the South Puget Sound Water Quality Management Area (which includes Pierce County) in July It was administratively extended in 2000 pending development of a Phase II permit. The NPDES stormwater permit requires that permit holders control pollutants in stormwater to the maximum extent practicable, primarily by implementing a stormwater management program, a functional component of which is the basin plans. Ecology approved the Pierce County s Stormwater Management Program in Required elements include: A program to control runoff from new development, redevelopment, and construction sites Treatment and source control measures for existing commercial and residential areas An operation and maintenance program for new and existing stormwater facilities Practices for maintaining public streets and highways to reduce stormwater runoff impacts Pierce County Public Works & Utilities 2-1
37 APPLICABLE PROGRAM, POLICIES & REGS A program to include water quality considerations in flood management projects A program to reduce pollutants from pesticide and fertilizer use A program to detect, remove, and prevent illicit discharges to the municipal separate storm sewer system A program to reduce stormwater pollution from industrial facilities that discharge into the separate storm sewer system. An educational program for residents, businesses, industries, construction contractors, government employees, and others A monitoring plan to determine the effectiveness of program activities Reporting requirements Coordination among jurisdictions sharing water bodies Effect of the Current Stormwater NPDES Permit on the Clear/Clarks Creek Basin Plan Recommendations of the basin plan must adhere to the County s Stormwater NPDES Permit requirements cited above and provisions of the Pierce County Stormwater Management Plan. For a description of inter-jurisdictional coordination, see Chapter Three. Chapter Four describes existing water quality conditions. Chapter Six analyzes water quality problems and presents alternative solutions. Chapter Nine contains the recommendations for addressing water quality problems most cost-effectively. Section 303(d) List and Total Maximum Daily Loads (TMDLs) Section 303(a, b, and c) of the Clean Water Act requires that states establish standards to protect the quality of the waters of the United States. Ecology classified all major bodies of water in Washington based on their current or potential beneficial uses and established a set of water quality standards for each class. Section 303(d) of the CWA requires Ecology to prepare a list of waterbodies that are not meeting, or will not meet water quality standards, after application of the required technology-based effluent limits. Ecology submitted its candidate Section 303(d) list for 1998 to EPA in June Clear Creek, Clarks Creek, Swan Creek, and Diru Creek were on the list as water bodies that do not meet the standards (for additional information, see Chapter Four, Existing Conditions, Water Quality ). If a waterbody is not in compliance with standards for a particular pollutant, the CWA requires that a total maximum daily load (TMDL) of the pollutant be calculated. The TMDL is the maximum amount of the pollutant that can be discharged to the waterbody without violating the water quality standard for the pollutant. Limits for all pollutant sources discharging to the water body are adjusted downward until the TMDL can be met. Effect of 303(d) listings and TMDLs on the Clear/Clarks Creek Basin Plan The timing of activities has implications for basin planning. Pierce County s NPDES stormwater permit requires that the stormwater management program be amended to take into account TMDLs within 4 months of their promulgation. If a basin contains a water body that is on the Pierce County Public Works & Utilities 2-2
38 APPLICABLE PROGRAM, POLICIES & REGS Section 303(d) list but has not yet had a TMDL calculated, then the basin planning effort should anticipate the TMDL and focus on water quality control measures that address the listed pollutant(s). A TMDL for fecal coliform bacteria is being developed by the City of Puyallup as part of their Clarks Creek Pollution Reduction project. As of November 2003, monitoring has been completed, but no TMDL has been calculated. Nevertheless, recommendations for the Clarks Creek Basin should contain various measures to minimize the likelihood of fecal coliform in stormwater runoff from County drainage areas. Capital improvement projects and other control measures recommended for the drainage areas of streams identified in the (d) list should be designed with the objective of removing the stream and listed parameter from the 303(d) list. Section 404 Wetland Fill Permits Section 404 of the CWA regulates placement of fill in waters of the United States. For the purposes of Section 404, waters of the United States are defined as wetlands adjacent to streams with flow greater than five (5) cubic feet per second and isolated wetlands greater than one acre that are hydraulically connected to regulated streams. Storm drainage projects that involve filling or work in small areas of wetlands may be permitted under one of several nationwide general permits. An individual permit, subject to a broader level of review, must be obtained for projects that that exceed the limits for nationwide permits. Section 404 is administered by the U.S. Army Corps of Engineers (Corps); the Corps Seattle District is responsible for issuing Section 404 permits in Pierce County. Because the goal of Section 404 is to avoid any net loss of wetlands, some of the projects identified in Pierce County s 1991 Plan have proven more costly to build than estimated. In general, capital projects that adversely effect wetlands should be avoided. Effect of Section 404 Regulations on the Clear/Clarks Creek Basin Plan Wetland protections argue for several basin plan approaches. First, wherever possible wetlands can be acquired to conserve the natural stormwater runoff and flood storage capacities they provide. Second, the cost estimates of future storm drainage facilities should include the costs of compensatory mitigation. Third, basin plans can identify new programs or program revisions designed to protect existing wetlands or create wetlands. Fourth, basin plan recommendations can be prioritized in part upon the extent to which wetland protection and enhancement can be achieved Endangered Species Act The Endangered Species Act (ESA) directs the U.S. Fish and Wildlife Service (USFWS) and the National Oceanic and Atmospheric Administration (NOAA) Fisheries 1 to promulgate a list of endangered and threatened species and designate critical habitat for the listed species. Listed species with the greatest potential to affect surface water management in Pierce County are the chinook salmon (listed as threatened in March 1999) and the bull trout (listed as threatened in 1 NOAA Fisheries was previously called the National Marine Fisheries Service (NMFS). Pierce County Public Works & Utilities 2-3
39 APPLICABLE PROGRAM, POLICIES & REGS October 1999). NOAA Fisheries has indicated that additional salmonid species may be listed in the next few years. Chinook salmon are found in the Clear/Clarks Creek Basin (see Section 4.7). Section 9 of the ESA prohibits taking of endangered species. To take means to harass, harm, pursue, hunt, shoot, wound, kill, trap, capture, or collect, or to attempt to engage in any such conduct. The regulation explains that harm may include significant habitat modification where it actually kills or injures wildlife by significantly impairing essential behavioral patterns, including breeding, feeding, or sheltering. If a proposed action is federally funded, or if it requires a permit from a federal agency, and if it could have an effect on a listed species, then Section 7 of the ESA requires the involved federal agency to consult with USFWS or NOAA Fisheries. After consultation, USFWS or NOAA Fisheries issues a biological opinion regarding the effects of the action. If USFWS or NOAA Fisheries finds that the action could jeopardize the continued existence of the species, the action cannot be permitted. If USFWS or NOAA Fisheries finds that the continued existence of the species is not jeopardized, then one of the agencies will issue an Incidental Take Statement and allow the action to proceed. Section 4(d) of the ESA requires USFWS and NOAA Fisheries to adopt regulations as necessary to conserve the species listed as threatened. USFWS typically applies the Section 9 take prohibitions directly to threatened species. NOAA Fisheries typically promulgates 4(d) rules that identify specific activities that can be conducted without constituting an unlawful take of the threatened species. Pierce County has policies and programs that help to preserve and restore salmon habitat. The County is implementing early actions to preserve and restore salmonid habitat in coordination with King and Snohomish Counties. NOAA Fisheries has approved a set of transportation maintenance procedures that if followed protect transportation maintenance projects from liability under ESA. Other early actions include culvert replacements to improve fish passage and restoration and acquisition of key habitats. Effect of ESA on the Clear/Clarks Creek Basin Plan The salmonid listings have a broad effect on storm drainage and surface water management plans. Water quantity and water quality, as crucial features of fish habitat affected by the ways of solving flooding and storm drainage problems, must be addressed to protect listed species. Coordination with the varied agencies working on fish habitat initiatives should be reflected in recommended solutions to prevent overlap or duplication of effort National Flood Insurance Program In 1968, the U.S. Congress initiated the National Flood Insurance Program (NFIP) (Chapter 44 CFR) under the National Flood Insurance Act to relieve the burden of disaster relief on the national treasury and state and local tax bases. The NFIP is administered by the Federal Insurance Administration (FIA), which is part of the Federal Emergency Management Agency (FEMA). The NFIP makes available affordable flood insurance to communities that adopt approved floodplain management regulations. Communities that do not participate in the NFIP do qualify for certain flood disaster relief. FEMA s Flood Insurance Rate Maps (FIRMs) form the basis for critical area zoning for flood hazards. Pierce County Public Works & Utilities 2-4
40 APPLICABLE PROGRAM, POLICIES & REGS Pierce County participates in the NFIP. Flood hazard management regulations are codified in Title 17A.50 of the County Code and criteria and procedures are laid out in Chapter Nine of the Pierce County Stormwater Management and Site Development Manual. Federally subsidized flood insurance is available to local residents. To continue coverage, the County must remain in the NFIP and maintain minimum floodplain management regulations. FEMA requires a certification letter for any revisions to a FIRM. Certification activities include stream channel modifications, installation of culverts, and bridge construction. Community Rating System (CRS) As a reward for communities willing to do more than meet minimum NFIP requirements by taking actions to minimize flood losses and promote public awareness of flood hazards, FEMA created the Community Rating System (CRS). Community participation in the CRS is voluntary. The CRS offers reduced insurance rates based upon the class rating of a community. The CRS contains ten classes. Class 1 gives the greatest insurance premium reduction. A Class 10 community receives no premium reduction. Pierce County was the first county in the nation to earn a Class 5 rating. Effect of the NFIP and the CRS on the Clear/Clarks Creek Basin Plan Basin plans serve as part of the flood hazard mitigation plan for Pierce County. To serve in meeting the prerequisites for a Class 4 rating, the Clear/Clarks Creek Basin Plan has been developed to meet or exceed the following criteria: Floodplain Management Planning Elements - CRS Planning Steps Organize Use a steering committee of department staff Involve the public Engage people living and working in floodplains to identify problems, community goals and alternatives that will solve problems Coordinate with other local governments in the planning area, state and federal agencies, Indian tribes, and other Pierce County departments and programs Assess the hazard(s) Assess the problem(s) Set goals Review possible activities Draft an action plan Adopt the plan Implement the plan, evaluate it periodically, and revise it as needed to keep it current and effective Pierce County Public Works & Utilities 2-5
41 APPLICABLE PROGRAM, POLICIES & REGS Federal Laws Law or Regulation TABLE 2-1 Federal and State Laws and Regulations and Clear/Clarks Creek Basin Plan Application to the Clear/Clarks Creek Basin Clean Water Act. Section 402 National Pollutant Discharge Elimination System (NPDES) Clean Water Act. Section 303(d) Total Maximum Daily Load (TMDL) Listing Clean Water Act. Section 404 Permit Requirements for Wetland Filling Endangered Species Act Pierce County Stormwater NPDES Permit, consistency with coordination requirement, Must consider ways of reducing stormwater contributions to pollutant loads Pierce County provides direction for basin plans to avoid recommendations that would have negative impacts on wetlands Consistency between the basin plan & Tri-County Endangered Species Act Response Implementation of the Puyallup WRIA Conservation Plan National Flood Insurance Program Acknowledgement of the programs initiated with the Consistency with NFIP objectives and CRS standard Pierce County Flood Hazard Management Code State Laws, Plans & Regulations Water Quality Standards Puget Sound Water Quality Management Plan Growth Management Act State Environmental Policy Act Shoreline Management Act State Hydraulic Code Watershed Management Act The Non-Point Rule Analyze water quality and develop projects & programs toward maintaining water quality standards and anti-degradation rule Drainage development standards; Stormwater Management Manual; Stormwater Pollution Control Manual Critical areas regulations, consistency between comprehensive plans and capital improvement plans required Environmental review for basin plan and individual projects Pierce County Shoreline Master Program (adopted as WAC) Hydraulic Project approvals required for in-stream work N/A Lower Puyallup WRIA Watershed Action Plan Source: Pierce County Water Programs Settlement Agreement with the Puyallup Tribe In 1989, the U.S. Congress passed the Agreement between the Puyallup Tribe of Indians, Local Governments in Pierce County, the State of Washington, the United States of America, and certain private property owners (Settlement Agreement). Pierce County signed the Settlement Agreement in In the Settlement Agreement, the County agreed that, The Tribe s treaty Pierce County Public Works & Utilities 2-6
42 APPLICABLE PROGRAM, POLICIES & REGS fishery must be managed to achieve increased salmon and steelhead production, including protection of necessary habitat, while providing for residential, commercial, industrial and other development, natural resource use, and protection of lives and property from flooding. The County promised to consult with the Tribe when amending land use and resource plans lying within the 1873 Survey Area (See Figure 1.2, Study Area). Consultation consists of notifying the Tribe of the proposal, giving an opportunity for consultation and discussion, and making good faith efforts to accommodate the concerns of the Tribe in rendering its decision. Effect of the Settlement Agreement on the Clear/Clarks Creek Basin Plan The Settlement Agreement underscores the basin plan objective of protecting and enhancing fish habitat through stormwater management activities. It imposes an obligation for the parties to consult with one another as set out in Document 7 of the Settlement Agreement. 2.2 State Regulations, Plans and Permits State Water Quality Standards Washington Administrative Code (WAC) A and affect the discharge of stormwater to surface water and groundwater, respectively, by establishing water quality standards for each of the different classes of water and articulating the federal anti-degradation policy. WAC also calls for designation of special groundwater protection areas based on unique characteristics (e.g., aquifer recharge areas, wellhead protection areas, or sole source aquifers). Chapter Four describes the water quality standards and how well the Mid-Puyallup Basin streams achieve the standards. In July 2003, Washington adopted a new set of water quality standards. The new standards cannot be used until they are approved by EPA, which is expected in Updated rules establish standards for temperature to protect temperature-sensitive fish, such as bull trout and Dolly Varden. A new indicator (enterococci) will be used to measure the amount of bacteria in marine waters that are not used for shellfish harvesting. New values for ammonia in waters without salmon species have been added. Ecology will classify fresh waters by actual use (such as fish habitat, swimming and water supply), rather than by class (AA, A, B, C and Lake classes), to make the standards less complicated to interpret and provide future flexibility as the uses of a waterbody evolve. Effect of Water Quality Standards on the Clear/Clarks Creek Basin Plan Storm drainage planning considers ground and surface water quality standards along with other factors when developing specific capital improvement alternatives, such as a large regional infiltration basin. This is largely because the standards are the foundation for other water quality programs such as NPDES permits, water clean-up plans (also known as TMDLs), and 401 Water Quality Certifications. Water quality standards are also used as benchmarks for developing recommendations for non-structural solutions. Pierce County Public Works & Utilities 2-7
43 APPLICABLE PROGRAM, POLICIES & REGS Aquifer and Wellhead Protection The Safe Drinking Water Act of 1974 (SDWA) transferred responsibility for regulation of drinking water to the EPA and called on the EPA to take a number of steps to protect the quality of the nation s drinking water supplies. EPA has set maximum contaminant levels (MCL) in drinking water for more than 100 substances. Section 1424(e) of the SDWA established a Sole Source Aquifer Program. EPA was authorized to identify aquifers that are the only or principal source of drinking water for an area. The program also calls for EPA to review all federally funded projects planned for the area. Based on the review, the EPA administrator may withhold federal financial assistance for projects determined to be potential threats to a designated aquifer. The Clear/Clarks Creek Basin lies in a designated sole source aquifer. In 1986, a new provision of the SDWA (Section 1428) required every state to develop a wellhead protection program to guard the quality of groundwater bodies used for water supply so that water arrives at a well uncontaminated. The Tacoma-Pierce County Health Department administers the wellhead protection program in Pierce County. Effect of Aquifer and Wellhead Protection Regulations on the Clear/Clarks Creek Basin Plan Basin plans take into account the locations of wells and wellhead protection requirements in siting new storm drainage facilities or recommending improvements to existing facilities. Stormwater infiltration facilities must be designed to meet groundwater quality standards or be sited to avoid areas where groundwater intersects aquifers providing potable water supplies The Growth Management Act and the Comprehensive Plan for Pierce County Washington The Growth Management Act (GMA) directed local governments of fast-growing counties, cities, and towns to prepare and adopt comprehensive plans and implementing regulations for managing their growth. Pierce County was required to prepare a comprehensive plan that meets the GMA precepts. The Comprehensive Plan for Pierce County Washington (County Comprehensive Plan) became effective in December Development regulations to implement the comprehensive plan were adopted in Three GMA planning goals directly apply to storm drainage planning. They are as follows: Urban growth. Encourage development in urban areas where adequate public facilities and services exist or can be provided in an efficient manner. Environment. Protect the environment and enhance the state s high quality of life, including air and water quality, and the availability of water. Public facilities and services. Ensure that those public facilities and services necessary to support development shall be adequate to serve the development at the time it is available for occupancy and use without decreasing service levels below locally established minimum standards. The GMA influences the provision of storm drainage and surface water management services and facilities by requiring that: 1) frequently flooded areas (flood hazard areas) be identified and protected; 2) urban facilities be constructed in urban areas only; 3) a level of service standard be Pierce County Public Works & Utilities 2-8
44 APPLICABLE PROGRAM, POLICIES & REGS established for storm drainage facilities; and 4) capital improvements be identified to meet the adopted level of service given planned land use. Effect of the GMA on the Clear/Clarks Creek Basin Plan The GMA mandates that comprehensive plans be internally consistent (RCW 36.70A.070) and that counties perform their activities and make capital budget decisions in conformity with their comprehensive plans. (RCW 36.70A.120) Because basin plans recommend capital improvement projects and form the basis of the annual capital budget for the County Storm Drainage and Surface Water Management Utility, basin plan recommendations are required to be consistent with the County Comprehensive Plan. Basin plans are also used to formulate the longer-term (six-year) capital improvement plan, also known as the Capital Facilities Element of the County Comprehensive Plan (The Supplemental Environmental Impact Statement in Chapter Ten examines the consistency of this plan s recommendations with the County Comprehensive Plan). Land use decisions drive stormwater management infrastructure needs. Adopted land use/zoning and current development regulations are used in this Basin plan to model future hydrologic conditions and determine the type, size and location of facilities that will be needed to support planned growth. Critical areas designations are used to indicate potential sites for stormwater facilities, such as infiltration ponds (aquifer recharge areas) or natural stormwater detention sites (wetlands and riparian corridors). Conversely, surface water management recommendations can influence land use density and intensity choices, for instance if a basin plan identifies stream reaches that must be protected from the adverse hydrologic effects of new development. Existing and planned land use is described in Chapter Four, Existing Conditions Shoreline Management Act The Shoreline Management Act (SMA) establishes a broad policy for how Shorelines of the State can be used, giving preference to uses that: Protect the quality of water and the natural environment Depend on proximity to the shoreline (water-dependent uses) Preserve and enhance public access or increase recreational opportunities for the public along shorelines Shorelines of the State include all marine waters, streams with a mean annual flow greater than 20 cubic feet per second; lakes 20 acres or larger; upland areas 200 feet landward from mean high water; biological wetlands; river deltas; and some or all of the 100-year floodplain, including all wetlands within the entire floodplain, when they are associated with one of the other listed waters. The SMA divides authority for compliance between local and State governments. Cities and counties are the primary regulators. Each city and county adopts a shoreline master program and use regulations that are based on State guidelines but tailored to the needs of the community. Pierce County adopted its Shoreline Master Program in 1974 and the Use Regulations in 1975 (amended in 1992). Shoreline use regulations set out a permit system for administering the program. Pierce County Public Works & Utilities 2-9
45 APPLICABLE PROGRAM, POLICIES & REGS Effect of the Shoreline Master Program and Use Regulations on the Clear/Clarks Creek Basin Plan Many of the proposed projects contained in this basin plan are likely to be located within a regulated shoreland and subject to permit requirements. The conditions that might be imposed on recommended projects are considered in Chapter Ten, Supplemental Environmental Impact Statement, Land and Shoreline Use section State Hydraulic Code The Washington State Hydraulic Code (RCW ) regulates any activity affecting the state s fresh waters and salt waters, in order to preserve fish and wildlife habitats. The Hydraulic Code is administered by the Washington State Department of Fish and Wildlife (WDFW). The WDFW requires any person, organization, or government agency whose construction project lies within the ordinary high water line of marine waters and fresh waters of the state to obtain a Hydraulic Project Approval (HPA) Permit. The HPA Permit typically specifies how construction projects are designed, managed, sequenced, and conducted to minimize adverse effects on fish and shellfish. Effect of the State Hydraulic Code on the Clear/Clarks Creek Basin Plan Certain alternatives could lie within or near state waters. Conceptual design and cost estimates for these facilities should take into consideration the conditions likely to be imposed on the project via the HPA Permit The Nonpoint Rule WAC Chapter establishes criteria and procedures for ranking watersheds in Washington State and for developing and implementing action plans for watersheds that need corrective and/or preventive actions. The purpose of WAC is to reduce pollutant loading from nonpoint sources, prevent new sources from being created, enhance water quality, and protect beneficial uses. The planning process encourages collaborative problem solving among local, state, tribal, and federal interests. It relies on voluntary actions, local ordinances, and state and federal laws, regulations, and programs for implementation. Each lead entity (usually a county) convenes a committee to review and/or re-rank the watersheds wholly or partly within the county boundaries, using criteria specified by the State. Local watershed management committees are then formed to develop action plans for the ranked watersheds. Pierce County has prepared action plans for the Lower Puyallup River, which includes the Clear/Clarks Creek Basin. Effect of the Nonpoint Rule on the Clear/Clarks Creek Basin Plan As with the WRIA planning process, the nonpoint action planning process and any completed plans should be considered when developing the basin planning strategy, basin-specific objectives and when evaluating projects. Pierce County Public Works & Utilities
46 APPLICABLE PROGRAM, POLICIES & REGS 2.3 Pierce County Regulations, Policies and Programs Pierce County Storm Drainage and Surface Water Management Master Plan (Volumes I and 2), James M. Montgomery, 1991 (1991 Plan) The 1991 Plan is the original capital improvement program (CIP) and program plan for the Pierce County Storm Drainage and Surface Water Management Utility. It documents basin characteristics as of 1991, development of the CIP and refinement of alternatives. The Clear/Clarks Creek Basin was one of the basins studied. The 1991 Plan describes physical attributes of the drainage basin (including the Roosevelt Ditch area), the drainage system existing at the time; the hydrologic modeling performed and model results. It identifies alternatives and recommends a CIP specific to the Clear/Clarks Creek Basin. Over the course of the fourteen years since adoption of the 1991 Plan, significant changes have occurred in the regulatory environment, program policies of federal and State funding agencies and Pierce County policy affecting stormwater management. In 1995, the Storm Drainage and Surface Water Management Plan became part of the Pierce County Comprehensive Plan. Several stormwater studies and plans have been added to the 1991 Plan, such as the Clover Creek Basin and 144 th Street East Drainage Plans (informally). In 1995, Pierce County secured a stormwater NPDES permit. These factors coupled with continuing land development and other changes in field conditions, have frequently ruled out projects originally recommended and have required that other alternatives be identified and implemented. Appendix B presents the projects recommended in the 1991 Plan for the Clear/Clarks Creek Basin and reports how the recommendations have been implemented. Projects shown as completed represent most of the existing regional drainage facilities covered in Chapter Four Army Corps of Engineers General Investigation New Starts Program The Army Corps of Engineers General Investigation New Start Program funds large complex projects where there is a federal interest and when co-sponsored by a local government, agency or non-profit with local matching funds. Congressional approval is required to initiate a new start. Projects are managed by the Corps of Engineers. A New Start begins with research and study, a feasibility study, preliminary design and engineering. After the preliminary work is completed, but before construction of the identified projects, Congress must reauthorize the project and allocate funds. Congress authorized a General Investigation (GI) New Start for the Puyallup/White watershed area. The initial work for the GI New Start relies on work done by a group of scientists representing agencies and governments such as the Puyallup Tribe of Indians, Washington State departments of Fish and Wildlife and Natural Resources, the Port of Tacoma, the cities of Tacoma, Federal Way and Puyallup, the Pierce County Conservation District, and Pierce and King Counties. With the Puyallup/White River watershed area in mind, they identified a number of potential projects that could help in restoring water quality and fish habitat in the watershed. Pierce County Public Works & Utilities
47 APPLICABLE PROGRAM, POLICIES & REGS Several of the projects lay in the Clear-Clarks Creek Basin as follows: Swan Creek Stream Restoration (in progress) Project identified by City of Tacoma Estuarine aquatic habitat restoration by the City of Tacoma on City of Tacoma-owned land. Excavate approximately two acres of filled wetland, replant with native vegetation within and adjacent to the wetlands, including nearby slopes. Eliminate fish passage impediments. Clear Creek Floodgate Removal (partially completed through a Port of Tacoma project) Local co-sponsor: Pierce County Water Programs Salmonid recovery. Restore natural connectivity between Clear Creek and the Puyallup River by removing the two floodgates at the Clear Creek discharge point, buy out potentially flood prone property, and/or build a setback levee to protect homes. The Port of Tacoma replaced one floodgate with an electronic gate to allow river water to wax and wane into Clear & Swan Creeks with tidal raises in river level. Drainage District #10 maintains the second floodgate.) Clear Creek Off-Channel Habitat Local co-sponsor: Port of Tacoma Restoration of off-channel habitat. Purchase land and conduct restoration actions by excavating/recreating wetlands adjacent to Swan and Clear Creeks, re-establishing riparian vegetation, and connection of wetlands to the streams. Puyallup-Lower Sub-Basin Barrier Removals Local co-sponsor: Pierce County Conservation District Remove and replace culverts that are barriers to fish passage and restore habitat. Clarks Creek & Meeker Ditch Confluence Improvement Local co-sponsor: City of Puyallup Habitat restoration, water quality improvement and flood reduction. Construct offchannel rearing & wetland areas at the confluence of the two streams. Regrade confluence area to create off-channel habitats, provide additional flood storage, and construct a forested wetland complex. Effect of the GI New Starts Program on the Clear/Clarks Creek Basin Plan Each of the projects in the GI New Start program is acknowledged in the flooding, habitat and water quality analyses. The Pierce Conservation District identified barriers to fish passage augmented the field investigations performed by the consultant, CH2M HILL. Coordination with each of the local co-sponsors is included in basin planning outreach efforts Studies and Reports Surface-Water Hydrology and Runoff Simulations for Three Basins in Pierce County, Washington, United States Geological Survey (USGS), This report documents a hydrologic analysis of the Clover, Clear, and Clarks Creek Basins. The report describes the basin characteristics (e.g., soils, topography, groundwater influences) and the conceptual model of the rainfall-runoff process, and simulates the process using the Hydrologic Pierce County Public Works & Utilities
48 APPLICABLE PROGRAM, POLICIES & REGS Simulation Program-FORTRAN (HSPF) mathematical model. Actual stream discharge measurements and precipitation information were also used to calibrate and validate the simulation model. Lower Puyallup Watershed Phase I Report, Lower Puyallup Watershed Management Committee (LPWMC), March This report is the first phase of the Lower Puyallup Watershed Action Plan, which is an effort to solve the problems of nonpoint source pollution in the watershed. Phase I of the Action Plan provides a characterization of the basin, assesses water quality, defines the nonpoint water pollution problems, and describes the goals and objectives. The report includes a detailed description of the Clear/Clarks Creek Basin, which is one of the sub-watersheds within the Lower Puyallup watershed. Ground-Water Hydrology of the Tacoma-Puyallup Area, Pierce County, Washington, United States Geological Survey, This report describes and quantifies the groundwater movement system, recharge, water use, water level fluctuations, and general groundwater chemistry within the geological landforms of the Tacoma-Puyallup area. Water Quality of the Lower Puyallup River Valley and Adjacent Uplands, Pierce County, Washington, United States Geological Survey, Water Resources Investigation Report , This report documents the water quality conditions within the Lower Puyallup watershed. Surface water and groundwater samples were collected and analyzed for a variety of pollutants. Eight sites within the Clear/Clarks Creek Basin were monitored by the USGS. In addition to these studies, Pierce County completed a drainage inventory of the County-owned structures, pipes, and channels, and the data have been entered into the County s geographic information system (GIS) database. Data from this drainage inventory, as well as other GIS features available from the County, have been incorporated into this Plan. Pierce County Public Works & Utilities
49 APPLICABLE PROGRAM, POLICIES & REGS Pierce County Public Works & Utilities
50 STAKEHOLDERS INVOLVEMENT CHAPTER THREE Stakeholder Involvement Chapter Three identifies the main stakeholders and their interests in the Clear/Clarks Creek Basin Plan. Stakeholders are people, agencies, or groups of people with an interest in the outcome of the plan. The chapter also describes efforts to involve the public and other stakeholders in the planning process. 3.1 Stakeholders and Relationship to Basin Plan The Clear/Clarks Creek Basin Plan (Basin Plan) relies on the involvement of: citizens, the Storm Drainage and Surface Water Management Advisory Board (SWAB), federal, State of Washington, and local agencies; other Pierce County departments and programs potentially affected by implementation of recommended capital improvements projects and programmatic actions of this plan. Citizens and landowners in the Clear/Clarks Creek Basin planning area are the primary stakeholders. Other stakeholders of this basin plan include: SWAB; City of Puyallup; City of Tacoma; Pierce County Planning and Land Services Department (PALS); Pierce County Public Works and Utilities, Transportation Division; Washington State Department of Fish and Wildlife (WDFW); Washington State Department of Ecology (Ecology); Pierce Conservation District; Puyallup Tribe of Indians; Federal Emergency Management Agency (FEMA); Army Corp of Engineers; drainage districts; and the Puyallup River Watershed Council. Water Programs incorporated considerable public information and public involvement in the development of the Clear/Clarks Creek Basin Plan to respond better to the varied interests of people living and working in the Basin. The following activities illustrate the core efforts undertaken: Water Programs staff identified people, groups and agencies with an interest in the outcome of the Basin Plan. An introduction to the basin plan and planning process was sent to the people identified. Stakeholders assisted in identifying issues and important values to consider in the Clear/Clarks Creek Basin Plan at public meetings, through completed questionnaires and one-on-one meetings. The County s Storm Drainage and Surface Water Management Advisory Board (SWAB), was briefed and has received the preliminary plan for consistency with County stormwater policies and has recommended its adoption to the County. Stakeholders provided data and information for use in the draft basin characterization, and assisted in identifying alternatives. Pierce County Public Works & Utilities 3-1
51 STAKEHOLDERS INVOLVEMENT Briefings of the Puyallup River Watershed Council occurred during preparation of the Basin Plan. County staff and consultants conferred with agencies with expertise and jurisdiction within the Basin. Water Programs notified the public and other stakeholders of the availability of the Draft Basin Plan and Draft Supplemental Environmental Impact Statement (DSEIS) and invited comment on the Draft Basin Plan and DSEIS. Interested people reviewed and commented on the Draft Basin Plan and DSEIS. Both the Pierce County Council and the Pierce County Planning Commission (Planning Commission) conduct formal public hearings on the proposed Basin Plan and DSEIS. Comment recorded becomes part of the official public record of the Basin Plan Pierce County Planning and Land Services (PALS) Within unincorporated areas of Pierce County, the County s Department of Planning and Land Services (PALS) provides the following public services: Administer environmental review regulations Enforce compliance with land use zoning and development codes Issue development permits and authorizations Conduct long-range land use planning for unincorporated County areas PALS staff whose project areas extend into the Clear/Clarks Creek Basin planning area provided information as follows: Effect of storm drainage and surface water management activities on existing and planned land uses Growth management policies regarding land use and public facilities (See also Chapter Two, Comprehensive Plan for Pierce County, Washington) Planned land uses, density, and current development regulations South Hill Community Plan. The Advance Planning section of PALS helped the South Hill Community to articulate a community plan that was adopted in April Figure 3-1, Relationship of Clear/Clarks Creek Basin to Community Planning Areas, illustrates the South Hill Community Plan area in relation to the Clear/Clarks Creek Basin. Pierce County Public Works & Utilities 3-2
52 STAKEHOLDERS INVOLVEMENT Citizens of South Hill expressed the following desires regarding stormwater management: Design stormwater management facilities and retrofit existing facilities so they are visually part of the community s open space network. Design stormwater facilities in a way that protects people from safety concerns, but integrates functionality as part of the walkway and park and recreation system. Continue to reduce the severity and number of flood events. Provide information to PALS about the effects of development practices on the ability to manage stormwater effectively. Pierce County Public Works & Utilities 3-3
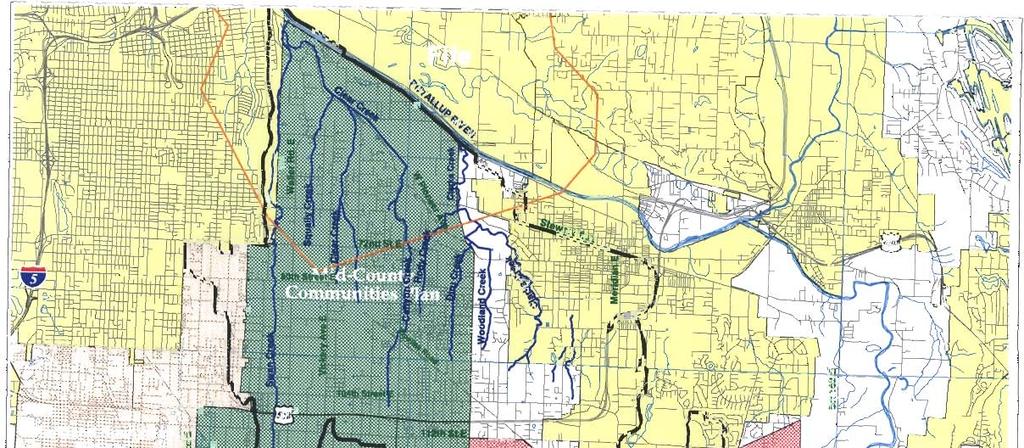
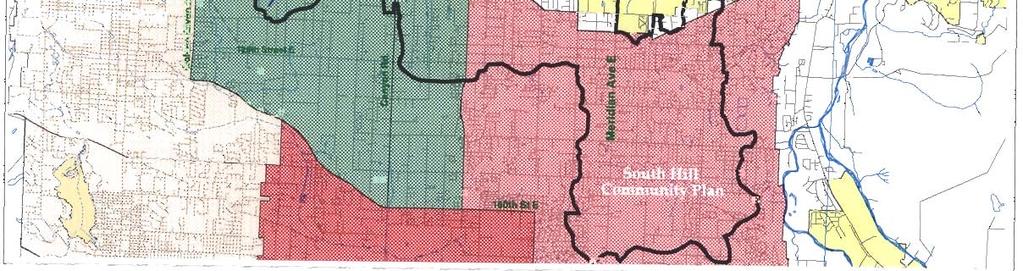
53
54 STAKEHOLDERS INVOLVEMENT Basin planning staff attended meetings of the South Hill Community Plan Advisory Board to listen to citizens as they identified the vision and needs of the community. Stakeholder questionnaires were given to interested citizens to document problems and community perspectives. Several citizens who reside within the Clear/Clarks Creek Basin commented on stormwater related problems. County Water Programs staff also coordinated with the South Hill Community Planning Board by providing facts about local hydrology, storm drainage problems, stormwater requirements for new development, current policies and law regarding surface water management, and anticipated changes to policy and law regarding stormwater, surface water, and local stormwater facilities. Mid-County Communities Plan. The Mid-County Communities Plan area extends across 47% of the Clear/Clarks Creek Basin. This includes all of the Clear Creek drainage basin, the eastern part of the Roosevelt Ditch drainage area, and the westerly half of the Clarks Creek drainage basin (Rody Creek and Diru Creek drainages). Figure 3-1 shows the location of the Clear/Clarks Creek Basin in relation to the Mid-County Communities planning area. PALS forecasts release of the Draft Mid-County Communities Plan in Coordination efforts have consisted of providing descriptions of drainage conditions to the Mid-County Communities Planning Board, and including planning board members on the mailing list for the Draft Basin Plan and DSEIS so members have an opportunity to review and comment on the Draft Basin Plan as the Mid-County Communities Plan takes form. Citizens concerns expressed during development of the community plan have been integrated into the problem descriptions. Recommended actions in this Basin Plan respond to the concerns. Parkland-Spanaway-Midlands Communities Plan. Adopted in 2002, the Parkland- Spanaway-Midlands Communities Plan occupies the western half of the Roosevelt Ditch drainage area. Although specific recommendations were not adopted for the Roosevelt drainage area, the community plan calls for the integration of public regional stormwater ponds into the natural environment and the community through multiple-use design Washington State Department of Ecology (Ecology) Ecology is the permitting authority for NPDES permits. Pierce County Water Programs has a Phase I Stormwater NPDES Permit. Actions implemented from basin plans must comply with permit terms. Ecology also is responsible for many aspects of watershed protection grants and activities, administration of the State Environmental Policy Act (SEPA), and enforcement of sediment, groundwater, and surface water standards. Ecology is also the state agency charged with identifying water bodies with compromised water quality or that are not expected to improve within the next two years. Ecology submits a program to the federal Environmental Protection Agency (EPA) for restoring water quality in the listed water bodies. Water segments with management plans likely to result in improvement of water quality sufficient to meet standards need not be listed. EPA requires states to clean up Pierce County Public Works & Utilities 3-5
55 STAKEHOLDERS INVOLVEMENT threatened waters and establish Total Maximum Daily Load (TMDL) limits for each listed water quality parameter. NPDES permits are written and revised based on these listings. Operating specifications for the NPDES permit can mandate that storm water runoff not contribute additional pollutant loads to the listed water bodies Washington State Department of Fish & Wildlife (WDFW) The Washington State Department of Fish and Wildlife (WDFW), along with the Puyallup Tribe, helped identify gauging locations and conducted additional Benthic Invertebrate Biological Index (BIBI) sampling in the Clear/Clarks Creek Basin; the results of which are included in Chapter Four. WDFW is the State agency responsible for issuing hydraulic permits for work in State waters. Primary interests in the Clear/Clarks Creek Basin are: Salmon recovery Protection of other fish and wildlife species WDFW operates the Puyallup Hatchery on Clarks Creek. The hatchery has been identified as a source of nutrients to Clarks Creek (KCM 1993, 1996). The hatchery is located just below Maplewood Springs in the City of Puyallup. The hatchery site includes a constructed intake pond that provides the hatchery with water. The pond is full of fine sediment; a problem addressed in Chapter Seven, Water Quality Analysis for Clarks Creek. The hatchery currently rears brown trout, rainbow trout and kokanee, which are transported for release in other stream and lake systems. They also rear steelhead, which are transported to the Voights Creek Hatchery for release. Any surplus beyond the number assigned to go to Voights Creek are released into Clarks Creek. The Clear/Clarks Creek Basin Plan coordinated with WDFW by considering the Integrated Streambank Protection Guidelines in the conceptual design of storm drainage facilities. WDFW staff provided ideas for how to solve Clarks Creek water quality problems. Additional coordination took place in preparation of the Supplemental Environment Impact Statement Puyallup Tribe of Indians The Puyallup Tribe of Indians (Puyallup Tribe) has actively worked on storm and surface water issues in the Puyallup River Watershed. The Tribe conducted water quality sampling at several locations in the Clear/Clarks Creek Basin and they assisted in characterizing conditions by sharing data. Sampling results are presented in the Water Quality section of Chapter Four. The Tribe participates in the City of Puyallup s Clark Creek Pollution Reduction Project, assisting with collection of water quality information and data assessments. Staff for the Puyallup Tribe reviewed and provided comment on the Draft Clear/Clarks Creek Basin Characterization Report. The comment is contained in Appendix C, Basin Plan Public Involvement & Agency Coordination Correspondence. The Puyallup Tribe maintains one fish hatchery on Diru Creek (at approximately 72 nd Street East and Pioneer Way East). The Tribe is constructing a new hatchery on Clarks Creek between River Road and Pioneer Way East, which will serve as a rearing facility for Chinook salmon hatched at the Diru Creek hatchery Pierce County Public Works & Utilities 3-6
56 STAKEHOLDERS INVOLVEMENT Parts of the Clear Creek and Clarks Creek drainage basins fall within the 1873 Survey Area of the Puyallup Tribe, depicted in Figure 3-2. Plans for the use of land and development plans are subject to the 1989 Settlement Agreement between the Puyallup Tribe, the U.S. Government, the State of Washington, and local governments. Chapter Two describes the provisions of the agreement applicable to the Clear/Clarks Creek Basin Plan. Representatives for the Puyallup Tribe cited the following issues or desires: Participation of Pierce County Water Programs in projects to restore oxbows along the lower reaches of the Puyallup River. Protection of stormwater water quality by using Best Management Practices for stormwater treatment, including retrofitting existing facilities. Removal of barriers to fish passage in creeks tributary to the Puyallup River. Concern with the amount of growth & development in the basin without: (1) requiring and enforcing use of Best Management Practices for stormwater; and (2) encouraging low-impact development. Pierce County Public Works & Utilities 3-7
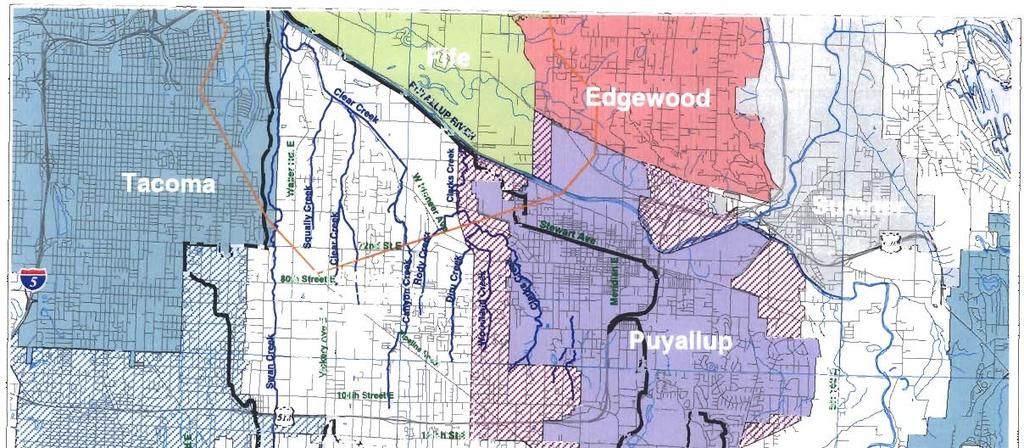
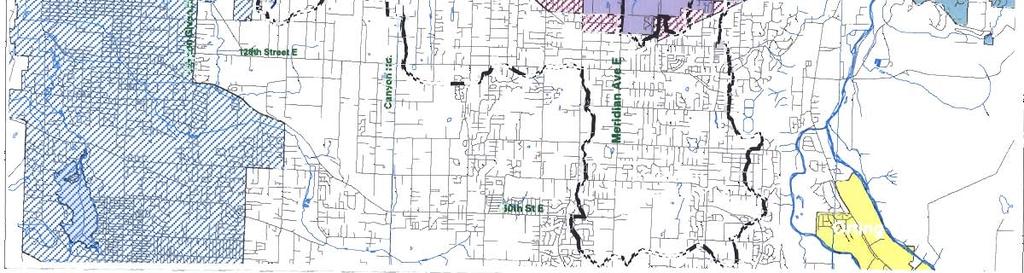
57
58 STAKEHOLDERS INVOLVEMENT Cities and Towns Unincorporated Pierce County occupies over 93% of the Clear/Clarks Creek Basin; 17% of the Basin lies within two cities, Tacoma and Puyallup. (See Figure 3-2, Local Governments in the Clear/Clarks Creek Basin, and Table 3-1, Areas of Local Governments in the Clear/Clarks Creek Basin) Table 3-1 Areas of Local Governments in the Clear/Clarks Creek Basin Local Governments Acres of Jurisdiction in Basin Total Acres of City Percent (%) of City in Clear/Clarks Creek Basin Percent (%) of Clear/Clarks Creek Basin in Jurisdictions Pierce County 19, % Puyallup 3,131 7,920 39% 15% Tacoma ,163 1% 2% Cities Total 1, Total 21, % Source: Pierce County Geographic Information System 11,2003 Although the Basin Plan focuses on unincorporated areas, surface water follows topography without regard for political boundaries. Stormwater runoff within cities frequently passes into unincorporated areas and vice versa. Drainage conditions and decisions in cities have potential to improve or worsen flooding, water quality and habitat conditions in unincorporated areas. Conversely, stormwater management decisions for County governed areas can affect the surface water volume and quality in the cities. With these relationships in mind, city staff in Tacoma and Puyallup were periodically briefed on the on the findings and direction of the Clear/Clarks Creek Basin Plan. They were asked about flooding problems in subbasins shared with the County and other drainage issues of concern to the City. All stated an interest in sharing data and information and in collaborating to solve shared drainage concerns. City of Puyallup The City of Puyallup is working on a pollution reduction project for the Clarks Creek Watershed, about half of which flows through unincorporated Pierce County. The pollution reduction project is intended to recommend Total Maximum Daily Loads (TMDLs) for pollutants (primarily pollution indicated by fecal coliform bacteria) degrading Clarks Creek. Both Clarks Creek and its tributary, Meeker Ditch (Meeker Ditch lies wholly within the City of Puyallup), Pierce County Public Works & Utilities 3-9
59 STAKEHOLDERS INVOLVEMENT have exceeded water quality standards for fecal coliform bacteria and ph 2. In addition to the bacteria problems, high levels of nitrogen, phosphorus and sediment have been recorded. These pollutants contribute to the excessive growth of aquatic plants in Clarks Creek. Pierce County Water Programs is a participant in the City of Puyallup s TMDL study as a member of the technical advisory committee for the project. Study recommendations probably will not be published until after completion of the Clear/Clarks Creek Basin Plan. However, this Basin Plan acknowledges the water quality issues and recommends actions for the unincorporated Pierce County portion of the Clarks Creek drainage area to minimize the County s contribution to the problem. If the TMDL study identifies other measures for Pierce County action, they can be considered for amendment to the Basin Plan. City of Tacoma The westerly edge of the Swan Creek drainage area lies within City of Tacoma boundaries. Largely undeveloped, the City boundaries encompass the majority of Swan Creek through its canyon section. The headwaters of Swan Creek and the valley floor fall within unincorporated Pierce County. Because of the proximity of lower Swan Creek to the industrial area of the Commencement Bay tideflats and the importance of the wetland function in and around Commencement Bay, the City of Tacoma chose lower Swan Creek to become a Natural Resource Damage Assessment (NRDA) restoration site. The City acquired approximately 11 acres of land, removed physical structures, constructed a new channel reconnecting Swan Creek to the Haire Wetland, and planted native vegetation in order to create, enhance, and protect salmon habitat. City staff stated concerns about sedimentation from the intense scouring that occurs in upstream Swan Creek. Tacoma receives stormwater flow from the County s Roosevelt Ditch drainage area. Roosevelt Ditch flows to Tacoma s T-Street Gulch storm drainage facilities. The T-Street Gulch discharges to the Puyallup River shortly before it empties into Commencement Bay. The City s concerns in the Roosevelt Ditch drainage range from increasing peak stormwater volumes with more development and the effects on Tacoma facilities downstream to protecting water quality Other Agencies or Groups Pierce Conservation District The Pierce Conservation District (Conservation District) is a special purpose district authorized by State statute RCW to help citizens manage natural resources wisely. Statute authorizes conservation districts to conduct surveys and research, conduct educational and demonstration projects with the consent of landowners, design improvements, and recommend actions of individuals and governments to conserve natural resources. They cannot regulate or require adherence to their programs or recommendations. The Conservation District administers a Dairy Waste Management program, a Farm Assistance program, Salmon Recovery programs, and a Stream Team program. At the heart of these programs are water quality, soil conservation, habitat protection and habitat restoration. 2 ph is a measure of the degree of acidity or alkalinity in a substance Pierce County Public Works & Utilities
60 STAKEHOLDERS INVOLVEMENT The Clear/Clarks Creek Basin Plan uses an inventory of culverts that bar fish passage prepared by the Conservation District to point out problem culverts in the stormwater drainage system. In 1997, the Conservation District funded a water quality assessment of Clarks Creek, Meeker Ditch, and the City of Puyallup Drainage System. The description of water quality conditions in Clarks Creek in Chapter Four uses the Conservation District s assessment as a source document. Puyallup River Watershed Council The Puyallup River Watershed Council is a collaborative group of leaders within the Puyallup River Watershed. It serves as a forum for solving problems within the Watershed, promotes its sustainable resources, and pursues the preservation and restoration of the Watershed for future generations. The Council is active in public education about non-point pollution. Over time, they have expanded their interests to include the review and ranking of salmon recovery projects within the Watershed. Membership includes representatives of State agencies, the Puyallup and Muckleshoot tribes, Pierce County, environmental groups, public utilities, cities and town, businesses, farmers and other citizens. The Water Committee of the Watershed Council expressed the following interests and concerns: Improvement of stormwater quality that enters the Puyallup River and its tributary streams Continuing dialogue with the Water Committee as the Basin Plan progresses Coordination between the various programs within the County that either contribute stormwater to the Clear/Clarks Creek Basin, work on salmon recovery, or administer and prepare regulations concerning land clearing, grading, open space and land development Port of Tacoma The Port of Tacoma has constructed a series of off-channel wetlands between Clear Creek and Swan Creek known as the Clear Creek Habitat Area. The 8.5-acre projects provide off-site mitigation for Port improvements in the Tacoma tideflats. To ensure sufficient water to inundate the wetlands and to maintain fish access from the Puyallup River into the wetland system, the Port replaced one of the flap gates at the mouth of Clear Creek with a tide gate that remains open, allowing tidally influenced water in the river to enter Clear Creek and the wetlands. This allows salmonids unobstructed passage to spawning areas. It also serves as the transport medium for juvenile salmonids migrating to Puget Sound from wetland rearing areas. The tide gate acts as a floodgate when water levels reach a certain elevation in the Puyallup River, closing until water elevations decrease enough to enable Clear Creek to drain into the river without river induced backwater flooding. The Port owns an additional 31 acres (two parcels) in the Clarks Creek floodplain upstream from the existing constructed wetlands. These properties may be sites for future off-site wetland/fish habitat mitigation projects. Interests of the Port of Tacoma lie in protecting the water quality of Swan Creek and Clarks Creek and in continuing to allow tidally influenced river water to replenish the wetlands. Pierce County Public Works & Utilities
61 STAKEHOLDERS INVOLVEMENT METRO Parks Tacoma Metropolitan Park District owns and manages the 250-acre Swan Creek Park at East 59 th Street and Roosevelt Avenue East. Although the park is currently undeveloped, a primitive dirt trail extends along the creek. A canyon containing Swan Creek stretches the length of the park. Several community and student groups are dedicated to improving habitat along the creek for fish and plants. Ameliorating Swan Creek s channel down-cutting and associated loss of habitat and slope stability are significant issues for METRO Parks and users of the park. Clarks Creek Greenway Project With project design funded by the National Park Service, the concept of a Clarks Creek Greenway is the brainchild of a group of Puyallup School District educators, residents on the creek and the Puyallup River Watershed Council. Its goals are to provide resident and visitor access and educational opportunities at appropriate locations along Clarks Creek and to create a non-motorized transportation link from the greenway to South Hill. The project also entails habitat restoration and habitat maintenance along the creek. Ongoing communication with the Clarks Creek Greenway group about maintenance and capital improvement projects along creek at the project concept (pre-design) phase are key interests Property Owners, Residents, and Businesses within the Clear/Clarks Creek Basin Pierce County Water Programs invited citizens to participate in basin planning at several points in the basin plan s development as follows: Start of Planning Information & Questionnaire Mailing Water Programs sent approximately 350 informational packets to property owners adjacent to streams, creeks, rivers, floodplains, and wetlands in the Basin. Information described the basin planning process and included a questionnaire soliciting information about the basin and the preferences and perceptions of people responding. A large percentage of respondents expressed concern about water quality and habitat as opposed to flooding problems. The planning team conducted follow-up conversations with several respondents to obtain more information for use in the problem identification task. Project staff added respondents to the mailing list for future meetings and mailings. Public Meeting On May 22, 2001, project team members met in the Pierce County Library Administration Office (112 th Street East & Waller Road) to converse with citizens in the Basin about surface water problems and the basin plan. Website Launched Water Programs launched an interactive and continuously maintained project website in 2001 to keep citizens, property owners, and other stakeholders informed of the basin plan s progress. Pierce County Public Works & Utilities
62 STAKEHOLDERS INVOLVEMENT Basin Characterization Briefing Water Programs staff briefed the South Hill Community Planning Board. Subjects included the basin planning process and existing drainage conditions in the Clear/Clarks Creek Basin. Public Meeting The project team presented the findings of the Draft Clear/Clarks Creek Basin Characterization Report to citizens on the evening of June 5, 2002, at the County Library Administration Office. Citizens shared their concerns, perceptions, and ideas for solving problems. Several people asked about reduced flow in Clark s Creek, repetitive losses in the lower Clear Creek floodplain, and the volume of sediment being transported to the valley floor. Other issues included flooding on Canyon Road and 90 th Street East, flooding in the 135 th Street East pothole, garbage in several of the creeks, the new tide gate at the outlet of Clear Creek, the Woodland Avenue East (Woodland Creek) detention project, City of Puyallup storm drainage plans and projects and Puyallup Fair activities. Draft Basin Plan Public Meeting Water Programs will sponsor an open house style public meeting on the Draft Supplemental Environmental Impact Statement and the Draft Plan shortly after issuing the Draft Basin Plan. Public comment recorded at the meeting will be addressed in the Final Supplemental Environmental Impact Statement for the Draft Clear/Clarks Creek Basin Plan. Appendix C contains copies of the questionnaire form, public meeting notices and related public information. Implementation of Basin Plan Water Programs will provide periodic status reports to property owners, residents, and businesses describing projects scheduled for construction, noting projects completed, reporting on progress of programmatic activities, and inviting comment on what has been working and what can be improved. 3.2 Roles and Responsibilities Pierce County Department of Public Works and Utilities holds that in order for basin plans to achieve their objectives a partnership must be forged with people. Keys to agreement are: Effective communication between staff, consultants and stakeholders and Consideration of each person s or group s viewpoints at practical points in the planning process. Pierce County Public Works & Utilities
63 STAKEHOLDERS INVOLVEMENT Responsibility for Decision-Making Water Programs selects the set of recommendations (projects, proposed policies, other suggestions in the Draft Basin and DSEIS) presented to the public, the Storm Drainage and Surface Water Management Advisory Board (SWM Advisory Board). The SWM Advisory Board recommends the Basin Plan to the Pierce County Planning Commission, County Executive, and County Council. Water Programs transmits a proposed Basin Plan and Final Supplemental Environmental Impact Statement to the Pierce County Executive, who then refers it to the County Council. Basin plans are approved and adopted by ordinance Communication Effective communication entailed dialogue between the planning team and stakeholders, sharing data and history, what has been working, what has not been working, what people would like to see, and their perceptions about problems and the best ways to solve them, etc. Successful communication usually takes a mix of outreach efforts to reach enough people or accommodate their busy schedules. Accordingly, communication with the public for this basin plan employed such media as individual and public meetings, open houses, study sessions, public access television, newsletters, newspaper articles, public notices, and formal requests for comment through public hearings Public Involvement at Key Points Figure 3.3 illustrates the stages in the planning process when public information and opportunities for involvement occurred. Pierce County Public Works & Utilities
64 STAKEHOLDERS INVOLVEMENT Figure 3.3 Communications with Public & Other Agencies Project Scope & Budget Approved by County Council & Executive Phase I. INFORMATION GATHERING & Basin Characterization Public Mtg #1 Interviews w/ Agencies & Groups Draft Clear/Clarks Creek Basin Characterization Feedback from Agencies & Interested People Phase II Scope of Work Public Mtg #2 Open House - Draft Characterization & ID alternatives Follow-up investigation from Phase I Forecast of Future Stormwater Runoff Flows Alternatives Identification Evaluate Alternatives/incl. environmental impacts RECOMMENDATIONS Public Mtg SWAB on Preliminary Draft Basin Plan & Preliminary DSEIS SEIS DRAFT Clear/Clarks Creek Basin Plan & DSEIS Public Mtg #3 Open House - Draft Plan & DSEIS PUBLIC MEETINGS Pierce County Public Works & Utilities
65 CURRENT CONDITIONS CHAPTER FOUR Current Conditions Chapter 4 describes characteristics of the Clear/Clarks Creek Basin existing and known at the time of writing that are pertinent to an understanding of storm drainage facilities, flood hazards and surface water conditions in the basin. The chapter begins with descriptions of natural features, such as topography, soils, climate, and flood hazard areas that influence surface water patterns and historical problems. The chapter then describes the natural and constructed drainage systems, followed by water quality and the aquatic, riparian, and wetland habitats relevant to managing storm water runoff within the regulatory environment described in Chapter 2. Presentation of current conditions wraps up with land use and population data and the record of flood losses within the basin over time. Subsequent chapters of the basin plan rely on the information presented here, e.g., an accurate characterization of problems identified during the planning period (see Chapter 5) draws from the facts set out here in analyzing problems (Chapter 6) and identifying and evaluating alternatives (Chapters 6, 7, and 8). 4.1 Topography, Soils, and Rainfall The Clear/Clarks Creek Basin is located in north-central Pierce County in Water Resource Inventory Area (WRIA) 10. It encompasses both the Clear Creek and Clarks Creek drainage basins, along with an adjacent area of potholes and the unincorporated part of the Roosevelt Ditch drainage. The Clear/Clarks Creek Basin drainage area is approximately 32 square miles in size. Both Clear Creek and Clarks Creek flow into the Puyallup River shortly before the river empties into Commencement Bay. Clear Creek drains the western portion of the basin. Clarks Creek drains the eastern portion of the basin, including a large portion of the City of Puyallup. The potholes extend into the City of Puyallup and drain internally except during extreme storm events Topography The varied topographical landforms in the Clear/Clarks Creek Basin are the product of volcanic activity, tectonic uplifting, glacial advances and retreats, and erosion by rivers and streams. Intermittent volcanic activity and uplift of the volcanic range, eventually resulted in the creation of the Cascade Mountain Range. Deposits of sandstone, shale, and coal compressed, folded, uplifted, and eroded into the foothills of Mount Rainier and the Cascade Range. Over the past one (1) million years, glaciation modified the landscape of what is now the Puget Sound lowlands, as repeated advances and retreats of the Puget Sound lobe of the Cordilleran ice sheet scoured elongated hills and valleys oriented in a north-south direction (LPWMC, 1992). Ice from the most recent episode of glaciation, known as the Vashon Stage, retreated about 12,500 years ago. Glacial deposits resulting from the Vashon glaciation include advance outwash, glacial till and recessional outwash. Advance outwash (rock carried forward as a glacier advances) and glacial till were formed of deposits of silt, sand, clay, gravel and boulders compacted by the weight of Pierce County Public Works & Utilities 4-1
66 CURRENT CONDITIONS overlying ice. They usually drain poorly. Meltwater from receding glaciers deposited recessional outwash, deposits of sand with traces of silt and gravel that drain well. The pothole area is characteristic of topography that resulted from the recessional outwash underlain by glacial till (LPWMC, 1992). Rivers and streams have eroded the glacial deposits into alluvial valleys and the steep slopes lining them. The Puyallup River valley resulted from a combination of mudflows and alluvial action of the Puyallup River. Figure 4-1 depicts the topographic features of the Clear/Clarks Creek Basin. Soil characteristics of the Clear/Clarks Creek Basin resulting from these geological processes are described in Section Creek Drainage Basins The lower portion of the Clear Creek and Clarks Creek drainages is composed of the nearly level flatlands of the Puyallup River valley. South of Pioneer Way, elevation rises quickly from the floodplain to steep valley walls and the upper basin. Transitions along the streams are characterized by steeply sloped canyons that result from the streams cutting into the valley walls (Montgomery, 1991). Upper portions of the basin, including the potholes area are terrace and rolling hills with numerous small ponds and wetlands. Elevations range from a high of 500 feet near the headwaters of Diru Creek to feet at the northern edge of the basin where the creeks drain into the Puyallup River valley along Pioneer Way (USGS, 1994). Swan Creek, Squally Creek, and Canyon Creek discharge into Clear Creek in the Puyallup River valley before Clear Creek enters the Puyallup River. These streams are very flat in the upland areas, and then drain through narrow and relatively steep channels down the hillside into the flat floodplain area of the Puyallup River. The basin is considerably urbanized and contains many fabricated stormwater conveyance channels that carry water from roads and developed areas to natural stream waters (USGS, 1994). Swan Creek drains a small section of the City of Tacoma on the western edge of the basin. The communities of Midlands and Summit are also located with the Clear Creek Basin (see Figure 1-2). Along the lower reaches, Clear Creek drains some of the flat agricultural areas in the floodplain south of the Puyallup River and north of Pioneer Way. Much of this floodplain area falls within designated flood hazard areas and has experienced repetitive losses of property due to floods (Tetra Tech/KCM, 2001). Clarks Creek, located immediately east of the Clear Creek Basin, receives Rody Creek, Meeker Ditch, Diru Creek, and Woodland Creek and drainage from a large portion of the City of Puyallup. Rody Creek, Diru Creek, and some of Woodland Creek have topographic characteristics similar to the streams in the Clear Creek Basin. They also exhibit narrow steep channels, which cut into the hillside as they flow from the uplands terrain toward the Puyallup River valley and the Clarks Creek mainstem. Clarks Creek becomes a meandering stream north of Pioneer Way after it flows down the hillside. Pierce County Public Works & Utilities 4-2
67 G µ ³ ³ Å Ä Æ Ä È Ð É Ï É Ñ Ï Ê É ÒÑ Ð Ï Î Í Ì Ë Ê É p,,+ M MN L ê ½ Å Ä Æ Ä DEE t r q r s = >> `ab cdde f g d š _` ]^ Z[\ :<; ; T<U>VW$X V9Y /00 h7ikjmlonqpsr Ó&Ô Ô&Õ ÖŒØ Ö ÙÚÜÛ9Ý ÚgÞ ß ž Ÿ ž š Ÿ ž œ š Q x y xz7{ z7{9 Ú7Û<Ü]ÝßÞ Üsà ª «< X o s r r s!tu$v t&w ±²² ˆ kšm oœq sž 7 < X o s ö &øïùxúoû ùóü 2 ª«7 Ô7Õ<ÖX oø ÖsÙ ÇÆ ÅÄ Ã ÁÀ ¾ Ÿ œœ ž ± æç äå áâã èç ç æâ ä åä ãâ -.. QN P RS PO K J GHÿI FE )* * ' (( HJI I ý þÿ }~ ƒ $ ˆ ² ² ³ ² µ ¹&º¼» á ÇàÀ T U<VXWZYZ[]\_^]\ KLL :<;>=?$@ACB!D!! $&% % "## 9ŠŒ Ž j<k7l4m$nocpq Ä7Å ÆXÇoÈ]ÉsÊ]Ë?@@BAC C }~ z{ ƒ y wx ttuv!"$# &% FGG»¼ ¹º Ì Í&ÍÏÎXÐoÑ ÎÓÒ R S S ½ ¾& <ÀXÁo Àsà é ' ()!*+$, *&-. /02143$57698 ï ð&ñïòxóoô òsõ î ìí êë èéé a b c4degf hi jlk\mfk`n=o 3 [ 01&,+ d 3 [ &U+ef2g>,&h2UY NW>,*.P1N.a.&U+i 9DOb+0.&:cR2 >5A]9'^_6=&`Y [ +*.&1a -/+ O0,+ZY &\[ 2 3 *.N)O*1P,+ 2WVXS.S:T O 3 *.N)O*1P,+ 2RQ.SUT O %'&)( *,+.-/+ 01& /8:9 6<;=;=8?>:-=9<@A 354 ;:-76 6<;=;=8?>:-=9<@A BDCFEHGIC 4 ;:9 6IC'CI9J;:KJ; 4 EMLI@ E 3 ë4ì í î î îïî ðòññòñ ñ ðòññòñ óòññòñõôöö M&N N OQP P ø ø ù úûýü þ ø ÿ ø ú ÿ ø ø ù ø þ ÿ ø ÿ ø ÿ ú þ ÿ!>þ "# $ $ 7þ u
68 CURRENT CONDITIONS Roosevelt Ditch Area Roosevelt Ditch is located to the west of Swan Creek and drains to the City of Tacoma s T-Street drainage system. This area has topographic features similar to the upland area of Swan Creek with a relatively flat upland area and a moderately sloped channel. Manmade conveyance systems from commercial and residential areas adjacent to Portland Ave East connect runoff from the basin to Roosevelt Ditch. A small portion of the Roosevelt Ditch, west of 12th Avenue East, drains to the north toward the drainage system on 72nd Street East. Potholes Area Sixteen potholes exist to the south and southeast of the Clarks Creek drainage basin. Potholes are small basins where surface water drains to a system of closed depressions or ponds with no outlets. There are no stream channels draining the potholes. During large storm events, stormwater fills the depressions to flood level and then overflows to adjacent basins (URS, 1999). Topography of the area resembles the uplands of the Clear Creek drainages, mostly rolling hills with gentle slopes. The elevations in the Pothole basin range from a low of about 400 feet in the northwest to a high of about 600 feet in the southeast Soils Soil associations in the basin, shown in Figure 4-2, consist of three types: Alderwood-Everett, Kapowsin, and Puyallup-Sultan. The Natural Resource Conservation Service (NRCS) classifies soils into four hydrologic soil types (A, B, C and D) based on the soil s runoff potential. Type A soils typically have a very high infiltrative capacity and generate the least amount of runoff relative to the other soil groups. Conversely, type D soils have the lowest infiltrative capacity and generate the highest amount of runoff. Type D soils are typically associated with saturated soil conditions. Figure 4-2 illustrates the general distribution of the soil groups across the basin. This figure shows that the Clear/Clarks Creek basin contains all four soil groups. Lowlands near the Puyallup River The soils in the lowlands area near the Puyallup River are of the Puyallup-Sultan association. They are generally located in the area bounded by the Puyallup River to the north, Pioneer Way to the south, and the City of Puyallup to the east. Puyallup-Sultan soils are nearly level, welldrained soils that formed in alluvium, deposited on the floodplains by the floodwaters of the White and Puyallup Rivers. The upper 20 to 30 feet of alluvium consists primarily of silt, muck, and fine sand and some gravel deposits. According to the Soil Survey of Pierce County (SCS, 1979), the Sultan soils are moderately well drained, and the Puyallup soils are well drained. Puyallup soils, fine sandy loam soils, underlie most of the City of Puyallup, whereas the remainder of the lowlands area is intermixed with both Sultan and Puyallup soils. Puyallup and Sultan soils are classified as hydrologic soil type A and C, respectively. Western Uplands The soils in the western half of the upland portion of the Clear/Clarks Creek Basin are of the Kapowsin association, generally west of 86th Avenue East and south of Pioneer Way. Kapowsin soils are classified as hydrologic soil type D. Perched groundwater and areas of standing water form are characteristic of Kapowsin soils during the wetter months. Stormwater infiltration Pierce County Public Works & Utilities 4-5
69 CURRENT CONDITIONS systems are not appropriate for areas with these soil characteristics. The gravelly loamy soils formed in glacial till and are typically moderately well drained soils on undulating to rolling uplands. There are two types of glacial tills associated with the Kapowsin soils. Lodgment till consists of up to 200 feet of glacial deposits that were compacted by the weight of the overlying glaciers. Because of the compact and dense nature of lodgment till, it is often referred to as hardpan, and has very low permeability. Lodgment till restricts the infiltration of water and can create extremely saturated surface soil during the wet seasons. The second type of glacial till in the basin is ablation till, which was formed as glaciers melted and left sediment that had been carried by the ice. In contrast to the lodgment till, ablation till consists of loose well-drained sands and gravels. Ablation till is found on the top of lodgment till and tends to vary in thickness from zero to several feet (USGS, 1994). Eastern Uplands & Potholes Alderwood-Everett association soils are located south of the City of Puyallup in the eastern half of the basin and within the majority of the pothole area. These soils are moderate to excessively well-drained formed in glacial till and recessional outwash on the uplands. The Alderwood series consists of moderately well-drained soils that formed in glacial till, with a hardpan layer just below the surface that reduces infiltration and results in standing water, wetlands, and high seasonal groundwater table (KCM, 2000). Alderwood soils are classified as hydrologic soil type C. The Everett series soils are generally excessively well-drained because they were formed in loose, gravelly glacial outwash deposits. Everett soils are classified as hydrologic soil type A. Salmon Springs Aquitard Along the deep canyons near the mouths of Swan Creek, Clear Creek, Canyon Creek, Rody Creek, and Diru Creek, are areas where erosion and down cutting has exposed a geological deposit known as the Salmon Springs Drift, a land form older than the Vashon Drift (see Section 4.1). The Salmon Springs Drift is extremely impermeable and restricts the downward movement of water (USGS 1994). Many springs are present where the overlying, highly permeable Vashon advance gravel deposits meet the layer of Salmon Springs Drift. The springs were noted during the field surveys as part of this study (see also Section 4.7). Alderwood and Kapowsin soils in the uplands portion of the Clear/Clarks Creek Basin provide less than optimal conditions for on-site sewer systems and stormwater infiltration systems. Both Alderwood and Kapowsin soils are underlain by glacial till, with seasonal high or perched groundwater tables, and can cause hydraulic overloads of poorly designed on-site sewer systems. Stormwater infiltration systems are not appropriate for the areas with these soil characteristics. On the other hand, the excessively draining Everett soils provide for rapid drainage from on-site sewer systems and stormwater infiltration systems, but may not provide for adequate treatment of pollutants, and can potentially cause groundwater pollution (KCM, 2000) if pretreatment is not provided Rainfall Meteorological variables such snow pack, temperature, precipitation distribution and the intensity and orientation of the jet stream affect storm drainage and flooding. The Clear/Clarks Creek Basin is characteristic of the coastal to upland areas of Puget Sound, Pierce County Public Works & Utilities 4-6
70 Y U Z a j j :; ƒ Œ Ž Œ Ž Œ Š ˆ žÿ ÇÈ PQR ST UV <=>?@ AB j õô z uv wx ƒ Ÿ ž}»¼½ Ï j Õ ÔÓ! ÉÊÌË Ë`ÍÎ Ê É Í "$#&%('*), G š œ? XY Z] [\ XY VW U ] ^`_ a b _ c d b e f ghi*j h.k + +,.- /0-21 $ šœ. o q p po n lmn C D&E(F*G,H.I J$KLM*N L.O $ *. \ [Z WXY W ³ µœ * ¹ º ^`_ba c dfe gh#i ƒ ~} { kmln ÿ ý ÿ üýþ ü û À ¾ ú ¼ø¾ù ö À ¾ AB'C o omp omqsrut v2wyx MÑ L ÔLÓ Õ K ì$íîï*ðñòœó DEGF H I F'J!#"$%'&)('* $ ƒ *. ˆ ÒÑ ÐÏ #6 5#67 ÃÆ Å ÃÄ Á 4 23 T RS QP NO Ö ØŒÙÚ*Û Ù Ü rst Š ŠŒ *Ž Õ Ñ MÑ L ÔLÓ Õ K Œ *±.² Ý Þ ßŒàá*â à ã «ª /01 / ä å æ&ç(è*é,ê.ë y z {}~* }. í á ñóßáþ í á óßáÿ öæì2óö<ã òýì?àéòœþóß Ý í á ñóßáþ í á óßáÿ öæå2é óö<ã ò ì2àéòþóßã ñö åôõ ßñóüýö í ã õ ã ñö ìô øå?ùûúøóã á ßÁàóÞ ëôßáõ ñßáã óá ö å?àœã á ïðý»êœñ ì2àéòþóß Ý ÜmÝ»Þßàá àâã äæå2àã á'çèßáàéœê ë ì í î ª «` ` ± ` ³²` ` µ ¹»º ¼ ½b¾ ÁÀ  à ¾ Ä ÃÅfÆ.ÇÈ É Ê Ë Ì Í Ã ½ Ë Â É Î Ï Ð Ñ Ò Î Ó.Ô ¼ ½ ¾ ¾ à ½ ¾ Ë Ä Ä Ä Õb¾ à ½ b¾ Ë Ö Ø¼ ½b¾ Ù ¼b¾ Ä Ú#Ò Û Û Ñ#¼
71 CURRENT CONDITIONS with warm, dry summers and cool, wet winters. The Pacific Ocean and the Cascade Mountains moderates the climate, resulting in mild winters, with most of the precipitation in the basin falling as rain. The Cascade Mountains tend to shield the area from colder, arctic air masses, while also increasing the tendency for rainfall. Approximately 78 % of the precipitation in the area falls between October and April (see Figure 4-3). Mean annual precipitation is 40.7 inches per year (USGS,1999). Typical rain storms of the region arrive from the west or southwest as large frontal storms and are generally low in intensity and long in duration (LPWMC, 1992). Average annual snowfall is approximately 8.7 inches per year (WRCC, 2003). Figure 4-4 shows the long-term rainfall for the precipitation gauge at the McMillan Reservoir in the potholes area. In most parts of western Washington, floods generally occur in late fall and in winter as a result of prolonged rainstorms. These floods may be augmented by water from snowmelt if rain falls on snow. The rain-on-snow floods are usually of short duration. In basins at higher elevations, floods may occur in the spring as a result of rapid snowmelt. These floods are usually of longer duration than the winter floods (USGS, 1998). 7 6 Average Monthly Rainfall (inches) Oct Nov Dec Jan Feb Mar Apr May Jun Jul Aug Sep Month Figure 4-3 Average Monthly Rainfall at McMillan Reservoir Source: Western Regional Climate Center Pierce County Public Works & Utilities 4-9
72 CURRENT CONDITIONS Total Annual Rainfall (inches) Year Figure 4-4 Historic Annual Precipitation at McMillan Reservoir 4.2 Land Use and Population Land Use To assess the hydrologic characteristics of a basin and to determine the potential for water quality problems requires an accurate understanding of a basin s existing and proposed land uses. Various land uses have different effects on the water quality and the hydrologic components of a watershed. Undeveloped forested land allows for maximum infiltration of rainwater and has the least potential for causing water pollution. Highly developed areas (characterized by large areas of impervious surfaces) whether residential, commercial, or industrial land uses increase the surface runoff of stormwater, carrying pollutants picked up from the manmade surfaces into the streams and waterways. Increased stormwater discharges frequently erode drainage ditches and stream channels, increase turbidity of stream water, deposit sediment in habitats important to fish and aquatic life, and fill downstream flood storage areas. Poor agricultural practices, such as improperly applied irrigation methods and feeding or watering livestock too close to a stream, can also contribute to water quality problems when the practices increase erosion and disturb soils adjacent to streams. These areas can be significant sources of sediment, fecal coliform bacteria, and nutrients such as nitrate and phosphate. Excess nutrients in water reduce the dissolved oxygen content that fish and other aquatic organisms require. Pierce County Public Works & Utilities
73 CURRENT CONDITIONS Existing Land Use Typical land cover in the Clear/Clarks Creek Basin is a patchwork of grass pastures and lawns associated with a mostly rural/residential landscape. Approximately 45 % of the basin consists of low-density residential areas of houses, with densities generally less than or equal to one dwelling unit per acre (USGS, 1994). Small hobby farms are scattered throughout the basin. Vacant lands and open spaces comprise approximately 22 % of land use. Roadways and highways occupy approximately 12 % of the land. The basin includes the southwestern half of the City of Puyallup, a small portion of the City of Tacoma, and the neighborhoods of Summit and Midland (see Figure 1-2). Much of the City of Puyallup is nearing its ultimate development density (i.e., build out), so future development will likely occur as infill of vacant parcels. Commercial land uses are concentrated primarily along the major transportation corridors within the basin (such as along Meridian Avenue and the SR-512 Interchange near the South Hill Mall). In general, the rural-residential landscape becomes more urbanized closer to the Cities of Puyallup and Tacoma, to the South Hill Mall, and along Meridian Avenue and River Road. Development Patterns General land use patterns within the Clear/Clarks Creek Basin are shown in Figure 4-5. A considerable portion of the City of Puyallup (the City limits are shown as a dashed outline in Figure 4-5) lies within the northeastern corner of the Clear/Clarks Creek Basin. Medium-density residential developments, schools, and commercial land uses dominate this area. Commercial businesses are located primarily along Meridian Avenue (SR 161), Stewart Avenue, and at the interchange of Pioneer Way with SR 161. These areas have been central focus points for development. Other significant commercial developments within the basin include the South Hill Mall and the Summit County Center, located at SR 512/31st Avenue SW and Canyon Road/SR 512, respectively. Public open space facilities and parks include the Western Washington Fairgrounds, Clarks Creek Park (both located within the City of Puyallup), Orangegate Park, DeCoursey Park in Puyallup, and Swan Creek Park (undeveloped). Thun Field, also known as the Pierce County Airport, lies partly within the southernmost portion of the Clear/Clarks Creek Basin, in the Pothole area. The heaviest concentrations of agricultural activities within the basin, mainly small farms, are located primarily between Pioneer Way East and River Road (SR 167), in the northern portion of the Clear/Clarks Creek Basin. However, there are numerous small hobby farms located within the flatter, uplands areas of the Clear and Clarks Creeks tributaries (Swan, Rody, Diru, Woodland, and Canyon Creeks). As described previously, most of the streams within the Clear/Clarks Creek Basin flow through steep canyons as they drain from the upland areas to the south, and then flow north toward the Puyallup River valley and the low-lying floodplains. Due to the steep topography of the canyons, most of the canyon areas have remained in large lots with buildings setback away from canyon rims. The exceptions include two large quarry areas, one along Canyon Creek and one along Rody Creek. The southeastern portion of the Clear/Clarks Creek Basin (South Hill) is experiencing rapid development, as are many other areas in Pierce County and the Puget Sound region. This portion of the basin contains some of last few large undeveloped parcels of land that are zoned for Moderate Density Single Family Residential use in the basin. The Meridian (SR-161) and SR- Pierce County Public Works & Utilities
74 CURRENT CONDITIONS 512 highway corridors have both contributed to recent development in this portion of the watershed. Future Land Use The Comprehensive Plan for Pierce County, Washington (County Comprehensive Plan) (Pierce County, March 1999) was developed and adopted in 1994 in response to the requirements of the Washington State Growth Management Act (GMA), as described in Section 2.1. The County Comprehensive Plan seeks to obtain and balance 13 different planning goals. These goals include reducing sprawl while still encouraging development, providing public facilities and services to support development, protecting the environment while protecting property owners rights, promoting economic development, preserving archeological and historical sites, artifacts and structures, and processing permits in a timely manner, while at the same time encouraging citizen participation in the planning process (Pierce County, March 1999). The County Comprehensive Plan, codified as Title 19A of the Pierce County Code, divides the Clear/Clarks Creek Basin into rural areas and urban growth areas. The Land Use Element of the Pierce County Comprehensive Plan includes a growth and development strategy on how and where development will occur in the future. It is important to consider the proximity of existing surface water within the basin to future designated Employment Centers, Commercial Centers, Mixed-Use Districts, Moderate Density and High- Density Residential Districts, and Rural Activity Centers. The future land use designations that lie within the Clear/Clarks Creek Basin are described in the following sections. Figure 4-6 shows their geographic locations. As shown in Figure 4-6, most of the basin is currently zoned for agricultural or rural residential development and moderate-density single-family development. The entire northwestern portion of the basin is designated as Rural Separator or Agricultural lands. Most of the creeks run through lands that are zoned for such lower intensity land uses. There are large parcels of land throughout the basin that have been platted for development but have remained undeveloped for several years. As land is developed, the off-site stormwater drainage system, built and natural, will be affected. The subdivision developments would increase population and the number of automobiles in the basin; require construction of new roads; and add large amounts of new impervious surfaces. These impacts will cumulatively increase sources of nonpoint water pollution, duration of erosive stream flow velocity, peak stormwater runoff rates, and the volume of stormwater runoff. Commercial and industrial land uses will have similar effects. In response to the changes, Chapter Six of this plan forecasts the volume of stormwater we can expect given planned land uses, and the ability of the drainage system to accommodate the projected Pierce County Public Works & Utilities
75 É ÊÌË Ë`Í Î Ê É Í UV ST! PQR "$#&%('*),+.z $. \ Z[ 2 2 G? op j l mnn p q o C D&E(F*G,H.I J$K L M*N L.O }~ { XY [ U\ Z XY VW U Y Z] o omp omqsrut v2wyx ÿ ü ÏÐ üýþ À û ¾ù ³ µ * ¹ ôõ ú ¾!#" $ %'&)('* À ÑM ¾ ö¼ø L ÔÓL»¼½ Õ K º Ï j ^`_ba c dfe g h#i ÑÒ ý ÓÔ ÿ f g h i*j h.k Õ D EGF H I F'J A B'C $ *. WWX Y } kml n + +,.- / 0-21 ] ^`_ ì$í î ï*ð ñ ò ó ab _ cd $ *. be a #6 5#6 7 T :; 89 RS ÇÈ 567 Å Á NO ÃÆ j ÃÄ PQ Ö Ø Ù Ú*Û Ù Ü *±.² AB?@ wx <=> uv Ý Þ ß à á*â à ã Õ rs t «ª Ñ ÑM L 4 ÔÓL Õ * K j 23 //01 ä å æ&ç(è*é,ê.ë y z { } ~* }. é î èfå ì ï é î å ì.ßùÿ å»ß'þ á ÿ ê ñfáfæfå ì ô à ì èfå ë ß é Þ àáþ è»ß ÿ ô öúå Þ î ì ê åfæ þ ì à è ìèþ å î ß Ü<Ý'Þ ß`àÁÞ áfâäãfåfáfæmç ßfè é)ê.ëäë è ì í'þ å î ï ð áfæfñ»ß à ì Þ å î Ü æfñ»í#å àáþ ê á òäó èfáõô ó å»ífè ïáö è»ß ê ñ ìbí#èäãfåfáfæ»ß ñfø î Þ íù úî å»í#è»ß ïáö è î Þ â Þ ê ñ»ß é èfá à è ì ß ö è»ß'þ æfèfá àáþ å î ûúìáåfá»ß ófê ì à å àbþ ê á ï é ê.ëäë ñfá Þ ífå àbþ ê á ï ç àáþ î Þ àáþ è»ß ü?å»í#åfá à ï ç áfæfè ý Þ áfèfæ ª «` ` ± ` ³²` ` µ ¹»º ¼ ½b¾ ÁÀ  à ¾ Ä Ã ÅfÆ.ÇÈ É Ê Ë Ì Í Ã ½ Ë Â É Î Ï Ð Ñ Ò Î Ó.Ô ¼ ½ ¾ ¾ à ½ ¾ Ë Ä Ä Ä Õb¾ à ½ b ¾ Ë Ö Ø ¼ ½b¾ Ù ¼b¾ Ä Ú#Ò Û Û Ñ#¼
76 Y U Z a j j :; ƒ Œ Ž Œ Ž Œ Š ˆ žÿ ÇÈ PQR ST UV <=>?@ AB j õô z uv wx ƒ Ÿ ž}»¼½ Ï j Õ ÔÓ! ÉÊÌË Ë`ÍÎ Ê É Í "$#&%('*), G š œ? XY Z] [\ XY VW U ] ^`_ a b _ c d b e f ghi*j h.k + +,.- /0-21 $ šœ. o q p po n lmn C D&E(F*G,H.I J$KLM*N L.O $ *. \ [Z WXY W ³ µœ * ¹ º ^`_ba c dfe gh#i ƒ ~} { kmln ÿ ý ÿ üýþ ü û À ¾ ú ¼ø¾ù ö À ¾ AB'C o omp omqsrut v2wyx MÑ L ÔLÓ Õ K ì$íîï*ðñòœó DEGF H I F'J!#"$%'&)('* $ ƒ *. ˆ ÒÑ ÐÏ #6 5#67 ÃÆ Å ÃÄ Á 4 23 T RS QP NO Ö ØŒÙÚ*Û Ù Ü rst Š ŠŒ *Ž Õ Ñ MÑ L ÔLÓ Õ K Œ *±.² Ý Þ ßŒàá*â à ã «ª /01 / ä å æ&ç(è*é,ê.ë y z {}~* }. ñœî à#ãfß ñœî ã'ß é ã éœì ä ò»ýåäæ#ãfß ô úþ ß à»ãó é ñ2ìþbìà.é åý ú?ü?ùœãåìî ß ò#ã»æ êœß Þ àfßèìã#î é Ü ÝfÞ Ý'ß àâááãåäæèçé»à êëfßèì íáý#î Þ Ýfß ã#î ï ã.é#þ à'ß<ðî ãåä#äà»æèñåòó)ógýåä#ìþ ô õ2ìëåöø œàœäbéœìþ ôùœà.éœìæ»àåäèþbìã#î# 2ìé#Þ ßì íþ ï ò#æ#à'ß ãfþ àè œàåäbéœìþ ô2úøì äë#î à Ǜ ãóûìî ô ç ß ü#ãœäøýœàåìëåöáü#ò'ßèöáò#ò#æèñœàåäþ àfß ï ã#þ ò'ß<ç ß ü#ãåäøñœàåäþ àfß ùœý'ß ã»î»úàåÿáã'ß ãfþ ò'ß ùœý'ß ã»î#ýœàåìëåöáü#ò'ßèöáò#ò#æèñœàåäþ àfß ï)ì»à#æèçé»àè 2ìé#Þ ßÈì íþ GóûÿÁî ò#ô'ógàœäèþ ñœàœäèþ à'ß GóûÿÁî ò#ô'ógàœäèþ <ã.é»à#æûð<î ãåä#äáà#æèñœòó)ógýåä#ìþ ô ï à#æåì íáã»îü ãí»ìî ìþáìà.é ñœòó)ógýåä»ìþ ôñœàåäèþ à'ß ª «` ` ± ` ³²` ` µ ¹»º ¼ ½b¾ ÁÀ  à ¾ Ä ÃÅfÆ.ÇÈ É Ê Ë Ì Í Ã ½ Ë Â É Î Ï Ð Ñ Ò Î Ó.Ô ¼ ½ ¾ ¾ à ½ ¾ Ë Ä Ä Ä Õb¾ à ½ b¾ Ë Ö Ø¼ ½b¾ Ù ¼b¾ Ä Ú#Ò Û Û Ñ#¼
77 CURRENT CONDITIONS stormwater runoff. It recommends various facilities and projects to manage the stormwater without significant flooding and loss of property. Chapter Seven analyzes water quality and recommends projects and programs to keep stormwater, either discharged into the natural drainage system or infiltrating into the ground, within the State water quality standards and the terms of Pierce County s stormwater NPDES permit. Chapter Eight examines projected stormwater flows and current habitat problems due to drainage facilities or stormwater for their effects on fish habitat. Then projects are recommended to correct existing problems and problems that can be anticipated as the basin develops. The following land uses are planned for the Clear/Clarks Creek Basin. Employment Centers An employment center is a concentration of office parks, manufacturing, other industrial development, or a combination of activities. These areas are likely to be developed to their maximum allowable densities. Any vacant and undeveloped land will probably be absorbed. Eventually these areas will have to expand or new centers will be designated. Employment centers within the Clear/Clarks Creek Basin include: Sunrise Parkway East, between 122nd Avenue and 134th Avenue Thun Field (Pierce County Airport) and adjacent areas Community Centers A community center has as its focus a significant commercial traffic generator around which develops a concentration of commercial and some high-density multi-family developments. One community center has been designated within the basin: Canyon Road: Canyon Road East at 112th Street Rural Centers Rural centers are concentrations of shopping, services, and employment in rural areas. Pierce County recognizes three different types of rural centers: rural activity centers, rural neighborhood centers, and rural gateway communities. Rural neighborhood centers are the only type designated within the Clear/Clarks Creek Basin. The two rural neighborhood centers within the Clear/Clarks Creek Basin are as follows: Canyon Road East and 84th Street East Waller Road East and 72nd Street East Urban Neighborhood Centers An urban neighborhood center is a concentrated mix of small-scale retail and service commercial and office development that serves the daily needs of residents within the immediate neighborhood. Residential development at various densities may occur within the center. One urban neighborhood center lies within the Clear/Clark Creek Basin: Southwest corner of intersection of 39th Avenue SW and 94th Avenue East Pierce County Public Works & Utilities
78 CURRENT CONDITIONS Mixed-Use Districts Mixed-use districts are concentrations of commercial, office, and multi-family developments located along major arterials, state highways, highways, and major transit routes. These areas cater to a customer base beyond the surrounding neighborhoods or community because of their placement near major transportation routes. Several mixed-use districts are designated within the basin: Meridian East (SR 161) between 120th Street East and 160th Street East 112th Street East between Canyon Road and Woodland Avenue 112th Street East between Portland Avenue and Swan Creek Portland Avenue between SR 512 and 93rd Street 76th Avenue East between River Road and 56th Street Portland Avenue E at 85th Street E South of 72nd Street from 18th Avenue E to 9th Avenue E High-Density Residential Districts High-density residential districts are composed of multi-family and high-density single-family housing, located within walking distance of a major roadway. Only two small high-density residential districts are designated within the Clear/Clarks Creek Basin: Between SR 512 and 112th Street East from Swan Creek to Vickery Avenue Northwest corner of Meridian East (SR 161) and 136th Street Moderate-Density Single-Family Residential More than one-third of the Clear/Clarks Creek Basin is designated moderate-density singlefamily residential. Geographic areas that fall outside of a designated center or district, as described above, are designated moderate-density single-family residential. This designation provides for single-family and two-family dwelling units: From Woodland Avenue to the eastern edge of the basin, excluding the City of Puyallup and the above-mentioned areas From 20th Avenue E to the western edge of basin Rural Separator Almost half of the Clear/Clarks Creek Basin is designated Rural Separator. It includes rural lands planned to buffer or separate between urban growth areas. In this case, areas designated Rural Separator within the Clear/Clarks Creek Basin act as a buffer between the Cities of Tacoma and Puyallup. Within these areas, low to moderate residential densities and rural activities, such as agriculture, are encouraged. Rural areas are to contain diverse housing opportunities, through a mix of large lots and clustering of housing: West of Woodland Avenue E to the Roosevelt Ditch drainage, from the Puyallup River on the north to the southern end of the basin excluding the SR-512 corridor and the specific areas mentioned above Pierce County Public Works & Utilities
79 CURRENT CONDITIONS Community Planning Efforts Three community plan areas lie within the boundaries of the Clear/Clarks Creek Basin: the Mid- County Communities Plan area, the South Hill Community Plan area, and a small portion of the Parkland-Spanaway-Midland Communities Plan area. The community planning process uses the Pierce County Comprehensive Plan as a foundation and allows citizens to make specific recommendations regarding such things as special areas to protect, infrastructure and transportation design features, commercial and large-scale housing design, and certain land use patterns; things that can directly affect surface water and groundwater resources. See Chapter Two for detail about the community plans in the basin. Impervious Surface Analysis The basin characterization estimates the total impervious surface area of the watershed. This enables conceptual computer modeling activities to accurately simulate the rainfall-runoff relationships within a watershed. A conceptual hydrologic model requires accurate quantification of the amount of impervious surfaces within each basin and subbasin to predict existing and future flow patterns within a watershed (USGS, 1994). One of the primary physical attributes used for a watershed is the calculated effective impervious area (EIA). As described in Appendix D of Pierce County s Guidance for Basin Planning (Pierce County Water Programs, 2000), the EIA considers the fact that some impervious areas are hydraulically connected to others, allowing for a quicker response to rainfall events (PCWP, 2000). The basic hydrologic principles of the runoff cycle include surface retention at the land surface, flow from hillsides to the stream channels, flow in the stream channels to the mouth, and interaction of surface water with groundwater. As a basin becomes developed, hydrologic characteristics are altered due to construction of impervious surfaces and structures, compaction of soils, and stream channel modifications. Trees and grasslands are removed, and soils become compacted for paving and by grading for roads and buildings. Also, natural drainage features are also often replaced with man-made pipes and channels. Therefore, when rain falls on the land surface, the amount of natural infiltration and storage is reduced, increasing the volume of surface runoff into stream channels. Flows are transmitted at higher rates and more quickly to the natural stream channels. When rainfall exceeds the infiltrative capacity of the soil, a process called Horton overland flow occurs. This results in an increase in the peak flow rates in the streams and channels, which in turn increases the potential for erosion and flooding. For the Clear/Clarks Creek Basin, the existing percent EIA for the 48 subbasins was computed assuming land use as shown in Figure 4-5 and future percent EIA values were computed assuming that the zoning as shown in Figure 4-6 would be fully realized. The impervious surface analysis is described in Appendix D. Table 4-1 shows the existing and future land-use condition EIA for each subbasin. The data show that under the existing conditions, the EIA is estimated to be 19 % for the Clear Creek basin, 25 % for the Clarks Creek Basin, 27 % for the Pothole Basin, and 31 % for the Roosevelt Ditch area. The Clarks Creek Basin includes much of the City of Puyallup and the South Hill Mall commercial area. The Pothole Basin also contains a significant amount of commercial area along Meridian Avenue, and a significant amount of medium-density residential development. The overall EIA for the Clear/Clarks Creek Basin is approximately 23 %. Pierce County Public Works & Utilities
80 CURRENT CONDITIONS TABLE 4-1 Existing and Future Land-Use Conditions EIA Subbasin Name Existing % EIA Future % EIA Difference in % EIA Roosevelt Ditch Swan Creek Squally Creek Canyon Creek Clear Creek Overall Clear Creek Basin Rody Creek Diru Creek Woodland Creek Clarks Creek Overall Clarks Creek Basin th Avenue Pothole th Street Pothole th Street Pothole th Street Pothole Lower 144th Street Pothole Upper 144th Street Pothole Afdem Pothole Alderwood Pothole Black Swamp Pothole Candlewood-Manorwood Pothole Capital Pothole Heritage Glen Pothole Meridian Pothole Springfield Pothole South Central Pothole Tip Top Pothole Overall Potholes Basin Overall Total Clear/Clarks Creek Basin Under future land-use conditions, the area of built-out basin is expected to be approximately 25 % for the Clear Creek basin, 35 % for the Clarks Creek basin, 45 % for the Pothole Area, and 46 % for the Roosevelt Ditch area. The EIA for the overall Clear/Clarks Creek Basin is estimated to be 33 %. Table 4-1 shows that there will be more impervious surface area in the basin than under Pierce County Public Works & Utilities
81 CURRENT CONDITIONS current conditions. T his may lead to more flooding and water quality problems unless appropriate stormwater controls are used as the areas develop. The majority of the increases occur in the Pothole Basin and Clarks Creek Basin Population Current Population Population estimates in the Clear/Clarks Creek Basin for 1990 were prepared by CH2M HILL using 1990 census block group data from the U.S. Census Bureau website (U.S. Census Bureau, 2002). The 1990 population figures were estimated from the 22 individual census block groups located within the Clear/Clarks Creek Basin, and the 38 census block groups partially located within the Clear/Clarks Creek Basin boundaries. Populations of block groups that were partially located within the basin were estimated using aerial photographs or by multiplying the total block group population by the percentage of the block group located within the basin. Using the process described above, population within the basin was estimated to be 44,466 and 61,704 in 1990 and 2000 respectively. Figure 4-7 shows the current population estimate for Pierce County and the Clear/Clarks Creek basin. According to the U.S. Census Bureau, population in the Clear/Clarks Creek basin increased by 39% between 1990 and 2000, an annual compounded increase of 3.33 %. Future Population Pierce County has experienced substantial growth in previous years and is expected to support more growth over the next 30 years. From a 1990 population of 586,203, Pierce County grew by 20 % to 700,820 in 2000 (U.S. Census, 1990 and 2000). According to the Puget Sound Regional Council s (PSRC) long-range population forecasts for the Forecast Analysis Zones (FAZs) within Pierce County, the County is expected increase 16 % to 812,859, by the year 2010 (PSRC, 2002). According to the 2001 Population and Employment Forecasts report for the Central Puget Sound Region, Pierce County is expected to reach the following populations in the years 2010, 2020, and 2030 (PSRC, October 2001): 2010: 812, : 892, : 951,747 Future population projections for Pierce County can help to predict future populations within the Clear/Clarks Creek Basin. The estimated 1990 population in the Clear/Clarks Creek Basin was 44,466, which represented about 7.6 % of the total county population of 586,203 in In 2000, the estimated population in the Clear/Clarks Creek Basin was 61,704, which represented about 8.8 % of the total county population of 700,820 in Assuming that the Clear/Clarks Creek Basin will continue to capture at least 8 % of the county s growth, it is predicted that in 2010, the population residing in Clear/Clarks Creek Basin will be approximately 65,000 and 71,000 people in Figure 4-7 shows the future population estimate for Pierce County and the Clear/Clarks Creek Basin. Pierce County Public Works & Utilities
82 CURRENT CONDITIONS 1,000, , , ,000 Population 600, , , , , , , , , , , ,704 65,028 71,385 76,139 44, Year Clear/Clark Creek Basin Figure 4-7 Population Trends in Clear/Clarks Creek Basin Pierce County (Including Clear/Clarks Creek Basin) 4.3 Natural and Constructed Drainage This section presents an overview of the Clear/Clarks Creek Basin drainage system and describes the natural and constructed drainage characteristics and features within each subbasin. It also presents brief discussions of historical and current stream flow monitoring and the influences of groundwater on the stream systems Drainage Overview The Clear/Clarks Creek Basin drains approximately 32.7 square miles, including the 8.3-squaremile Pothole area and 1.0-square-mile Roosevelt Ditch drainage area. The natural stream channels of the Clear/Clarks Creek Basin system include approximately 33 miles of streams, according to Pierce County s 2002 GIS hydro coverage. The Clear/Clarks Creek Basin streams drain part of the Lower Puyallup sub-watershed (in Water Resources Inventory Area No.10 Puyallup-White). Both Clear Creek and Clarks Creek flow from the northern slope of the hillside between east Tacoma and southwest Puyallup. The two drainage basins converge with the Puyallup River within three miles of salt water. Tidal fluctuations in the river cause regular backwater flows at the mouths of these streams. The Clear Creek drainage contains four subbasins as follows: 1. Swan Creek 2. Squally Creek 3. Canyon Creek, and 4. East and West Forks of Clear Creek Pierce County Public Works & Utilities
83 CURRENT CONDITIONS Clear Creek also drains some of the flat agricultural area south of the Puyallup River. The Clarks Creek basin also has four subbasins in unincorporated County: 1. Rody Creek 2. Diru Creek 3. Woodland Creek 4. Clarks Creek Each of these creeks flows north and joins Clarks Creek near the toe of the slope encasing the Puyallup River valley. Clarks Creek flows generally northwest from Maplewood Springs located in the City of Puyallup and continues north after reaching the Puyallup River floodplain, joining the river at river mile (RM) 5.8. Another tributary, Meeker Ditch, lies entirely within the City of Puyallup. Meeker Ditch drains area surrounding and including the Puyallup fair grounds and the Silver Creek drainage area of South Hill. Meeker Ditch then flows west to where it joins Clarks Creek just above the developed portion of the City s DeCoursey Park. Figure 4-8 shows the boundaries and locations of the drainage subbasins. Streams generally flow from south to north in relatively parallel alignments. Clear Creek and Clarks Creek streams can be separated into upper, middle, and lower sections. The headwaters of the streams typically lie within rolling moderately sloped upland areas south of SR-512. Flowing north, the creeks enter deeply entrenched canyons with actively down-cutting channels, and emerge onto the flat Puyallup River valley. The lower sections, in the floodplain of the Puyallup River, are low in gradient and flow though ditch-like channels. Groundwater contributes to perennial stream flow as discharge from seeps and springs where the densely compacted till layer intersects with stream channels. Groundwater provides perennial flows in the creeks. Upstream from these points, flow frequently disappears during late summer. Groundwater characteristics are discussed in Section Numerous wetlands in the basin help to control the volume of peak stormwater runoff by storing stormwater that otherwise would runoff; this can mitigate down-cutting of stream channels and the sedimentation of streams so damaging to fish and other aquatic species habitat. Floodwater storage is especially relevant in the eight potholes in the Clear/Clarks Creek Basin where there are no surface water drainage outlets. Wetlands also have sociocultural value in offering educational and recreational opportunities and aesthetic value to public and private landowners. The distribution and habitat benefits of wetlands in the Clear/Clarks Creek Basin are discussed in detail in Section The Potholes Basin consists of 16 individual basins. Each drains to a central depression where runoff infiltrates to ground water. Runoff often collects within the areas of lowest elevation until the stormwater can percolate into the ground. During extreme storm events, collected stormwater can overflow into an adjacent pothole. The Roosevelt Ditch drainage area is an extension of the City of Tacoma s T-Street Gulch drainage basin. Roosevelt Ditch is a man-made channel that carries urban runoff to the T-Street Pierce County Public Works & Utilities
84 CURRENT CONDITIONS Gulch drainage system. The T-Street Gulch flows to the Lower Puyallup River west of Clear Creek Natural Drainage System This section describes the natural drainage system of the Clear/Clarks Creek drainages. This section also includes a general discussion on land use to provide a context in describing the natural system as it exists today. Clear Creek Basin The Clear Creek subbasin has the largest tributary area of the drainage subbasins in the Clear/Clarks Creek Basin, draining 5.8 square miles of primarily rural residential land, with large plots of open resource and agricultural land (see Figure 4-5), most of which are in the lower floodplain areas and flanking hillsides. There are several large plots of open space designated as parks and a power line right-of-way in the middle section of the subbasin along Pipeline Road. The upper reach of Clear Creek begins at the headwaters south of SR-512 in the vicinity of a wetland area between 40th Avenue East and 50th Avenue East and ends at Pioneer Way East. From the headwaters, Clear Creek flows north through rolling hills and uplands areas. There are an East Fork and a West Fork of Clear Creek. The forks flow through small channels south of 84th Street. The West Fork passes under the large substation between Pipeline Road and 80th Street East via a 52-inch culvert. Between 84th Street East and where the East Fork and the West Fork combine near 61st Street East, the stream channels become increasingly defined with steep side slopes. South of 72nd Street East, the streams begin flowing through deep canyons before discharging into the lower reach near Pioneer Way and 46th Avenue East. The Trout Lodge Fish Hatchery is located near the confluence with Canyon Creek just upstream of the culvert under Pioneer Way. The lower Clear Creek mainstem extends west along the toe of the hill slope parallel to the Puyallup River, collecting drainage from Canyon, Squally, and Swan Creeks before joining the Puyallup River near I-5 at river mile (RM) 2.6. The lower reach begins where Canyon Creek enters Clear Creek, at Pioneer Way and Canyon Road East, and continues to the mouth of Clear Creek at the Puyallup River. Clear Creek parallels Pioneer Way as it flows northwest and is joined by Squally Creek. Most of the lower section of the stream has been channelized through the farmlands alongside the Burlington Northern Santa Fe railroad right-of-way. Lower Clear Creek also drains much of the low-lying farmlands north of Pioneer Way and south of the Puyallup River. This primarily agricultural area contains numerous constructed ditches and channels that convey water to Clear Creek. Pierce County Public Works & Utilities
85 [ W \ c 789 :; <=! ƒ } } Ž ˆ Ž Œ Š ˆ $ ÉÊ RST UV WX >?@ AB CD ö { wx yz ƒ } } } Ÿ~ ½¾? Q V _ ] i? j? Q i Ñ + * ( ÖÕ " # $&%('*),+.-0/ ËÌÎÍ ÍbÏÐ Ì Ë Ï h,<-d/b028 0 i[ j@?k???q?v?[?@?_?] Qk Q? QQ QV Q[ Q@,.-/102/ ,!8 9 3;: 7 5</#9=5<>2?@? A15!>B8 9 3;CD5EC:F5</ 7 5!:F:63 A15!>B8 9 3;CD5EC:F5</ 7 5!:F:HG :F5<I8 /;C9-/JAB8 :F:LKM0B8 NO?P,.-/B02? :F5<I8 /;C9-/JAB8 :F:LKM0B8 NO?P,.-/B02Q,!8 /B5<N!8 5RS0#8 NO? K<,<>#8 /;CTL8 5<:F02,.-/10U? K<,<>#8 /;CTL8 5<:F02,.-/10UQ K<,<>#8 /;CTL8 5<:F02,.-/10UV 9W5!>1>31/ 7 5MK.-X#9WA K.-X#9=AY465<>#8 0#8 3;/JZU?[V >102K9\5 RO3;:F:F5!>J>B0J5M,.-/B02? RO3;:F:F5!>J>B0J5M,.-/B02Q RO3;:F:F5!>J>B0J5M,.-/B02V RO3;:F:F5!>J>B0J5M,.-/B02[??QW9WA2K9\5M,.-/B02Q ][W9WAY3;NM5W^<?Q_W9WA2K9\5 7 31/10B:F5R`-D-D0^ 4P31/;->R`-D-0J,.-/10UV G 4\-DXB/#9318 /J,31>1aJ5.3;K9\,<-D/B02Q >;-0Bb 7 >B5<5<a 3;TF0B5.4c,.-/10 A15<46:d- 7 aj,.-/102,.-/10 7 KRO3;/ 7 >#e K<5<0#8 4\5!/#9\,<-D/B0 7 31/10B:F5R`-D-D0^ 4P31/;->R`-D-0J,.-/10UV 3 K.fX31:F:Fb 7 >B5<5<a2,.-/10 R`-D-D0B:=3;/B0`3;NMTF:d-D-0 7 -D/g9W>1-D:H,<A#Q 4 4 I š œaž Z[ \_ ]^ Z[ XY W _ `ba c d a e f d g %8 7%89 h ijk,l j0m - -.0/12 /43 &š œž 0Ÿ q s r rq p nop E F(G*H,I.J0K L&MNO,P N0Q &, 0 ^ ]\ YZ[ Y µ ~ Ž ¹,º» ¼ `badc e fhg i!j%k } ƒ ~ } lnm!o ÅÈ Ç ÅÆ ÃÄ ÿ þÿ þ ý V TU SR PQ Ø Ù~ÚŽÛÜ,Ý Û Þ Â ÁÀ ü ¾úÀû øù ªb«h d tuv  ÀÁ Œ~ŒŽ, :<;>=?A@B BCD)E p pnq pnrtsvu w4xzy OÓ N ÖNÕ M î&ïðñ,òóôžõ Ó OÓ N ÖNÕ M ß à~ážâã,ä â å æ ç~è(é*ê,ë.ì0í FGIHJ K H)L " #%$&')(+*), ƒ&, ˆ0 Š ~ Ž±²,³ ±0 «ª ÔÓ ÒÑ { ~}, 0!! #" þíù!ú>é ç 4ãèç ûè æšï³è ç é ç å ç æ>ê +æ>å æûå ç ñ!û û ç é å ãè>å ç ñû îíæ!ò>ç ôüæû>å èå ç ñû è>å æã ù!è>é ç å ý þÿç!æê üç û üòç èôüæå æãÿèûòãæè>å æã ó é æ!èãdö ó é è>ãd )êøëíèê>ç ûüëíñù!ûòè>ã ý ó é æ!èãdö ó é è>ãd )êøîíùú!úèêç ûšëíñù!ûòèãçç æ>ê îiå ãæ!èôõê ó ç å ç æ>ê ëíìîíïvðè>ç é ãñè!ò âäãdå æ>ãçç è>é ê ± ² ² ²³² µbµ µ µ µbµ µ µbµ µ¹ bºbº» ¼ ¼ ½ ¾ ÁÀ  ¼ ÃdÄ ÅÇƼ È ¾É Ä Ê ÉËhÌ0ÍÎÅ Ï Ð Ñ Ò Ó É Ã Ñ È Ï ¼ Ô Õ Ö Ø Ô ¼ Ù0Ú ½ ¼ Â Ã Ä ¼ Ä É Ã Å Ä Ñ ¼ Ê Ê Ê ÛdÄ É Ã ÅdÄ Ñ Ü¾Ý Þ ÃdÄ ß ÂdÄ Ê à%ø á á %Â Ý & % &( ( ( & ) % & '
86 CURRENT CONDITIONS The area is also in the Clear Creek floodplain and is considered a flood hazard area (TT/KCM, 2001). The stream flows through these floodplain areas and some localized ponding areas with standing water, as it joins with Swan Creek and then discharges into the Puyallup River. The Puyallup River is tidally influenced upstream of the mouth of Clear Creek. Daily tidal fluctuations and flow conditions in the Puyallup River affect the water level within the creek. Before floodgates were installed at the mouth of the Clear Creek, high tides and flooding in the Puyallup River would back water up into the Clear Creek channel. This backwater condition prevented Clear Creek from discharging to the river and resulted in extensive flooding in the Clear Creek. Canyon Creek is the eastern-most tributary to Clear Creek, and drains an area of 2.2 square miles. The basin is substantially developed, with a string of commercial areas located along Canyon Road East and a concentration of commercial and light manufacturing in the vicinity of Canyon Road East and 112th Street East. There are two large gravel quarries along the lower section of Canyon Creek south of 72nd Street East. The headwaters of Canyon Creek are in lowlying wetland areas north of 128th Street East. The creek flows though the rolling hills of the upper reaches in moderately confined channel and through a series of culverts as it crosses under SR-512 and other arterial roads. The mainstem of Canyon Creek parallels Canyon Road East and connects with the west fork of the creek near the 90th Street crossing. The west fork originates north of 112th Street East and parallels 52nd Avenue East. From the 90th Street East confluence, Canyon Creek flows through various pipes and confined channels, and then enters the steep canyon just upstream of 72nd Street East. Flows continue north, crossing Canyon Road twice near the gravel quarries downstream of 72nd Street East. Canyon Creek then crosses under Pioneer Way East and the Burlington Northern Santa Fe Railroad. From this point, the creek flows northwest through a channelized ditch for approximately 6,000 feet where it discharges to Clear Creeks. Squally Creek is the smallest of the subbasins, with a tributary area 0.9 square miles. This is a moderately developed subbasin, mostly rural residential. The headwaters lie just south of 72nd Street East. The upper section contains a few wetlands and areas of ponding water along the relatively small stream channel in this area. The stream parallels Waller Road East to the west and 36th Street East to the east, and then enters the steep canyon just south of 48th Street East. Squally Creek joins Clear Creek at Pioneer Way. There have been some historical bridge erosion/scour problems with the 48th Street East bridge due to high creek flows and the narrow, confined channel within the canyon area. Swan Creek is the most westerly subbasin within the Clear Creek System. It drains an area of 3.8 square miles. The predominant land use is mostly rural residential neighborhoods, with some small hobby farms scattered throughout middle and upper sections of the subbasin. The headwaters of the stream are located south of 112th Street East near Waller Road (see Figure 4-8). Most of the south end of the basin is becoming increasingly developed with residential communities and commercial areas. The well-defined stream channel begins near 112th and parallels Waller Road as Swan Creek flows across the rolling hills of the uplands, passing under the arterial roads in a series of large culverts. The stream meanders through the uplands until 72nd Street East where it drops into the steep canyon Swan Creek joins Clear Creek north of Pioneer Way. The lower section of the basin through the canyon area is mostly undeveloped Pierce County Public Works & Utilities
87 CURRENT CONDITIONS with parklands. Swan Creek Park is one of the larger parks in the basin, located in the canyon. Approximately 60 acres of the valley drainage area has been redeveloped by the City of Tacoma and Port of Tacoma by converting selected parcels from commercial and residential land uses to a natural resource area due to the construction wetlands for off-channel rearing areas for fish. Clarks Creek Basin The Clarks Creek Basin is the largest of the basins addressed in this plan. It drains approximately 6.5 square miles; 39% of the Clarks Creek Basin lies within the City of Puyallup. Clarks Creek flows generally northwest from South Hill and continues north after reaching the Puyallup River valley, joining the river at RM 5.8. The Clarks Creek watershed includes Diru, Rody, and Woodland Creeks in unincorporated Pierce County, as well as Meeker Ditch in the City of Puyallup. Diru, Woodland, and Rody Creeks flow generally north to their confluence with Clarks Creek near the toe of the hill overlooking the valley. Meeker Ditch drains the area around and east of the Puyallup fair grounds and then flows west to where it joins Clarks Creek just above Puyallup s DeCoursey Park. Clarks Creek originates in wetlands south of 96th Street East and east of Fruitland Avenue East in unincorporated Pierce County. It is primarily fed by Maplewood Springs (See Figure 4-8). The creek flows through the protected Maplewood Springs watershed, a large tract of forested land set aside to protect the City of Puyallup s water supply. The City of Puyallup has an intake at the spring that provides part of the City s water supply. After leaving the Maplewood Springs watershed, the creek descends through a steep canyon to the Puyallup River valley where it passes through the WDFW fish hatchery. The hatchery channels creek water into the facility and discharges to the creek. From the hatchery, Clarks Creek turns to the northwest passing numerous residences and DeCoursey Park. The lower section of the stream north of Pioneer Way meanders through the farmlands in a fairly wide and deep channel that has been modified by adjacent landowners. There are developed lots and small hobby farms adjacent to the stream all the way to the mouth at the Puyallup River. The eastern portion of the Clarks Creek subbasin drains the City of Puyallup and the South Hill Mall area. The area around the headwaters is heavily developed with commercial establishments surrounding the mall area. Much of the drainage in the eastern portion of the basin flows through man made conveyance channels and pipes and enters the lower section of Clarks Creek and Meeker Ditch at various points. A storm drain diversion at 15th Avenue SW and S Meridian transfers stormwater from the Clarks Creek Basin to the Mid-Puyallup River Basin. Meeker Ditch drains a substantial portion the City of Puyallup. It has a series of historical water quality problems associated with the fairgrounds and the urban nature of the watershed (Ecology, 1990). Section 4.6 further discusses water quality. Woodland Creek is the second largest subbasin in the Clarks Creek Basin, draining about 1.8 square miles. Basin characteristics are similar to most of the subbasins in the Clear Creek basin. Characteristics include a relatively narrow drainage basin originating in rolling uplands area near SR-512, flow north towards the Puyallup River valley, cutting through the hillside in a narrow, steep canyon as the stream approaches Pioneer Way. The Woodland Creek subbasin is moderately developed, mostly rural residential with large lots and hobby farms, and relatively Pierce County Public Works & Utilities
88 CURRENT CONDITIONS few commercial areas. A large part of the lower area consists of land owned by Washington State University and is used for various agricultural and horticultural programs. The headwaters of Woodland Creek begin near the intersection of 128th Street East and Woodland Avenue East. Much of the upper channel is a roadside drainage ditch along Woodland Avenue East, crossing under SR-512 where Pierce County maintains an active flow gage. From SR-512, the stream is conveyed via a series of confined man-made channels and pipes. A 24-inch pipe conveys flows from just south of 104th Street and Woodland Avenue, to 100th Street. Downstream of 100th Street, the creek again flows through a series of channels and culverts, and then enters the upper edge of its canyon area north of 96th Street. From here, the stream is located between Woodland Avenue to the west, and Fruitland Avenue to the east. The stream leaves the hillside through the Washington State University property, north of Pioneer Way. South of Pioneer Way, the stream becomes channelized and is piped through the agricultural lands owned the university. Woodland Creek joins with the Clarks Creek near DeCoursey Park and the Puyallup Tribe reservation boundary. Diru Creek joins with Clarks Creek north of Pioneer Way at Woodland Avenue East extended. Diru Creek has a drainage area of 1.3 square miles, and like Woodland Creek, is a characteristically narrow drainage basin with steep-sloped canyons between the uplands and the lower section in the Puyallup River valley. Land use throughout this subbasin varies. The lower sections of the subbasin, from the mouth to 80th Street, contains a number of large plots of open space, designated as forested and agricultural land according to the County GIS database. The Puyallup Tribe maintains a fish hatchery at the mouth of Diru Creek, between 72nd Street East and Pioneer Way (see Figure 1-2). From 80th Street East to SR-512, the basin becomes substantially developed with numerous housing developments on small lots. The area from SR- 512 to the headwaters near 128th Street East is mostly rural residential and small hobby farms. However there are a few new developments occurring in the extreme south end of the basin (near 128th Street East) where large vacant lots are being developed with new moderate density housing subdivisions. The headwaters begin in a large wetlands area near 128th Street East. Diru Creek flows from 128th Street East to SR-512 in a natural channel. A 36-inch-diamter culvert conveys streamflow under SR-512. The stream enters an extended reach where it flows through small channels, roadside ditches, storm drain and pipes until it reaches 96th Street East. Below 96th Street East, the creek enters a natural open channel system passing under several arterial streets via large culverts from 96th Street East to 84th Street East, and then enters the steeply sloped canyon area downstream from 84th Street East. North of the canyon area, Diru Creek flows past the hatchery, and then flows through a channelized reach from Pioneer Way East to the confluence with Clarks Creek. Rody Creek is the westernmost subbasin in the Clarks Creek Basin. Several reports refer to this tributary as an unnamed tributary to Clarks Creek (USGS, 1983). Rody Creek s drainage area is approximately 1.2 square miles and consists primarily of rural residential land uses and a few large resource lands, one of which is a large quarry just upstream of 72nd Street East. There are a few areas of new developments occurring in the middle of the basin between 96th Street East and 84th Street East, and some in the headwaters area 128th Street East. The stream channel between the headwaters and SR-512 is not well defined. Downstream of SR-512, stream flows Pierce County Public Works & Utilities

89 CURRENT CONDITIONS are conveyed by a small but well-defined natural channel through residential developments. From 96th Street East through 80th Street East, the channel deepens and Rody Creek flows through the canyon area, passing under busy arterial streets through a series of large culverts. Rody Creek s canyon is extremely deep and narrow. The stream leaves the canyon area at Pioneer Way, flows through the flat agricultural lands until it joins with the main branch of Clarks Creek just upstream of the Burlington Northern Santa Fe Railroad bridge. Potholes Basin The Potholes Basin consists of sixteen (16) separate closed depression areas where stormwater flows to a series of ponds or depressions. Generally, stormwater that reaches the depression collects in a pond and infiltrates into the groundwater or evaporates. However, during large storm events, some of the potholes can overflow to neighboring potholes. For example, South Central Pothole overflows to Springfield Pothole. During an extremely large storm event, the Afdem Pond would overflow to Clarks Creek. Within this terrain of undulating hills, the boundary lines between potholes can be drawn in many ways. Depressions in a pothole that overflow during major storms can be combined with the area to which it overflows or left separate. The 16 potholes identified and illustrated in this basin plan represent the division of potholes existing during the basin characterization phase of this plan s preparation, a snapshot in time. As development occurs and depressions are filled, natural drainage patterns are altered. Therefore, the delineation of potholes probably will change over time. Land within the potholes is becoming increasingly urbanized, with commercial areas along Meridian Avenue and residential subdivisions throughout the basin. The drainage system has been extensively modified with pipes and channels, and a number of regional ponds and infiltration facilities replacing natural drainage courses that have been graded or filled. The constructed drainage system is discussed in the next section. A list of the potholes, their size, overflow paths, and similar characteristics follows: 110th Avenue Pothole receives runoff from 268 acres along 110th Avenue East, between 152nd Street East and 169th Street East. Direction of runoff flow is generally west to a depression located near Meridian Avenue East at approximately 156th Street East. 117th Avenue Pothole is a horseshoe shaped pothole draining 529 acres, extending from 110th Avenue East to immediately east of Military Road East and from approximately 116th Street East on the north to 136th Street East on the south. Direction of runoff flow is generally to the north to a wetland that receives and stores floodwater during storm events. 128th Street Pothole is located to the east of Meridian Avenue East, from approximately 122nd Street East to 136th Street East. 249 acres drain to a nine-acre depression at the intersection of Meridian and 128th Street East. The photograph to the right shows the flooded intersection during the winter of 1996 when the pond flowed over Meridian Avenue. Pierce County Public Works & Utilities


90 CURRENT CONDITIONS 135th Street Pothole is a north-south bearing basin approximately 612 acres located just west of Meridian Avenue E. It borders 94th Avenue East on the west and stretches between 128th Street East and 160th Street East. The area has several interconnected wetland/pothole areas historically connected by ephemeral streams whose floodplains have been filled for building and landscaping purposes. Lower 144th Street Pothole contains 150 acres. It extends from approximately 137th Street East on the north to approximately 150th Street East on the South, from 115th Street East on the west to 123rd Street East on the east. Nearly 25 acres of wetlands provides floodwater storage, a portion of which has standing water year-round. Hemlock Pond is the central depression to which stormwater flows in this pothole. Upper 144th Street Pothole is one of the few potholes with year-round standing water. It drains 313 acres, located between approximately 151st Street East and 168 Street East, east of 122nd Avenue East. Seventeen % of the pothole area (53 acres) is wetlands. Runoff flows to a large wetland just north of Sunrise Parkway. Afdem Pothole consists of 199 acres north of 128th Street East at approximately 80th Avenue East that were significantly modified by years of gravel mining. Since 1999, the gravel mine has been reclaimed and reconfigured for use as a regional stormwater infiltration facility. Little water could have flowed out of this basin given its highly permeable soil. But if it had, the overflow path would have been towards Clarks Creek. Substantially the same configuration exists today. Alderwood Pothole contains several ponds and wetlands including Ates Pond (named for the last property owner) known for standing water year-round with seasonal flooding. The pothole has a drainage area of 307 acres, which are rapidly developing into moderate density residences. Black Swamp Pothole is the largest of the potholes, encompassing 834 acres and several wetlands and depressions that historically stored stormwater. Black Swamp itself, pictured to the right, typically held water all year and extended into adjacent wetlands during storms. It receives overflow from a depression to the east and surface runoff from surrounding Pierce County Public Works & Utilities
91 CURRENT CONDITIONS area during storms. The pothole area starts near SR-512 and extends south to 128th Street East, stretching between Afdem Pothole on the west and the ridge to the west of Meridian Avenue on the east. Candlewood-Manorwood Pothole contains 306 acres, the northern part extending into the City of Puyallup. It extends from 33rd Avenue in the City on the north to 122nd Street East. The area drains to the south-central toward a wetlands and a depression running in a north-south direction to where 122nd Street East exists now. The depression was regularly inundated during storms. Capital Pothole is 120 acres extending across Meridian Avenue East from approximately 120th Street East on the north to 127th Street East on the south. Although records indicate no major flooding in recent years, 1997 and 1998 brought reports of over the road flooding on 123rd Street Court East and private property flooding at 120th Street East to the east of Meridian. Heritage Glen Pothole at 102 acres is the smallest of the potholes. It is located in the center of the potholes drainage, south of 136th Street East to approximately 147th Street East, and from 110th Avenue East on the west to 116th Avenue East. More than six and one-half acres is floodwater storage where stormwater runoff collects and infiltrates. Meridian Street Pothole at 721 acres and shaped like a bean, extends from the ridge just west of Meridian Avenue to as far east as 115th Avenue East, from 136 Street East on the north to 176th Street East. Runoff drains to a depression at Meridian Avenue East and 144th Street East that previously flooded across Meridian. South Central Pothole consists of 210 acres the majority of which is forest and farmland. Normally, stormwater is contained in the pothole, where it infiltrates to groundwater. However, during severe storm events, stormwater exceeds the soil s ability to infiltrate water fast enough and flooding occurs. In the winters of 1996 and 1997, flood water spilled into the neighboring Springfield Pothole. Springfield Pothole is a 223-acre basin. Stormwater in this basin flows to a series of depressions. No natural surface water outlets are present so the only means of exit is evaporation and infiltration. The majority of the basin is medium and high-density residential development. In the winter of 1996/1997, pothole water surface levels reached flood stage, damaging several residences and streets. Tip Top Pothole contains 152 acres that straddle 136th Street East near Military Road East. The depression that provides stormwater storage extends across 26 acres. Roosevelt Ditch The Roosevelt Ditch drainage is located to the west of Swan Creek subbasin with 72nd Street East as its northern border and 91st Street East as its southern border. The subbasin is predominantly comprised of single family density residential homes and small hobby farms. Commercial lots are located along Portland Avenue East. The headwaters of Roosevelt Ditch Pierce County Public Works & Utilities
92 CURRENT CONDITIONS begin just south of 91st Street East with a natural drainage channel running south to north. The channel crosses culverts at 91st Street East, 90th Street East, 88th Street East, 84th Street East, and 80th Street East. From 80th Street East to 72nd Street East, a project completed in 1991 converted Roosevelt Ditch from a natural drainage channel to a straightened ditch with increased capacity. It discharges to City of Tacoma facilities at 72nd Street East, which conveys runoff to the Puyallup River. An unnamed tributary carrying runoff from the west side of the subbasin discharges into Roosevelt Ditch about 1,200 feet south of 72nd Street East. The headwaters for this tributary are located just south of 85th Street East and west of Portland Avenue East. At about the 7600 block of Portland Avenue East, this south-to-north running channel turns east into a 24-inch diameter storm drain. The storm drain extends for approximately 2,000 feet before discharging to Roosevelt Ditch. A second unnamed tributary carries runoff along the west side of 12th Avenue East. It extends south to north before turning east and discharging into the tributary described in the previous paragraph Constructed Drainage System The drainage system of the Clear/Clarks Creek Basin has been extensively modified with stormwater pipes, ditches, detention pipes, stormwater ponds and infiltration facilities. Numerous culverts and bridges have also been constructed throughout the basin at driveway, road and highway crossings. Pierce County recently performed an inventory of all the drainage facilities within the County. Facility locations were determined using a Global Positioning System (GPS) and entered in the County s Geographical Information System (GIS). As part of the inventory, the County identified all drainage facilities within the unincorporated portion Clear/Clarks Creek Basin, including most of the pothole area. The drainage network in the City of Puyallup portion of the Clarks Creek basin is not included in the GIS database. Tables 4-2 and 4-3 summarize the drainage facilities within the Clear/Clarks Creek Basin. The major constructed drainage systems and capital improvement projects (CIP) under construction or in design are described by subbasin in the sections that follow. TABLE 4-2 Drainage Inventory of Pipe or Culvert Diameter a (inches) Length of Pipe (feet) Number of Culverts Length of Detention Pipes (feet) 12 77, ,000 2, , , , , Total 526,000 3,360 5,000 a Includes all pipes up to next nominal pipe size b Pipes oversized to serve a detention purpose, also referred to as vaults. Pierce County Public Works & Utilities
93 CURRENT CONDITIONS TABLE 4-3 Drainage Facilities in Clear/Clarks Creek Basin Facility Type Number of Facilities Detention Ponds 36 Infiltration Basins 22 Water Quality Treatment Ponds 1 Sedimentation Basin a 1 Bioswales b 15 a A pond whose primary function is to provide a quiescent environment that enables suspended particulates to precipitate out of the storm water. b A treatment component of a drainage facility that uses a broad open channel with a gentle slope lined with vegetation to filter pollutants out of stormwater. Clear Creek Basin Drainage Facilities Within the Clear Creek Basin, there are about 13 large storm drainage systems with pipe sizes 24 inches in diameter or greater, and many smaller pipes and channels/ditches conveying stormwater from roadways and developments to stream channels. Of these 13 large systems, six are located within the Swan Creek Basin, one is in the Squally Creek basin, two are in the Clear Creek subbasin, and four are in the Canyon Creek subbasin. Two of these storm drainage systems discharge into large subsurface detention pipes. There are also six large detention ponds and one sedimentation pond in the Clear Creek basin. The larger detention and conveyance systems are described below (see Figure 4-8 for locations). Four large storm drain systems, ranging from 24 to 48 inches in diameter, collect and convey stormwater along Waller Road and adjoining areas, between SR-512 and 80th Street East, and route stormwater to four detention ponds (one for each system). They discharge the stormwater to Swan Creek. A large storm drain along 72nd Street East (24 to 30 inches in diameter) collects runoff from 72nd Street East and adjacent areas and conveys it to a 72-inch-diameter detention pipe that discharges to Swan Creek. An off-channel sedimentation pond was constructed in 1990 just upstream of Pioneer Way at Swan Creek to remove the sediment and gravel that was conveyed down the canyon and formerly blocked culverts. A 52-inch-diameter storm drain conveys the East Fork of Clear Creek under a large substation between 84th Street East and 80th Street East. At the intersection of Canyon Road and Pipeline Road, Canyon Creek flows into the 24- inch storm drain that runs along Canyon Road to 84th Street East. The combined flows from Canyon Creek and the roadway runoff reenter the natural creek channel at 84th Street East. Over the road flooding at 90th Street East has necessitated an existing CIP project to raise 90th Street East and improve conveyance with compensating storage at 84th Street East (Canyon Creek Bypass Project No. D , Pierce County, 2001). Pierce County Public Works & Utilities
94 CURRENT CONDITIONS Squally Creek Detention Pond at 58th Street East and Waller Road East was constructed in 1995, D306, to control flooding and scour of the creek channel. There are two flood gates at the mouth of Clear Creek at the Puyallup River. One is allowed to remain open to permit tidally influenced waters to extend into Clear Creek and Swan Creek and into constructed off-channel wetland areas. The tide gate closes at elevated river stages (TT/KCM, 2001). The other flood gate is a flap gate that permits Clear Creek to discharge into the river, but prevents river flood water from flooding behind the river levee by entering Clear Creek. When the river elevation becomes higher than the Clear Creek water level, the tide gate and flap gate close. Clear Creek has no discharge so flows back up and flood the areas between Pioneer Way and River Road. This area is has experienced considerable and repetitive losses. The flooding problems are discussed further in chapters five and six. Drainage District 14 is located within the Clear Creek basin between 80th Street East and 121st Street East and between Vickery Avenue East and Portland Avenue East. The primary conveyance for this drainage district is Swan Creek (see Figure 4-8). Clarks Creek Basin Within the Clarks Creek Basin, about six large stormwater piping systems with diameters of 24 inches or greater exist, as well as numerous smaller pipes and channels that convey stormwater from roadways and developments to stream channels. Three of these six large systems are located in the Rody Creek subbasin, two in the Woodland Creek drainage area, and one in the lower reach of Clark Creek near the mouth. Three of these large piping systems are oversized detention pipes. There are also 17 large detention ponds and one infiltration basin in the Clarks Creek Basin. Descriptions the larger detention (see Figure 4-8) and conveyance systems follow: A 24-inch-diameter storm drain was constructed along Woodland Avenue in the upper reaches from just south of Pipeline Road and 104th Street East to SR-512. This storm drain conveys stormwater to a 36-inch-diameter detention tank and then to Woodland Creek at 100th Street East. A two-phase project is proposed along 112th Street East and Woodland Avenue East in the Woodland Creek subbasin to alleviate flooding and channel erosion. The first phase has been constructed. The second phase is pending property acquisition. A 24-inch to 30-inch storm drain collects and conveys stormwater from a residential neighborhood along 66th Avenue East to Diru Creek at 90th Street East. A 24-inch storm drain collects and conveys stormwater runoff from a residential neighborhood between 90th Street East and 84th Street East and routes the water to a detention pond in the subdivision before discharging into Diru Creek at 84th Street East. The Rody Creek Detention Facility, is located adjacent to Rody Creek at 90th Street East and 59th Avenue East. This facility functions as a stormwater infiltration basin for 660 acres. Pierce County Public Works & Utilities
95 CURRENT CONDITIONS Potholes Basin In each pothole there is either a combination of independent stormwater systems or systems that transfers stormwater either out of the pothole to a facility in an adjacent pothole or transfers stormwater in a fairly complex manner. Such stormwater systems or facilities found in each of the 16 pothole subbasins may include a series of pipes, detention/retention ponds, floodplains or wetlands. However, there are unique stormwater facilities present; for example, bordering the 135th Street and 128th Street Pothole there is a large 72-inch diameter detention tank near the 132nd Street East and Meridian Avenue East intersection. Although the majority of stormwater pipes found in each pothole are 21-inch diameter or less, there is another larger storm drain trunk line which is situated along 122nd Avenue East near the intersection with 152nd Street East in the north section of the Springfield Pothole. This 24-inch diameter storm drain collects and conveys stormwater to a detention pond called Springfield Pond 3. Over the past decade, State and County regulations have required the installation of stormwater management systems for new development. In the pothole areas, where there is no defined outlet for stormwater, the County has required that new developments retain all excess stormwater volumes on-site. As a result, new developments must infiltrate the additional stormwater runoff volumes created by new impervious areas. This poses a challenge if soils in a particular pothole are not conductive to infiltration. In the potholes basin, infiltration ponds outnumber detention ponds. Detention ponds found in the basin were probably constructed before pothole regulations went into effect. See Figure 4-8 for publicly owned ponds associated with each pothole. The constructed drainage system within the Potholes Basin is largely an interdependent system. Development of a constructed drainage system has resulted in the conveyance of stormwater from internal potholes and depressions to a central location in each pothole. Each of the potholes stormwater conveyance networks are described below. 110th Avenue Pothole. No regional facilities have been constructed in the area. No flooding problems have been reported. 117th Avenue Pothole. No regional facilities have been constructed in the area. No flooding problems have been reported 128th Street Pothole. During significant rainfall events, a low-lying area on 128th Street East, east of Meridian Avenue East experiences flooding and frequent roadway overtopping. The road has been closed several times due to the inadequacy of an existing infiltration trench and numerous drywell systems in the basin. 135th Street Pothole. This basin lies west of Meridian and borders 94th Avenue East between 160th Street East and 128th Street East. The drainage area is composed of several interconnected wetlands/pothole areas. Stormwater generally overflows from filled depressions in a northerly direction to a small public infiltration pond near 128th Street East. During large rainfall events the system gets overwhelmed to the point where several roadways, private driveways, residential structures and septic systems begin to flood. Pierce County Public Works & Utilities
96 CURRENT CONDITIONS Upper 144th Street Pothole. Contributes to the South Hill pumping station. See South Hill Drainage Improvement section. Lower 144th Street Pothole. Contributes to the South Hill pumping station. See South Hill Drainage Improvement section. Afdem Pothole. Afdem Regional Stormwater Infiltration Facility, D325, is a reclaimed gravel pit that consists of a pretreatment pond followed by an infiltration pond. It is situated at the southern end of the Clarks Creek subbasin on the north side of 128th Street East at 86th Avenue East. Although the pond overflow during extreme storm events is to the Clarks Creek headwaters area, the Afdem facility currently serves approximately 1,200 acres of the Clover Creek Basin in addition to approximately 500 acres within the Clarks Creek drainage. Alderwood Pothole. Stormwater from the Alderwood Pothole is channeled to Hemlock Pond and the South Hill Pump Station. Black Swamp Pothole. The Black Swamp basin is approximately 339 acres in area. The terrain would best be described as rolling to undulating. Several low areas (depression storage areas) exist. The highest elevation achieved in the basin is about 440 feet while the lowest elevation is about 340 feet found in the pothole (1929 NGVD). The average slope of the land is approximately 2%, The 1991 comprehensive stormwater management plan identified this area as a potential flood hazard area which held true during the 1996 and 1997 storm events. Several houses in the pothole experienced either flood damage or access problems. Through the scoping process it was determined the best way to deal with the flooding was to purchase homes that had significant flood damage. In 2002 (D133) two duplexes were purchased awaiting their removal for minor grading and fencing work yet to be completed. Candlewood-Manorwood Pothole. The lowest elevations occur within the Candlewood residential area. To protect property, 21-inch storm drains convey stormwater to two infiltration ponds that were constructed by Pierce County in Capital Pothole. No regional facilities have been constructed in the area. No flooding problems have been reported Heritage Glen Pothole. A regional retention pond was constructed in 1995 in response to repetitive flooding in and around the Heritage Glen residential development. Meridian Street Pothole. A Pierce County owned regional retention pond located near the northeast corner of the 144th Street East and Meridian intersection. The regional pond was built in 1990 in response to repetitive flooding on Meridian causing road closures and delays to traffic. The pond was designed for a 25-year event which at that time was the standard for Pierce County. In winter of 1997, the pond was overwhelmed and overtopped onto adjacent properties and caused another road closure on Meridian. Since the pond did not meet the current standard in 1997 of 100-year design it was put on the Pierce County Public Works & Utilities
97 CURRENT CONDITIONS Capital Facilities Plan (D ) for expansion. In 2000, the pond was expanded to accommodate the existing 100-year level of service. South Central Pothole. Future connection to South Hill pumping station. See South Hill Drainage Improvement section. Springfield Pothole. Future connection to South Hill pumping station. See South Hill Drainage Improvement section. Tip Top Pothole. Before the South Hill pumping station project was built this pothole was receiving overflow from the Ates pond in the Alderwood pothole inundating a large portion of the pothole producing structural flooding. Since the pumping station has been built all of the overflows from Ates have been re-routed towards the pumping station which relieves the Tiptop pothole from previous flooding problems. South Hill Drainage Improvements. The South Hill drainage improvement design report (URS, 2001) described several pothole subbasins within the South Hill Drainage Improvement Area Upper 144th Street Pothole, Alderwood Pothole, South Central Pothole, Hemlock Pothole, and Springfield pothole. The design report recommended solutions to connect basins and relieve flooding that occurred during the winters of 1995/1996 and 1996/1997. The recommended solution, which has since been implemented, routes excess stormwater by gravity to Hemlock Ponds (A, B, and C) and then pumps via a new pumping station through a force main to an existing overflow pipeline from the City of Tacoma s McMillan Reservoir directly to the Puyallup River (URS, 2001). Currently, the south hill pumping station receives stormwater from the Upper 144th Street Pothole, Alderwood Pothole and the Hemlock Pothole. The pumping station was designed to accommodate runoff from the South Central Pothole and Springfield Pothole but those basins are not presently connected. The Springfield Pothole project (D ) is currently on the Capital Facilities Plan as a pipeline project that would connect into the Hemlock ponds with construction in The South Central Pothole presently flows to the Springfield ponds but would need minor conveyance upgrades identified under the Springfield project. Additional detailed descriptions of past improvements and/or future improvements can be found in the South Hill Drainage Improvement Design Report (URS 2001). Roosevelt Ditch Drainage Area In the Roosevelt Ditch subbasin, ditch and culvert systems are primarily used to capture and convey runoff from residential areas. These systems drain to natural channels within Roosevelt Ditch or to enclosed storm drain pipe systems on Portland Avenue and 72nd Street East. A 24- inch diameter storm drain conveys runoff west of Portland Avenue to Roosevelt Ditch to the east (see Figure 4-8). At 72nd Street East within the City of Tacoma, Roosevelt Ditch drains to a 48- inch diameter concrete pipe that conveys water through the City of Tacoma T-Street Gulch drainage facilities to the Puyallup River. Pierce County Public Works & Utilities
98 CURRENT CONDITIONS Stream Flow Characteristics The geography, hydrology, and geology of the three basins significantly affect stream flow characteristics. In the glacial till headwaters of Clear and Clarks Creeks, stream channels have gentle slopes and adjacent wetlands and low areas provide water storage (USGS, 1994). Most stream channels in the upper reaches have little or no surface flow from late May through September. Streams have been channelized and are best characterized as grassy ditches. Some of this upland area has potential for groundwater recharge, as evidenced by the gaining nature of the floodplain reaches of the streams (habitat field survey) and information from previous studies (USGS, 1994).A gaining stream is a stream in which flow is increasing due to groundwater inflow. In the middle sections, streams enter deeply entrenched ravines with actively down-cutting channels. During a study of the basins in the early 1990s, USGS observed that the steep slopes provide little storage capacity, resulting in increased stream flow velocities and quick responses to rainstorms (USGS, 1994). USGS also noted that as the streambeds cut through the till hardpan layers and expose the permeable substratum, stream flows are lost throughout the channel bed, which helps recharge the groundwater aquifer (USGS, 1994). Stream flows reappears in the floodplain reaches of the streams from springs or seeps in the sides of the channels. Clarks Creek is an extreme example; flows observed during the habitat field survey in May 2001 increased from one cubic foot per second (cfs) to about 30 cfs within several hundred yards of Maplewood Springs. In-stream flow is important to water quality because the natural continuous flow of the stream provides habitat to riparian life. Streambeds shaped by the meandering flow of the water are better equipped to handle high flows without extreme erosion. Channelized streams that do not experience regular flow have increased occurrences of scouring and erosion increasing the turbidity of the water. Stream Flow Monitoring Stream flow monitoring provides the most accurate means of characterizing hydrologic and water quality conditions in the streams. Stream flow measurements can be used to validate hydrologic models, compute long-term streamflow statistics, and analyze trends in water quality. For this reason, Pierce County Water Programs has established a measurement and water quality monitoring programs to supplement ongoing and past measurement efforts by the USGS and others. Table 4-4 lists the stations where stream flow is measured, including the station identification code, the period of record for the historical and active USGS flow gauges, the two active Pierce County flow gauges, and the three active flow gauges installed by CH2M HILL as part of this study. The table also lists some USGS water quality sampling stations. Figure 4-9 depicts the locations of all these stations. A description of the flow data follows. Pierce County Public Works & Utilities
99 { Ž Ž [\] ± ª ª ² «ª ³² ± «ª Q ÁÂà äåæ çèæ Å vwx bcd Ž,,- + Ë ž rôr ö r ö Ž p p X W RV URV R S T ôóò ˆ PŠ Œ ŽI g 6 Ž g š Ž0 gœ œ gœe 6 š;ži!+-,&( *!%8 # BCD E F FG H I F!+-,&*!%8 $ { yz ìíïî î ðñ í ì ð >? <= 9:; op q9p r+r str r+r+u/r r+r+u/u r swv/u r swx/u r swy/z r swy/u r s+stz r s+str r swu/z r swu/u r+u+z/u r+u+y/u r+u+r/u r+u+r/z r+u+u/z r+u+u/u Y"i j b/k k i/l m\dz n+[ {} g~ws {} g~dr _P3 ~ws _P3 ~dr P og~ws P og~dr _P3ƒ"~ws _P3ƒ"~dr _P3ƒ"~d _P3ƒ"~dy _P3ƒ"~dz _P3ƒ"~d Y"Z [+\ ]^[0_P` a b+c [/\Y"\d`+e+\ bgfph Y+_P~ws Y+_P~dr _0 gr/ 0~ws _0 gr/ 0~dr _0 gr/ 0~d ƒ+_p ~ws ~dr ~d ~dy ~dz ~d ~d v+~t !%!&( JLKNMPOQSR-T!+/./(!%8 #)!%!&('!+/./( µ µ m¹ º»½¼¾»G eà ~ ƒ ~ } { ƒ ˆ Š ˆ»L¼<½¾ ½-À ( µl < ¹ -º Œ <Ž Ž- S S T U V W UX i jnkplmsn-o plq<rst r-u Ö Ø*ÙÚÛ Ù Ü ˆ Š JŒ Ÿ } }~ J ÆÇ ÄÅ ÉÈ È Çà ÆÅ Äà 4&5(,76"$ 4&5(,76"# 0- / 12 /.!"#!+/./()!%!&(!"$ ã âá * )á ( &' ß %$!%!&(!+/./('!%!&()!%!&(!+/./(!%!&*!+/./* ã áâ Þßà Ý ^`_ba ced f f g h i š œ  Á 9 :<;=>?@/A@ s ôr ø qò "! # jkml n o l p KLMN O P"Q R L ª«- ø öõ Y Z YE[\ [\] `a ^_ ë éê gh ef Z XY yz wx tuv ù úû*üýþ ü ÿ ž œ š * ±² ³ øê ôs ø q Ï ÐÑ*ÒÓÔ Ò-Õ ÍÎ ËÌ ÈÉ ÉÊ U UVW Ÿ< A BCEDGF HJI K/LM9L NPO - /.>=7( ' 86? -@A & ' 8:B )( /C )( /CED:FG "& HI46 "( ' & < J F & HI4; ( ' & < ( 1 ( < ( 1 ( ' ' & ' ( & '! 2 7' 89: 4 8;, " ' 89: 486, " & /.0 - ")*+ "', " "( ÿ!" " # %$ ž Ÿwwt t E 7 3 3tªw«w : t t w w t 3 «wª t± ÌÍ Î Ï Ï ÏÐÏ ÑÓÒ ÒÓÒ Ò ÑÓÒ ÒÓÒ ÔÓÒ ÒÓÒÖÕ Ø Ù Ù Ú ÛÜÞÝ ß Ù à á âäãù å Ûæ á ç æeèé êëâ ì í î ï ðóæ à î å ì Ù ñ ò ó ô õñ Ù ö Ú Ù ß à á Ù á æ à â á î Ù ç ç ç ø á æ à â á î ùûúóûß à á üß á ç ýõ þ þ ôß ú U R U S U S
100 CURRENT CONDITIONS USGS Stream Flow Data Historical stream flow data have been collected in the Clear/Clarks Creek Basin since 1946, primarily by USGS. Over the years, USGS has installed and operated 17 stream flow gauges. As noted in Table 4-4, some stations measure continuous flow, while others measure only peak flows. Since 1946, eight continuous flow gauges have been installed, two of which are currently active: Station on Clarks Creek at Tacoma Road and Station on Swan Creek at 80th Street East. The Swan Creek station is a seasonal station that does not record flows all year. Of the 17 historical stream flow gauges in the basin, 12 recorded flows from October 1989 to September Four of these gauges were intended to measure flows continuously, while the remaining eight were installed to measure peak flows only. Table 4-4 lists these sites. USGS used flow data from these stations to calibrate and validate their HSPF model of the Clear/Clarks Creek Basin, as part of their 1994 study, Surface Water Hydrology and Runoff Simulations for Three Basins in Pierce County, Washington (USGS, 1994). The study was completed in cooperation with the Pierce County Department of Public Works (1) to describe rainfall-runoff processes within the study area, and (2) to develop a simulation model for use as a predictive tool to estimate changes in runoff characteristics versus changes in land uses. Application of this model is described in Section 6.1. As mentioned previously, USGS still maintains two active stream flow gauges: one on Clarks Creek and one on Swan Creek. The Swan Creek gauge is seasonal, and USGS does not publish yearly statistics on the gauge. They publish yearly statistics for the Clarks Creek continuous flow gauge (Station ). A continuous flow gauge on Clear Creek (Station , Clear Creek at Pioneer Way below the Fish Hatchery) operated from 1989 to 1998, and was discontinued in These two continuous flow stations have the most flow data of any of the USGS stations in the Clear/Clarks Creek Basin. Table 4-5 lists the monthly and annual flow statistics for these two stations. For the period of record, the Clarks Creek site shows a mean flow of 66.3 cfs, while the Clear Creek site shows a mean annual flow of 11.9 cfs. Although Clear Creek has a larger drainage basin area than Clarks Creek (12.8 square miles versus 10.8 square miles), it appears that groundwater influences on Clarks Creek are more significant than on Clear Creek due to the mean higher flows. Another reason for the variation in mean flows could be that Clarks Creek is more developed, and has a higher overall EIA value than Clear Creek (see Section 4.4, Land Use). It is important to note that the Clear Creek gauge is upstream of the confluence with Swan Creek. Pierce County Public Works & Utilities
101 CURRENT CONDITIONS TABLE 4-4 List of Active and Historical Stream Gauges Station No. Station Description Type Status Period of Record Operating Agency Drainage Clarks Creek at Puyallup, WA CF Inactive March '46 to May '48 USGS Clarks Creek Meeker Ditch at 7th Street SW at Puyallup, WA WQ Inactive Aug '98 USGS Meeker Ditch Diru Creek at Inflow to Hatchery near Puyallup, WA Diru Creek below Hatchery and Pioneer Way East Near Puyallup West Fork Clarks Creek at 104th Street East Near Puyallup, WA Clarks Creek trib at Pioneer Way East near Puyallup, WA Clarks Creek at Tacoma Road East Near Puyallup, WA WQ Inactive Aug '83 USGS Diru Creek CF Inactive Oct. '89 to Sept. '91 USGS Diru Creek PF Inactive Oct. '89 to Sept. '91 USGS Rody Creek PF,WQ Inactive PF: Oct '89 to Sept '91 WQ: Aug '83 to Aug '84 CF,PF,WQ Active CF: Mar '95 to Present PF: Oct '92 to Sept '95 WQ: Aug '83 to Aug '84 USGS USGS Rody Creek Clarks Creek Clarks Creek at River Road East Near Puyallup WQ Inactive Aug '83 to Aug '98 USGS Clarks Creek West Fork Clear Creek at 84th Street East Near Tacoma, WA East Fork Clear Creek at 100th Street East Near Tacoma, WA East Fork Clear Creek at 72nd Street East Near Tacoma, WA Clear Creek at Pioneer Way East Below Hatchery Near Tacoma, WA Canyon Creek at 77th Street East Near Tacoma, WA PF Inactive Oct. '89 to Sept. '91 USGS Clear Creek PF Inactive Oct. '89 to Sept. '91 USGS Clear Creek PF,WQ CF Inactive PF: Oct '89 to Sept '91 WQ: Nov '83 to Feb '84 Inactive Oct. '89 to Sept. '91 Apr. '95 to Sept '98 USGS USGS Clear Creek Clear Creek PF Inactive Oct '89 to Sept. '91 USGS Canyon Creek Clear Creek at 31st Ave Ct. East, Tacoma, WA WQ Inactive Aug. '83 to Aug. '98 USGS Clear Creek Swan Creek at 96th Street East Near Tacoma, PF Inactive Oct. '89 to Sept. '91 USGS Swan Creek Pierce County Public Works & Utilities
102 CURRENT CONDITIONS TABLE 4-4 List of Active and Historical Stream Gauges Station No. Station Description Type Status Period of Record WA Swan Creek at 80th Street East, East Near Tacoma, WA CF Active Oct. '89 to Sept. '91 Oct. '94 to Sept. '97 Oct. '97 to Present (Seasonal) Swan Creek Near Tacoma, WA PF,WQ Inactive PF: Feb '51 to Sept. '91 WQ: Nov. '83 Operating Agency USGS USGS Drainage Swan Creek Swan Creek Swan Creek at Flume Line Road WQ Inactive Nov. '83 to Apr. '84 USGS Swan Creek Swan Creek at Pioneer Way East, Tacoma, WA CF, WQ Inactive CF: Oct. '89 to Sept. '91 WQ: Aug '83 to Aug '98 USGS Swan Creek PC-1 Woodland Creek at 84th Street East CF Active PC Woodland Creek PC-2 Woodland Creek at SR 512 CF Active PC Woodland Creek CH2-1 Clear Creek - Upstream of Pioneer Way East and Below Hatchery Near Tacoma, WA CF Active July present CH2M HILL Clear Creek CH2-2 Swan Creek Upstream of Pioneer Way East CF Active July present CH2M HILL Swan Creek CH2-3 Canyon Creek Upstream of Pioneer Way East CF Active July present CH2M HILL Canyon Creek Pierce County Public Works & Utilities
103 CURRENT CONDITIONS TABLE 4-5 Statistics of Monthly Mean Data for Water Years (Discharge [cfs]) Clarks Creek at Tacoma Road Clear Creek at Pioneer Way Below Fish Hatchery Month Mean Maximum Minimum Mean Maximum October November December January February March April May June July August September Period of Record 66.3 N/A N/A 11.9 N/A Source: USGS, 1998, 2000 Swan Creek makes up a large component of the overall Clear Creek flows at the mouth, and is not represented by the stream flow measurements taken at Station The Clarks Creek gauge is downstream of three of the four subbasins. Therefore, most of the drainage area is captured by the Clarks Creek gauge. Pierce County Stream Flow Data Pierce County Water Programs operates two stream flow gauges on Woodland Creek. These gauges are listed in Table 4-4 and shown on Figure 4-9. The downstream gauge is located at Woodland Creek and 84th Street East, and the upstream gauge is located at SR 512. The gauges were installed to provide flow volume and fluctuation information to enable the design of capital improvement projects to alleviate flooding along Woodland Creek. Pierce County also operates four water-level recording gauges at the following locations: 144th Street Pothole Hemlock Pothole Afdem Pond Ates Pond These water level gauges were installed to support current and future CIP project development in these pothole areas to alleviate flooding. Pierce County Public Works & Utilities
104 CURRENT CONDITIONS As part of the Clear/Clarks Creek Basin characterization, three recording flow gauges were installed and have been operating since late July Table 4-4 lists the stream gauge locations and Figure 4-9 shows the gauging locations. A typical stream gauge installation is shown in Appendix F. Information about these gauges is presented as follows: Clear Creek Location. This stream flow gauge was installed on July 20, 2001, at the site of a discontinued USGS stream flow gauge (Station ) located just upstream of Pioneer Way and below the Trout Lodge Fish Hatchery. CH2M HILL made flow measurements at stages up to 20 cfs. Comparison of these measurements to an existing flow rating curve developed by USGS indicates that the USGS curve is still valid for rating flow in this reach. The reach in this location is relatively flat and uniform. Backwater from the Puyallup River floodplain and the Pioneer Way East culvert may impact the quantity of the stream flow data for very high flows. Canyon Creek Location. This stream flow gauge was installed on July 20, 2001, approximately 100 feet upstream of Pioneer Way East on the east side of Canyon Road East. The reach in this location is relatively flat and uniform. Backwater from the Pioneer Way culvert will extend to this reach but is not expected to affect the stage measurements. The gauge was moved approximately a forth of a mile upstream to the west side of Canyon Road East. Swan Creek Location. This stream flow gauge was originally installed in Swan Creek Park on July 20, 2001, approximately 1,000 feet upstream of Pioneer Way East. High flows in December 2001 resulted in channel scour and deposition of a gravel bar at the location of this gauge. On February 14, 2002, the gauge was relocated to approximately 200 feet above Pioneer Way East, below the bypass flow from the sediment pond. Stream flow was measured at each monitoring station using a wading rod with Price AA or pigmy flow meter and techniques described in Techniques of Water-Resources Investigations of the United States Geological Survey - Discharge Measurements at Gauging Stations (USGS, 1984). These vertical axis flow meters were used to measure flow velocity in feet per second. Velocity was obtained by recording the revolutions of the meter cups for an interval of time. Stream flow measurement consisted of establishing a stream cross-section with a tape marked in feet. The wading rod and meter were used to record stream depth and velocity at selected intervals or cells across the stream channel. The stream flow in cubic feet per second for each cell was calculated and then totaled to obtain the total stream flow at that cross-section. A flow rating curve was developed for Swan and Canyon Creeks by plotting measured flow against stream level. An equation for the resulting curve was used to translate average daily stream level data into average daily flow data. Flow measurements at the Clear Creek Station were used to verify an existing rating curve for a discontinued USGS stream gauging station at that location. The resulting flow statistics and measurements are presented in Appendix F. Stream Flow Predictions Some of the data collected by USGS have been used by the Federal Emergency Management Agency (FEMA) to develop tables showing varying levels of peak discharge throughout the Clear/Clarks Creek system. Flood profiles and floodplain boundaries were established by FEMA Pierce County Public Works & Utilities
105 CURRENT CONDITIONS using some of these tables, and are presented in Flood Insurance Study for Pierce County, Washington (FEMA, 1987). As part of the Flood Insurance Study, a hydrologic analysis was conducted to estimate peak discharge-frequency values. Table 4-6 summarizes the results of the peak discharge values for the Clear/Clarks Creek Basin. The Washington State Hydraulic Manual (WSDOT, 1997) lists USGS gauges that have adequate data to develop recurrence interval storm flows. A statistical analysis (most frequently Log Pearson Type III) is performed on the measured flows to predict the recurrence interval storm event flows (2-, 10-, 25-, 50-, and 100-year). The only gauge in the Clear/Clarks Creek Basin listed in the WSDOT tables is USGS station no at Swan Creek. Table 4-6 lists the peak recurrence flows. TABLE 4-6 Peak Discharge Frequency Relationships Peak Computed Discharge (cfs) Location 2-year 10-year 25-year 50-year 100-year 500-year USGS Station Swan Creek NM Swan Creek -mouth b NM 172 NM Squally Creek - mouth b NM 23 NM Clear Creek - mouth b NM 98 NM Clear Creek Pioneer Way b NM 52 NM a Source: WSDOT, 1997 b Source: FEMA, 1987 NM = not measured Floodplains The Federal Emergency Management Agency (FEMA) mapped the 100- and 500-year floodplain in the Clear/Clarks Creek basin in The 100-year floodplain is the area that is estimated to be flooded every 100 years on average. Similarly, the 500-year floodplain is the area that is estimated to be flooded every 500 years on average. Table 4-7 lists the amount of floodplain in the Clear/Clarks Creek basin. Floodplains are also shown on Figure Detailed floodplain analysis, for the purpose of establishing a regulatory Base-Flood Elevation (BFE), was performed by FEMA for Swan Creek from the Clear Creek Confluence to 64th Street East, Squally Creek from the Clear Creek confluence to about 52nd Street East (extended), and on Clear Creek from the Puyallup River Confluence to about 72nd Street East (FEMA, 1987). NHC completed a restudy of Clear Creek in 2002 and a restudy of Swan Creek and Clarks Creek is planned for The remaining floodplain area shown on Figure 4-10 was mapped using FEMA approximate Pierce County Public Works & Utilities
106 Y U Z a j j :; ƒ Œ Ž Œ Ž Œ Š ˆ % žÿ ÇÈ PQR ST UV <=>?@ AB j õô z uv wx ƒ Ÿ ž}»¼½ Ï j * ) & ' ( Õ ÔÓ! ÉÊÌË Ë`ÍÎ Ê É Í "$#&%('*), G š œ? XY Z] [\ XY VW U ] ^`_ a b _ c d b e f ghi*j h.k + +,.- /0-21 $ šœ. o q p po n lmn C D&E(F*G,H.I J$KLM*N L.O $ *. \ [Z WXY W ³ µœ * ¹ º ^`_ba c dfe gh#i ƒ ~} { kmln ÿ ý ÿ üýþ ü û À ¾ ú ¼ø¾ù ö `ªf«b À ¾ AB'C o omp omqsrut v2wyx MÑ L ÔLÓ Õ K ì$íîï*ðñòœó DEGF H I F'J!#"$%'&)('* $ ƒ *. ˆ ÒÑ ÐÏ #6 5#67 ÃÆ Å ÃÄ Á 4 23 T RS QP NO Ö ØŒÙÚ*Û Ù Ü rst Š ŠŒ *Ž Õ Ñ MÑ L ÔLÓ Õ K Œ *±.² Ý Þ ßŒàá*â à ã «ª /01 / ä å æ&ç(è*é,ê.ë y z {}~* }. "!$# ê þè#â'å ê þâ'å.égðâé ðä ÿ#â'å ê þè#â'å ê þâ'å.égîâé ðä Íÿ#â'åèœé î å è#âé ê èœé ðçó î2ý2ìçâ þå ä#âfÿ æœå è'åâ þ é ý<þä#ä#ÿ ä è è#â'å æ ä Íè è#â'å ä è ágâfã ä å<æçå è#âé êë æ²ì²íçî ê ì ïçïœíñðœæçî?ò ó êë ïçæçì ê ì ïœïçíñðœæœî2ò ó ô²õ öø õ ë ïœî ì õ?õùîœïœúçï ë öüûò ö ê ø ± ± ±²± ³µ ` µ ³µ ` µ µ ` µ `¹`¹ º»» ¼ ½¾À Á» Âbà ÄÆÅ» Ç ½È Ã É ÈÊfË.ÌÍÄ Î Ï Ð Ñ ÒµÈ Â Ð Ç Î» Ó Ô Õ Ö Ó» Ø.Ù ¼» Á  û Ã È Â Ä Ã Ð» É É É ÚbÃ È Â Äbà Р۽ܵÝÁ ÂbÃ Þ ÁbÃ É ß# à à Ö#Á Ü + ) &
107 CURRENT CONDITIONS Subbasin Name TABLE 4-7 Summary of 100- and 500-Year Floodplain in Clear/Clarks Basin Floodplain Area in Subbasin (acres) 100-Year 500-Year Total Floodplain % of Floodplain in Subbasin Floodplain Area in Subbasin (acres) % of Floodplain in Subbasin Floodplain Area in Subbasin (acres) % of Floodplain in Subbasin Roosevelt Ditch Swan Creek Squally Creek Clear Creek Canyon Creek Rody Creek Diru Creek Woodland Creek Clarks Creek th Avenue Pothole th Street Pothole th Street Pothole th Street Pothole Lower 144th Street Pothole Upper 144th Street Pothole Afdem Pothole Alderwood Pothole Black Swamp Pothole Candlewood- Manorwood Pothole Capital Pothole Heritage Glen Pothole Meridian Pothole South Central Pothole Springfield Pothole Tip Top Pothole Total Floodplains are shown on Figure Pierce County Public Works & Utilities
108 CURRENT CONDITIONS hydrologic and hydraulic methods. Approximate methods are FEMA accepted alternatives to detailed study of flood plains. Typically, regulatory BFEs are not established in areas analyzed using approximate methods. Because approximate methods were used to establish much of the original floodplain, it is likely that the floodplain is more extensive than indicated on Figure 4-10 and in Table 4-7. Figure 4-10 shows that extensive floodplain area exists in the Clear/Clarks Creek basin. Generally, the floodplain covers a more extensive area in the lower elevations of the Puyallup River valley. The extent of floodplain in the valley is strongly influenced by the flood condition in the Puyallup River in addition to the large volume of water discharging from the creeks during flood events. Floodplains in the canyon reaches are narrow due the steepness of the creeks in these reaches. In reaches located in the upland plateau area, the floodplain widens due to the relatively flat, poorly draining soils and wetlands. Floodplains in the pothole subbasins are usually found at the lowest elevations of the pothole. Although many of the potholes are mapped as 500-year floodplains, floodwaters may still cause some flooding in the depressions during more frequent storm events. Figure 4-10 shows the potholes with mapped floodplains. Table 4-7 shows that floodplain covers over 10 % of the basin. A review of the data in Table 4-7 shows that nearly 70 % of the floodplain area is contained within the Swan, Clear, Canyon, and Clarks Creek subbasins. Figure 4-10 shows that a significant portion of the 500-year floodplain occurs in the upland plateau area of the Clear and Clarks Creek basin and also in the pothole area Groundwater The USGS recently performed an extensive study of groundwater hydrology in the Clear Clarks Creek Basin (USGS, 1999). In this study, they found that approximately 38 % of the annual precipitation enters the groundwater system as recharge. One-third of the 38 % (or about 12 % of the total rainfall) is withdrawn from wells. The eastern and northern parts of the basin have the highest recharge rate at more than 15 inches a year, an area that generally corresponds to the distribution of the Alderwood-Everett and Puyallup-Sultan soils shown on Figure 4-2. The recharge rate for remaining parts of the basin has been estimated at between 5 to 15 inches per year. The latter area generally corresponds to the Kapowsin soils also shown on Figure 4-2. The USGS study also found that groundwater generally moves from the higher elevations of the upland areas of the basin to the Puyallup River. Groundwater moves in a series of five aquifers separated by confining layers of soil. The upper two aquifers contribute significantly to stream flow. The lower three aquifers contribute little or no water to the creeks. The uppermost aquifer is shallow and unconfined. It is located in outwash deposits at the land surface in the northern and eastern part of the basin. Water from the uppermost aquifer discharges to the creeks through seeps and springs where the outwash layer intersects the stream channel. A semi-confining till layer is located below the upper aquifer. This till layer is exposed at the land surface in the western part of the basin. The semi-confining till layer overlays another aquifer. Water from this confined aquifer discharges to the creeks where it is exposed in the incised reaches of the creeks and the canyon walls. Spring water from this aquifer supplies public water most notably at Pierce County Public Works & Utilities
109 CURRENT CONDITIONS Maplewood Springs. Although, most of the discharge from this aquifer occurs within the Clear/Clarks basin, a portion of the aquifer underlying the pothole area flows to the Mid- Puyallup Basin and into the Puyallup River. In a separate analysis, the USGS (1994) performed a numerical analysis of groundwater contributions to the streams. The results of this analysis indicated that substantial flows during low-flow periods were from groundwater recharge. Similar groundwater effects were also reported by Ecology (1999). The Ecology report studied the interaction between groundwater and surface water for selected streams in the State of Washington. Data from active and discontinued USGS stream gauging stations were used to assess the groundwater component of the stream flows. Contributions to base stream flow were estimated using a hydrograph separation software program to divide the stream hydrograph into a base flow component and a surface runoff component (Ecology, 1999). Only one station was used to compute base flows for the Clear/Clarks Creek Basin: USGS Station , Clear Creek at Pioneer Way. Table 4-5 summarizes the monthly mean and annual flow data for Station The data suggests that at least for Swan Creek, the base flows estimated by Ecology represent the majority of stream flows from May through October. 4.4 Aquatic and Riparian Habitat The geography, hydrology, and geology of the two adjacent watersheds have a profound effect on the character and productivity of the resulting habitat. The Clear and Clarks Creek watersheds can both be easily divided into three sections: upper, middle, and lower. The upper sections are hilly and only moderately sloped. The middle sections are deeply entrenched ravines with actively down-cutting channels. In general, the lower sections are in the floodplain of the Puyallup River and are low gradient, channelized, and ditch-like. The upper watersheds are moderately built-out, and hydrology is related to the amount of impervious surface. The upper watersheds have little or no surface flow from late May through September. Stream channels have been highly channelized and are best characterized as grassy ditches. This is also an area of potential groundwater recharge evident by the gaining nature of the streams (described in Section 4.3.5) In general, riparian communities in the upper watersheds are composed of grasses, pasture, black berries, and ornamental plants. The middle or canyon sections are forested with Douglas fir, Sitka spruce, big leaf maple, and alder, with an understory of salmonberry, elderberry, blackberry, and Indian plum. Because the canyons are generally steep and deep, the riparian buffers are fairly wide. The size of the firs found throughout the canyon reaches suggest that they are about 50 years old Historical Fish Presence Clear Creek supports five species of salmonids: chinook salmon (Oncorhynchus tshawytscha), coho salmon (O. kisutch), chum salmon (O. keta), steelhead trout (O. mykiss), and cutthroat trout (O. clarki) (Don Nauer, WDFW area habitat biologist, personal communication, 2001; Russ Ladley, Puyallup Tribe fisheries biologist, personal communication, 2001). Cutthroat trout are likely to be present in both the anadromous and resident forms. Chinook use spawning habitat in Pierce County Public Works & Utilities
110 CURRENT CONDITIONS Clear and Swan Creeks in the vicinity of Pioneer Way, and perhaps a short distance upstream. Stream flows in Canyon Creek is too low during the period when chinook are present to provide spawning habitat. Figure 4-11 shows the fish presence in the Clear/Clarks Creek basin. Coho use all of the subbasins to varying degrees. All the coho in Clear Creek and its tributaries are natural populations, and their distribution extends up to a private fish hatchery weir. In Swan Creek, coho distribution probably extends at least 0.5 mile upstream of Pioneer Way East. Estimated coho escapement is in the range of 50 in Clear and Swan Creeks, about in Diru Creek, and perhaps less in Rody and Canyon Creeks. Steelhead are said to be present in small numbers in Clear Creek and all of its tributaries (Don Nauer, 2001, personal communication; Russ Ladley, 2002, personal communication). Chum salmon are the dominant salmonid in the Clear Creek system. About 300 chum spawned in Swan Creek in in the vicinity of Pioneer Way East, extending upstream to the old water diversion weir (about one mile upstream of Pioneer Way East). In Clear Creek, chum spawn in the hundreds up to the private hatchery weir. Canyon Creek is too steep for chum, except at Pioneer Way, and too flat (with a sand bottom) along the lower reach (Ladley, 2002, personal communication). Squally Creek is said to have significant chum utilization from its confluence with Clear Creek up to Pioneer Way (Russ Ladley, 2001, personal communication). The Clarks Creek Basin also supports chinook, coho, and chum salmon, and steelhead and cutthroat trout. The Clarks Creek mainstem contains nearly all of the spawning and rearing habitat in the system. Excellent spawning and fair to good rearing conditions are present in the 0.5-mile-long reach between Maplewood Springs and Meeker Ditch. Meeker Ditch is significant in that it drains the Puyallup Fairground and surrounding area, which is highly developed. Channel substrate conditions upstream of Meeker Ditch are clean gravels and cobbles and very clean clear water. Below Meeker Ditch, the water is turbid and the substrate is about 95 % sand or finer grain sizes. In the short section of usable stream channel in Clarks Creek, about 1,000 3,000 chum, coho, chinook, and 100 steelhead spawn. Some of the rearing juveniles are probably displaced downstream and into Rody and Diru Creeks because the rearing capacity of Clarks Creek is far less than the number of eggs that are deposited. Rody Creek is used by a few coho and steelhead, but supports about 100 chum spawners downstream of Pioneer Way. Diru Creek is very small, but experiences the escapement of up to 10,000 chum salmon adults due to hatchery releases. In addition, about coho, 300 chum, a few steelhead, and a few chinook spawn naturally in the Rody Creek. Generally stream flows in Diru and Rody Creeks are too low during the period when chinook are present to provide spawning habitat. Pierce County Public Works & Utilities
111 x } \ œ œ «ª { } G Ä áâã äåã æçè w c STU ) )* ( ßà Ç š œ œ œ¾ ½ ÜÝÞ àß oñoô õ ó n o õ ó nï M ÅÆÆÇ ÈÉÊ Ë I KH K H L H I J ñðï >?@ A B BC D E B " - +!#"%$ tuv qrs é<êìë ë í7î ê é í ;< 9: FGIH'JLKNM.O ± ± ² ³jµ ³ ¹ º D»b¼ { } ~ { yz x ~ ƒ ƒ V W VBXY XYZ ˆ* 7ŠL.Œ P P QR S T R U ¹*º<»¼ º.½ Ž d eif'glhni.j kl*m7nlo m.p YZ[ VWX ²³* 7µL. x xyz ÁÂà ¾ À.$/0 ( "* 1,,2"%$ &'Þ #$ Ü%Þ "! Ó Ô Õ Ö7 LØ Ö±Ù ÚÛ ƒ Ĝ Š œ Ÿ ž œ ŒGŽ ÅÄ Ä Ã Á ÂÁ À `ab ]^_ P PQR -*,./,+ vw tu qrs ö ø ù<úlû ù±ü 3 4*576989:<;=<;!#"%$'& ( ()"*,+ ª ««7 L ± []\_^`ba c c d ef õæ ñp p ñoô ý þ ÿ ghji k l im HIJK LMNO 7 L <. < Ì Í Î Ï7ÐLÑ Ï.Ò õô óò š œ*ž7ÿl ž. = >?@BADC EGF B#CDCEF 9 :9;<!ü *=ÿü þ ÿ ü Ìþ ÿ2 ) >?@ A *-1 "+., / 0 1 ÿ2 ) übü ÿ ü, übü3 ÿü 45*%0*-67*+, üàü3 ÿü, þ Ìþ8 ÿ ü $ ü&%' ( ) *+,*- ü þ Ìþ ü Gÿ þïü ÿ þ ÿ ü ûýü þ ÿü bÿ!#"ÿ ÈÉ Ê Ë Ë ËÌË ÍÏÎÎÏÎ Î ÍÏÎÎÏÎ ÐÏÎÎÏÎÒÑÓÓ Ô K H Õ Õ Ö ØÚÙ Û Õ Ü Ý ÞàßÕ á â Ý ã âbäåæçþ è é ê ë ìïâ Ü ê á è Õ í î ï ð ñí Õ òó Ö Õ Û Ü Ý Õ Ý â Ü Þ Ý ê Õ ã ã ã ô Ý â Ü Þ Ý ê õ öï Û Ü Ý øû Ý ã ùñ ú ú ðû ö N
112 CURRENT CONDITIONS In Clear Creek, 7 pools totaling 195 feet of pool habitat exist. This equates to 2 % of pool habitat. No more than five pools were observed in each of Rody, Woodland, and Canyon Creeks. Each pool is the result of anthropogenic structures. A small concrete wall on Rody Creek forms a plunge pool. A small detention pond north of Canyon Road East and 72nd Street East exists on Canyon Creek. An excavation for irrigation on Woodland Creek created a pool just south of Pioneer Way East. Riparian Cover Most of the ravines in the Clear/Clarks Creek Basin are undeveloped, probably due to the steepness of the side slopes, critical areas regulations and, in some cases such as Swan Creek Park, preservation as green spaces. As a result, the ravines provide a higher quality riparian habitat than is usually seen in urban streams. The width of the riparian corridor is closely related to the width of the ravine that contains the stream, with Swan Creek and Clear Creek having the largest riparian corridors, and Woodland Creek and Clarks Creek having the smallest. In Clarks Creek, almost no riparian corridor exists downstream of DeCoursey Park in the City of Puyallup. On Woodland Creek, the riparian cover is a patchwork of various types that changes dramatically as the creek flows from one private property line to the next. The dominant riparian vegetation above Pioneer Way East is mixed, year old, secondgrowth conifers and deciduous hardwoods. While conifers are often present, they rarely are the dominant vegetative species. Hardwoods, predominantly alder and occasionally cottonwood, are the dominant riparian species. Similarly, hardwood-type large woody debris (LWD) in the stream channel outnumbers conifer LWD (see LWD discussion below). Salmonberry, elderberry, Indian plum, and blackberry are the dominant shrub species. Some invasive species such as reed canary grass and Japanese knotweed are also present, but are only a minor component of the vegetation. As with channel type, riparian cover downstream of Pioneer Way East changes dramatically. Agricultural practices, flood control practices, and residential landscaping have removed almost all native riparian vegetation. Most of the ditched stream channels in this section are lined with invasive species such as Himalayan blackberry and reed canary grass. The springs that support perennial flows also provide a cool water source that compensates somewhat for the lack of riparian cover. Riparian cover provides shade that keeps the water at a cool temperature. Cool, clean water is essential for migrating fish. Shade also prevents invasive species such as reed canary grass from taking root. Native riparian vegetation also plays an important role in stream bank stabilization. LWD and LWD Recruitment LWD data are summarized in Table 4-9, LWD Statistics per Stream. LWD and key LWD pieces were rarely observed in the stream reaches surveyed. Swan Creek and Clear Creek both had the highest instream LWD counts and LWD recruitment potential. Using the USBEM method, LWD was defined as pieces of wood within the bankfull stream height that are at least 10 inches in diameter and at least 10 feet long. Key LWD pieces were also identified. Key pieces are pieces large enough to cause significant channel-forming hydraulics. The size requirements for key Pierce County Public Works & Utilities
113 CURRENT CONDITIONS Salmon populations in Clear and Clarks Creeks are significantly influenced by hatchery releases. There are three hatcheries within the Clear/Clarks Creek Basin (see Figure 1-2). One of these, the Puyallup Tribe Hatchery, releases fish on station (from the hatchery). The Puyallup Tribe hatchery is located on Diru Creek near Pioneer Way. It produces 400,000 chinook sub-yearling smolts, 200,000 of which are released from the hatchery into Diru Creek. The other 200,000 are planted elsewhere in the Puyallup River system. The Tribe s hatchery produces primarily chum salmon. About 1.7 million fry/smolts are released on station in Diru Creek. About 60,000 steelhead smolts were historically produced by the hatchery, but that practice has been discontinued because water quality problems limit the production capacity of the hatchery during the summer months. With such large releases of juvenile salmon, significant straying of returning adults is inevitable. In the case of chinook salmon, this is exacerbated by the fact that Diru Creek is too shallow for the fish to swim up at the time of year that they return. The Puyallup Tribe is constructing a companion rearing facility on Clarks Creek near its existing hatchery about a mile from the mouth of Clarks Creek that overcomes some of the limitations of the hatchery on Diru Creek. Clarks Creek has a greater base flow and the new facility has been designed to provide a more natural setting for juvenile chinook salmon, which is expected to result in greater survival after the fish are released. The other two hatcheries in the Clear/Clarks Creek subbasins are the WDFW hatchery at Maplewood Springs (Clarks Creek) and the private hatchery on Clear Creek (see Figure 1-2). The WDFW hatchery raises primarily catchable-size rainbow trout for lake planting throughout the region. This is about 1.7 million trout, amounting to about 350,000 pounds per year of fish weighing about 1/5th pound each. Chinook are also reared at Maplewood Springs. All chinook are collected and released in other areas of the Puyallup River system. About 400,000 to 500,000 steelhead smolts are reared at Maplewood Springs. Of these, about 200,000 are released into the Puyallup River system; the others are planted elsewhere in the Puget Sound region. The hatchery on Clear Creek just upstream of Pioneer Way East, is a privately owned hatchery that has been operating at its present location and at its current capacity since This facility is dedicated to rearing broodstock for egg production. The main business of the hatchery is to supply rainbow trout eggs to hatcheries worldwide. The hatchery company (including its four other hatcheries) is the largest single producer of trout eggs in the world. The monetary value of broodstock at the Clear Creek Hatchery is very high. All hatcheries rely on high quality water and each hatchery is sensitive to declines in water quality. One federally protected fish species is found in the Clear/Clarks Creek Basin. Chinook were listed for protection under the Endangered Species Act (ESA) in Table 4-8 shows the status of chinook and other species of concern that are present in the Clear/Clarks Creek Basin. Pierce County Public Works & Utilities
114 CURRENT CONDITIONS TABLE 4-8 Fish Species of Concern Found in Clear/Clarks Creek Basin Species a Chinook salmon (O. tshawytscha) Coho salmon (O. kisutch) Steelhead trout (O. mykiss) River lamprey (Lampetra ayresi) Federal threatened Federal candidate State monitor species Status Federal species of concern/ State candidate and species of concern a Includes federal and state endangered, threatened, candidate, and monitor species. Source: WDFW (1993, updated 2002). According to the Preliminary Technical Assistance for Bull Trout Recovery Planning Efforts (Feb. 24, 2004) issued by the U.S. Fish and Wildlife Service, primary foraging, migration, and overwintering habitat for migratory bull trout within the Puyallup core area is believed to be the mainstem reaches of the White, Carbon and Puyallup Rivers. Spawning occurs in the upper reaches of the Puyallup River Basin where higher elevations produce the cool water temperatures required by bull trout. Rearing occurs throughout the mainstem rivers, but data suggests that the majority of rearing occurs in the upper reaches of the basin. No information is available about the existence of bull trout in Clear Creek or Clarks Creek. The report acknowledges that limited information is available on the distribution of bull trout in the Puyallup basin Stream Evaluation The Urban Stream Baseline Evaluation Method (USBEM) in the Tri-County Urban Issues Study was used to classify salmon habitat quality for the Clear/Clarks Creek Basin. The methodology allows for the determination of baseline conditions for salmon, with particular treatment of urban influences. The analysis is a two-phase process consisting of a pre-classification screening phase and a field observation phase. The USBEM evaluation is documented in Appendix E. Figure 4-11 shows the location of the stream reaches surveyed in each subbasin. Phase I: Pre-Classification Screening The Phase I pre-classification screening includes analysis of geomorphic channel constraints, watershed or channel alterations, and known or expected fish distributions. The compilation of this information allows for pre-classification of each channel segment into highly suitable habitat, secondary habitat, and negligible habitat. Clear Creek and Clarks Creek were segmented into 29 reaches. Phase II: Field Observations USBEM Phase II included a quantitative assessment of habitat characteristics for a portion of the sites determined in Phase I focusing on the canyon and floodplain reaches of the Clear and Clarks creek system. Phase II parameters include riparian condition, substrate composition, embeddedness, bank condition, benthic invertebrate community characteristics, passage barriers, pool frequency, channel pattern/bedform, large woody debris, and water temperature. In addition to field habitat assessment, local residents were interviewed for information on fish use, habitat alteration, land use, water flow fluctuation, and other factors that might affect habitat condition. Pierce County Public Works & Utilities
115 CURRENT CONDITIONS The results from the USBEM analysis are used in the process of selecting the appropriate recovery options for the species of concern. Channel Types Channel types are largely dependent on gradient and valley form. Both of these characteristics change at the bottom of the hillslope in the Clear/Clarks Creek Basin, as do the channel types. This transition between channel types occurs in most of the streams near Pioneer Way East. The stream gradients upstream of Pioneer Way East range from two to five %, whereas they are generally less than one % downstream of the road. The valley form for all streams above Pioneer Way East is a parallel series of narrow, deeply incised ravines; whereas the valley form below Pioneer Way East is a large floodplain created by the Puyallup River. Likewise, the stream bottom substrate composition above Pioneer Way East is predominantly gravel, and below the road the substrate is predominantly sand and silt. This resulting channel type is a mixed-gradient mixed control (MGMC) (Paustian 1992) or Rosgen B or A channel types (Rosgen 1986) above Pioneer Way East. Below Pioneer Way East, Canyon, Clear, and Clarks Creeks are channelized, straightened, confined, and low gradient. It should be noted that the predominant land use downstream (i.e., north of) of Pioneer Way East is agricultural, and agricultural practices in this area have resulted in significant landscape alterations, channel relocation, and channel confinement, resulting in essentially ditch-like channels At the intersection of these channel types; from MGMC (Rosgen B) to low-gradient channels, there is a geomorphic form known as an alluvial fan. The fan is created when large bedloads of alluvial material are transported down contained, higher gradient channels and are deposited. These deposits decrease the channel gradient and confinement and the bedload transport capacity is reduced. Alluvial outwashes result in the deposition of large amounts of material with active channel migration. These alluvial fans are most obvious in Swan, Squally, Clear, and Diru Creeks just above and below Pioneer Way East. Alluvial fans commonly produce good salmonid spawning areas. Spawning Gravel Quality The drainages of the Clear and Clarks Creeks watersheds overlie coarse, unconsolidated layers of glacial deposits. This surficial geology has a very high sand and gravel content from alluvial deposits, known as Vashon advance gravel, that were laid down from large floods in the late Pleistocene period. As a result, current gravel recruitment to the streams occurs both from downcutting and exposed stream banks, as well as from the transport of materials from the headwaters. All of the streams in both watersheds have an abundance of gravels. The abundant gravel sources and the alluvial outwash processes that occur near Pioneer Way continually create and maintain spawning gravels in all of the creeks. The highest quality spawning gravels are present in Swan, Clear, Clarks, and Rody Creeks, with moderate-quality gravels in Diru and Woodland Creeks. Despite the abundance of clean gravels, the capacity for spawning in these drainages is limited by low flow rates in the early fall for chinook and barriers to fish passage. At the time of this survey, the instream flows in Swan, Clear, and Diru Creeks ended lower in the watershed than did suitable spawning gravels. In Clarks Creek, the only suitable spawning gravels observed were in a 1,600-foot-long section adjacent (west) and below the WDFW hatchery. This short reach has high-quality spawning Pierce County Public Works & Utilities
116 CURRENT CONDITIONS habitat. Thousands of salmon are known to spawn there each year. The spawning gravels in this section were the best observed in either watershed; however, the reach was limited in length. The reach is bordered by a wide, swamp-like ponding of Clarks Creek below the hatchery and an instream dam built to create a small reservoir above the hatchery. Downstream of the hatchery to the Puyallup River, Clarks Creek is a wide, deep, slow-moving glide covered with a substrate of thick organic muck and large aquatic plants. Fine Sediment Fine sediment deposits were observed in all creeks below Pioneer Way East, and in Squally, Woodland, and Clarks Creeks above Pioneer Way East. In Squally Creek, the sediment has a large sand component, and the flow in this section becomes very shallow, wide, and braided, with large pockets of standing water. The Squally Creek sediments appear to be from glacial deposits that are currently exposed in the stream banks. Deposition immediately upstream of Pioneer Way East in the Squally Creek channel appears to be partially the result of large amounts of road fill having been placed in the channel during construction of Pioneer Way East. The road fill appears to have caused a backwatering effect, creating a semi-inundated swamp-like habitat with multiple stream channels. In contrast, sediments observed in Woodland Creek and Clarks Creek have a darker color and finer texture and appear to have entered the channel at street crossings as a result of surface drainage. The section of Woodland Creek above and below the 84th Street East crossing and the portion of Squally Creek downstream of the 48th Street East crossing are currently sources of fine sediments. Sediments have a negative effect on the water quality of a stream system. The sediments increase the turbidity of the water, reduce light and harm the aquatic life by smothering eggs and benthic creatures and filling in spaces between rocks that could have been used as habitat for aquatic organisms. A significant reduction in light penetration can result in lower release of oxygen into the water. Fine particulates can clog or damage sensitive gill structures in fish, decrease their resistance to disease, prevent proper egg development, and interfere with feeding activities. Sediments also carry nutrients into the stream system increasing vegetation growth, especially invasive vegetation. Sediments clog stream channels and fill reservoirs. The increased intensity of floods due to channels clogged with sediments often leads to more pollutants entering the streams as waters over flow their banks. Turbidity is the standard measure to evaluate the impact of sediments on a stream system. The greater the amount of total suspended solids (TSS) in the water, the murkier it appears and the higher the measured turbidity. However, turbidity values show wide variation making it difficult to determine a background turbidity value. Another way to evaluate the sediments is by determining the overall biological health of the stream. Benthic macroinvertebrates are an excellent measure of the biological health of the stream. B-IBI results indicate the overall biological health of the Clear/Clark basin is rated as poor with a few streams rated as fair. The B-IBI results are listed in Table Pierce County Public Works & Utilities
117 CURRENT CONDITIONS Erosion and Bedload Movement Active stream bank and channel bed erosion was observed in all the creeks surveyed. The amount of erosion in these basins, in the form of channel downcutting, channel sidecutting, and hillslope mass wasting is active and severe in these basins largely the result of the geology of large, unconsolidated, glacial outwash deposits coupled with excessive peak flows. Five-foothigh exposed banks are common in the basins, and were most pronounced from the middle to the top of the canyon reaches. The worst erosion was noted on Swan Creek immediately downstream of 64th Street, on Clear Creek immediately downstream of 72nd Street, and on Woodland Creek both upstream and downstream of 84th Street. Some of the erosion was observed downstream of culverts, particularly below Swan, Clear, and Rody Creeks. Other areas of erosion were not affected by structures and appear to be the result of high peak flows through unconsolidated substrate. Nearly all of the surveyed Clarks Creek channel was stable, low gradient channel without evidence of active erosion. However, rip-rap and other hard bank stabilization has been constructed, particularly behind homes on the eastern bank of Clarks Creek in the City of Puyallup. Some limited bank erosion (less than 2-foot-high exposed banks) was observed in the shallow gravel reach behind the WDFW hatchery. In addition to active erosion, there was evidence of substantial bedload movement in Swan, Clear, Rody, Diru, Woodland, and Clarks Creeks. Bedload movement is the transport of sediment on bottom of the stream. Some amount of bedload movement is expected in steep gradient stream but excessive movement causes salmon eggs to wash out of spawning nests. The location and coloration of large gravels and cobbles in these reaches were indicative of channels with active bedload movement. With the exception of Woodland Creek, sand and gravel deposits at or above bank full levels were observed. An instream flow gauge, installed by CH2M HILL, was buried by several inches of gravel after six months of operation. Some reaches of Woodland Creek were found to consist of hard clay or compacted till layers and lacked any gravel at all. These reaches probably experience regular scouring flows that prevent retention of materials of any size. Pools Swan and Clarks Creek are the only streams surveyed that have substantial pool habitat. Over 3,700 feet (26 %) of Swan Creek is classified as pool habitat in the surveyed reach. Swan Creek contains 72 pools, of which 13 are constructed log V -weirs. During the survey, most of the pools were dry in the reach downstream of 64th Street East, including the 13 pools associated with the V -weirs. Approximately 3,300 feet (28 %) of Clarks Creek is classified as pool habitat. Most of Clarks Creek downstream of the WDFW hatchery is glide habitat. However, there is a large, instream pond between the hatchery and a City of Puyallup park. No pools were observed in Squally Creek or Diru Creek. In all other streams surveyed, pools account for a very small %age of the total stream habitat upstream of Pioneer Way East. Below Pioneer Way East, pool habitat is more abundant, and is the second most frequent habitat, after glide habitat. Pierce County Public Works & Utilities
118 CURRENT CONDITIONS LWD pieces depend on the size of the stream. The minimum size requirements of a key piece are 1.3 feet in diameter and 26 feet in length. Stream LWD Count TABLE 4-9 LWD Statistics per Stream Key LWD Count Length Surveyed (feet) LWD per Mile Swan , Squally 9 0 1, Clear , Canyon , Rody 1 0 2,083 3 Diru , Woodland ,839 8 Clarks ,768 7 LWD recruitment potential is fairly good in the canyon reaches of all streams. The riparian buffers were generally wide, but not necessarily dense. Some hardwood stands were considered mature, but conifers were only occasionally in the year age class. The sparse density appeared to be the result of historic clearing and logging, establishment of invasive species, and landslides. For Squally Creek in particular, invasive species such as creeping nightshade are preventing the establishment and growth of woody species. As with other habitat indicators, the presence of LWD downstream of Pioneer Way East is significantly different for all but Swan Creek. Nine pieces of large woody debris were observed in almost 16,000 feet of stream channel surveyed below Pioneer Way East. Of these nine pieces, eight pieces were observed in the 7,000 reach of Clarks Creek. Recruitment potential is almost non-existent in this area, and there appears to be ongoing stream channel cleaning to maintain stream channel capacity. Swan Creek is the exception with 25 large woody debris pieces located downstream of Pioneer Way. Fish Presence and Passage Fish presence or absence was not specifically a parameter of the survey method, but observations were recorded. Juvenile coho salmon were observed in the low-gradient sections of Clear Creek, along and immediately upstream of Pioneer Way East. The same was true for Swan Creek and lower Canyon Creek. In addition, catchable-size trout were also observed in lower Clear Creek along Pioneer Way East. In the fall, adult chum salmon were observed in Diru Creek below the Tribe s hatchery and in Clarks Creek behind the WDFW hatchery. In Clarks Creek, redd (spawning area) establishment was evident. Numerous barriers to fish passage were observed. In Swan Creek, a perched box culvert at 64th Street East creates about a five-foot-high waterfall onto concrete rubble below. At the time of the survey (late summer and early fall), the invasive species in Squally Creek filled the channel and Pierce County Public Works & Utilities
119 CURRENT CONDITIONS precluded passage of adult salmonids. Clear Creek has a 48-inch-diameter corrugated metal pipe culvert perched approximately six feet downstream of 72nd Street East that is a barrier. Clear Creek also has an impassible weir at the Trout Lodge hatchery. Rody Creek has a four-foot-high concrete wall with downstream slab in the channel creating a barrier to passage approximately 150 yards upstream of Pioneer Way East. The growth of reed canary grass within the active channel of lower Woodland Creek is so great that it could preclude passage of adult salmonids during the summer growing season. Clarks Creek contains a 10-foot-high dam at the WDFW hatchery reservoir, located a few hundred yards upstream of the southern hatchery access road. Barriers to fish passage were identified during the CH2M HILL field investigation and from the Pierce Conservation District (PCD), WRIA 10 Puyallup River, Fish Passage Inventory database. CH2M HILL assessed culverts using the WDFW Level A Criteria (WDFW, 2000). Table 4-10 lists the locations of barriers to fish passage in the Clear/Clarks Creek Basin. TABLE 4-10 Fish Passage Barrier Locations Problem ID a Location b PCD Site ID Status Barrier Type Fish Use SW-23 Swan Creek - 64th Street East 105 r031521a Barrier Slope/outfall Yes SW-31 SW-3 Swan Creek - Pipeline Road (City of Tacoma) Swan Creek - 72nd Street East (City of Tacoma) 105 r062416a Barrier Outfall/slope Yes 105 s013119a Barrier Outfall Yes SW-1 Swan Creek - 80th Street East 105 r031522a Barrier Slope Unknown SW-29 Burlington Northern Santa Fe Railroad None Unknown Velocity, Level B Required Yes SW-32 Swan Creek - 84th Street East 105 r031522b Unknown Unknown SW-33 Swan Creek - 96th Street East 105 r031600a Unknown Unknown SW-34 Swan Creek - 104th Street East 105 r031523a Barrier Slope Unknown CL-30 Clear Creek - Gay Road East 105 r031520a Unknown Velocity, Level B Required CL-31 Clear Creek - Pioneer Way East 105 r031616a Unknown Span/toe ratio, dam upstream, Level B Required Yes Yes CL-27 Clear Creek Hatchery None Barrier Dam Yes CL-32 CY-28 Canyon Creek - Railroad (BNSF Railroad) Canyon Creek - Driveway culvert upstream of Clear Creek Confluence 105 r041320b Barrier Slope Yes 105 r041321a Barrier Slope Yes Pierce County Public Works & Utilities
120 CURRENT CONDITIONS TABLE 4-10 Fish Passage Barrier Locations Problem ID a Location b PCD Site ID Status Barrier Type Fish Use CY-28 Canyon Creek - Driveway culvert upstream of Clear Creek Confluence 105 r041322a Unknown Unknown Yes RY-18 Rody Creek Concrete Weir in Channel None Barrier Yes RY-14 Rody Creek - 72nd Street East 105 r040618a Barrier Outfall Yes RY-20 Rody Creek - Pioneer Way East 105 r031821a Unknown Level B Required Yes WO-8 WO-30 WO-22 CK-17 CK-18 CK-19 CK-20 Woodland Creek 80th Street East Culvert Woodland Creek Culvert under WSU Experimental Farm Woodland Creek 12 foot cascade downstream of 84th Street E Meeker Creek - 11th Street SW (City of Puyallup) Roadside Ditch tributary to Meeker Ditch - 11th Street SW (City of Puyallup) Unnamed Tributary to Meeker Ditch - 12 Avenue SW (City of Puyallup) Clarks Creek - Fish Hatchery (State of Washington) None Barrier Outfall Unknown None Unknown Level B Required Unknown None Barrier Unknown 105 r032522a Unknown Level B required Yes 105 r051115a Barrier Slope Yes 105 r060922b Unknown Yes 105 r060920b Barrier Yes a Fish passage barriers are shown in Figure 4-11 b Culverts are owned by Pierce County unless otherwise noted. B-IBI Sampling Benthic macroinvertebrate sampling was conducted for six of the streams in the Clear/Clarks Creek Basin. The Benthic Index of Biological Integrity (B-IBI) is a measure of stream health developed by the University of Washington. Sampling locations are identified in Table 4-11 with corresponding B-IBI 10-metric scores. See Figure 4-11 for a map of sampling locations. Pierce County Public Works & Utilities
121 CURRENT CONDITIONS TABLE 4-11 B-IBI Scores from Clear/Clarks Creek Drainages Stream Name Clear Creek Swan Creek Swan Creek Squally Creek Canyon Creek Rody Creek Diru Creek Clarks Creek Swan Creek Clarks Creek Swan Creek Swan Creek Clarks Creek Testing Organization Location Date Score Rate Pierce County Water Programs Pierce County Water Programs CH2M HILL CH2M HILL CH2M HILL CH2M HILL Pierce County Water Programs CH2M HILL Puyallup Tribe Puyallup Tribe Puyallup Tribe Puyallup Tribe Puyallup Tribe Behind the Schmidt residence, 44th Ave Swan Creek Park, 500 upstream of detention pond 435 upstream of detention pond 50 upstream of Pioneer Way Culvert 300 upstream of Pioneer Way Culvert 300 above Pioneer Way, below small dam Immediately upstream of Pioneer Way 40 upstream of footbridge, behind WDFW fish hatchery Swan Creek Park, 500 upstream of detention pond Upstream of WDFW fish hatchery Swan Creek Park, 500 upstream of detention pond Swan Creek Park, 100 upstream of first site Upstream of WDFW fish hatchery 09/25/ Poor 09/28/ Poor 09/18/ Poor 09/18/ Fair 09/18/ Poor 09/20/ Poor 09/17/ Poor 09/18/ Poor 9/ Poor 9/ Fair 09/30/ Very Poor 10/08/ Poor 10/08/ Fair Pierce County Water Programs in cooperation with the Stream Team, CH2M HILL and the Puyallup Tribe have been monitoring the biological integrity of streams in Pierce County though analysis of the benthic invertebrate population density and diversity since Stream reaches were selected to approximate the B-IBI site recommendations of Karr (1986) as closely as possible. Samples were collected according to the Karr B-IBI protocol ( and sent to an independent taxonomy laboratory for identification. Rating guidelines for Puget Sound B-IBI scores are also provided at the website. According to the rating system, a score of Pierce County Public Works & Utilities
122 CURRENT CONDITIONS indicates excellent stream condition, indicates good condition, indicates fair condition, indicates poor condition, and indicates very poor stream condition. The B-IBI scores in the Clear/Clarks Creek Basin ranged from very poor to fair, 20 to 34 with an average of 25.5 (poor). Clarks Creek, tested in both 2001 and 2002, received the highest score of the basin with a 34 and a 28. Squally Creek received a score of 30 in Both Canyon Creek and Rody Creek received a 26 in Swan Creek was scored at 20 in 1999 and 22 in Two samples were taken on Swan Creek in One of the samples was taken in an area that had been disturbed by drainage facility maintenance activity and received the lowest score in the basin, 16. The maintenance negatively affected the streams conditions so another sample site was chosen 100 feet upstream, which received a much improved score of 26. Because the score of 16 did not accurately represent the overall conditions of the stream, the score was excluded from the analysis. One sample was taken in Diru Creek in Most of the organisms found in this sample were worms. A predominance of worms indicates a lack of biological diversity and typifies a sediment laden environment. Continued biological monitoring is planned in the Clear/Clarks Creek Basin and the rest of the basins in Pierce County. A number of streams will be selected on a yearly basis to be sampled for B-IBI. Data collected through biological monitoring will provide a reliable information base with which to track the changing conditions of the stream systems Water Features Crucial to Fish Habitat Perennial Stream Flow Tied to Groundwater A critical water feature observed in Swan, Squally, Clear, Diru, and Rody Creeks is significant groundwater influence. All the streams in the basin are gaining streams. A gaining stream is one where groundwater discharges into the stream and increases flow in a reach. Instream flow in Swan, Squally, Clear, Diru and Rody Creeks increases significantly in their lower reaches from groundwater, without the input of surface tributaries. Groundwater contribution, on the dates surveyed in August, was most pronounced in Clear and Swan Creeks, where approximately 80 % and 100 %, respectively, of the flow observed at Pioneer Way East did not exist at the 72nd Street East crossing. Evidence such as scour, landslides, culvert perching, and severe downcutting suggests that the flashy hydrology in these drainages is relatively recent. It is not clear whether this flashy surface hydrology has affected the amount and duration of subsurface flow that is occurring. However, it is probable that groundwater recharge is diminished with the increased surface runoff. Surface Water Temperature Linked to Groundwater Cool water temperature is crucial to salmonids. Instream temperatures during the months of stream surveying in August and September 2001 ranged from 9.5 C to12.5 C. This is considered an excellent temperature range for salmonid rearing. The temperatures are lower than commonly found in lowland Puget Sound streams, and are also indicators of subsurface flow. Pierce County Public Works & Utilities
123 CURRENT CONDITIONS 4.5 Wetland Habitat and Uplands Habitat The following two sections describe wetland and upland habitats of the Clear/Clarks Creek Basin based on a review of aerial photographs (Clear/Clarks Creek Watershed, Pierce County, April 2000), Pierce County GIS data (Clear and Clarks Creek Basin, Pierce County, December 2001), and on a brief field reconnaissance. The Clear/Clarks Creek Basin supports several plant communities including conifer, deciduous, and mixed conifer-deciduous forests, grassland (agriculture), and shrub land. These plant communities can be divided into three habitat types: upland, riparian, and wetland. Riparian habitat was described in Section 4.4. The wetland and upland habitats are described in this section Wetland Habitat Wetlands provide important habitats for plants and animals in addition to their value in flood storage and maintaining local hydrology. Fish, amphibians, waterfowl, birds of prey, and wetland mammals, such as beaver and muskrat, depend on various types of wetlands for food, forage, nesting, and cover. Wetlands also help to maintain water quality through biofiltration and groundwater recharge for streams. Wetlands are natural storage basins for floodwater as described in Section 4.3.2, Natural Drainage Features. Figure 4-12 shows the wetlands in the Clear/Clarks Creek basin. Limited quantified information is available regarding wetland loss trends in Pierce County or the Clear/Clarks Creek Basin. However, historical photographs and site plans for developments constructed prior to wetland regulations provide evidence that considerable wetland areas have been lost or altered in the Clear/Clarks Creek Basin due to urban development and agricultural land uses. Some of the wetlands adjacent to and part of the stream systems in the Puyallup River Valley were lost by filling, dewatering with drainage tile, and the channelizing of streams during the early 1900s to promote agriculture and other development to support people. Wetlands in the Clear/Clarks Creek Basin are associated primarily with the south-to-northoriented drainages. Many of the most substantial wetlands in the Clear/Clarks Creek Basin are located in the Puyallup River Valley. The low gradient and the confluences of several streams in the valley provides optimum physical conditions for wetlands to form. Wetlands such as those at the confluence of Squally Creek and Clear Creek tend to be large and complex, providing a variety of habitat types. Clear/Clarks Creek Basin currently encompasses 827 acres of freshwater wetland habitat, which represents approximately four % of the total basin area. Table 4-12 summarizes wetlands in the Clear/Clarks Creek Basin. The Clear Creek Basin has the greatest number and acreage of wetlands of all 16 subbasins. However, wetlands in the Diru Creek subbasin occupy nearly 10 % of the subbasin area, the highest %ages of wetlands in the creek drainages of the Clear/Clarks Creek Basin. Wetlands in the Lower and Upper 144th Street and the South Central Pothole occupy more than 10 % of the basin area. No wetlands have been documented in the 117th Street, 128th Street, Capital, Heritage Glen and Tip Top Potholes. Pierce County Public Works & Utilities
124 Y U Z ã a :; { { Œ Ž Œ Š ˆ žÿ ÇÈ PQR ST UV <=>?@ AB õô y uv wx { { {ž ƒ»¼½ Ï Õ ÔÓ! ÉÊÌË Ë`ÍÎ Ê É Í "$#&%('*), G š?œ XY Z] [\ XY VW U ] ^`_ a b _ c d b e f ghi*j h.k + +,.- /0-21 $ šœ. o q p po n lmn C D&E(F*G,H.I J$KLM*N L.O $ *. \ [Z WXY W ³ µœ * ¹ º ^`_ba c dfe gh#i ƒ { ~ } {z jlkm Ÿ Ÿ ÿ ý ÿ üýþ ü û À ¾ ú ¼ø¾ù ö À ¾ AB'C n nlo nlprqts u2vxw MÑ L ÔLÓ Õ K ì$íîï*ðñòœó DEGF H I F'J!#"$%'&)('* $ ƒ *. ˆ ÒÑ ÐÏ #6 5#67 ÃÆ Å ÃÄ Á 4 23 T RS QP NO Ö ØŒÙÚ*Û Ù Ü rst Š ŠŒ *Ž Õ Ñ MÑ L ÔLÓ Õ K Œ *±.² Ý Þ ßŒàá*â à ã «ª /01 / ä å æ&ç(è*é,ê.ë y z {}~* }. ä û â'ü<ß ä û Ü<ß.ã ë ܺã þ ü ëéþ fü'ýfü<ß è'úçß âfü ä þúþ âºã ë îgèéÿ æ Ü þ û ß ÞfÜfý àáß úbâ<ß þ Ü<ûã ù ầ úû Üfüfý#ã í í í í í í íõ ÛlǛ Ý Þ<ß àáß âfü#ã ä å àægçéè ä ægê êéçìë#à)è í î ä å êfà)æ ä ægêéê ç ëfàè í î ï ðòñ?óð å ê è æððôè ê#õ)ê å ñ öøí ñ ä ó ª ««««` ` ` ²±`³`³ µ µ º¹» µ ¼b½ ¾À µ Á  ½ à ÂÄfÅ.ÆǾ È É Ê Ë Ì Â ¼ Ê Á È µ Í Î Ï Ð Ñ Í µ Ò.Ó µ» ¼ ½ µ ½  ¼ ¾ ½ Ê µ à à à Ôb½  ¼ ¾b½ Ê Õ Ö» ¼b½ Ø»b½ à Ù#Ñ Ú Ú Ð#» Ö
125 CURRENT CONDITIONS TABLE 4-12 Summary of Number and Acreage of Wetlands in Clear Clarks Basin Subbasin Name Number of Wetlands Wetland Area (acre) Basin Area (acres) % of Wetland Area in Basin (%) Roosevelt Ditch Swan Creek , Squally Creek Clear Creek , Canyon Creek , Rody Creek Diru Creek Woodland Creek , Clarks Creek , th Avenue Pothole th Street Pothole th Street Pothole th Street Pothole Lower 144th Street Pothole Upper 144th Street Pothole Afdem Pothole Alderwood Pothole Black Swamp Pothole Candlewood-Manorwood Pothole Capital Pothole Heritage Glen Pothole Meridian Pothole South Central Pothole Springfield Pothole Tip Top Pothole Total , Wetlands in the northern end of the basin are associated with Clear Creek and are bounded by steep topography as the ravines drop off the plateau into the Puyallup River Valley. Wetlands in the ravines are part of the riparian corridor and are hydrologically connected with the streams. Landslides in the upper ends of the drainages block streams and create wetlands where water is impounded upstream. Beaver activity can also cause wetlands to form in the basin. Because the ravines are steep and largely undevelopable, the wetlands they contain have remained fairly Pierce County Public Works & Utilities
126 CURRENT CONDITIONS undisturbed. The slopes of the ravines are mostly vegetated with second-growth forest. Although separate from direct impacts from development, these ravine wetlands can be affected by indirect, nonpoint impacts, such as sedimentation and increased runoff from upstream sources. Wetlands on the plateau are less confined by steep topography and so are more sensitive to direct pressure from development. In the past, stormwater impoundments were sometimes located in wetland areas. Development can also result in a larger volume of stormwater runoff directed to the wetland areas. As a result, formerly emergent wetland areas become inundated which limits the wetland area to the fringe of open water. Wetlands in these fringe areas are primarily emergent and scrub-shrub communities. Wetlands located in the eight Pothole subbasins are especially important for groundwater recharge. Pothole basins do not have surface drainage; therefore, runoff generally infiltrates into the soil and drains from the basin via subsurface flow. This groundwater recharges streams and rivers in the lower basin, making wetlands in these areas a significant factor in maintaining instream flows. Wetland habitats in the basin include primarily freshwater emergent, scrub-shrub, and forested plant communities. Figure 4-12, Wetlands, illustrates the location of these wetland categories. The three types of wetland plant communities were identified during the field investigation and are briefly discussed below. Emergent Wetlands Emergent wetlands are located primarily in the lower and upper basin where topography is gentle, usually associated with impoundments that are permanently inundated. Dominant species of these wetlands include soft rush, small-fruited bulrush, slough sedge, cattails, velvet grass, and reed canary grass. In addition to grass species, Douglas spirea, red alder, and willows are also present. Scrub-Shrub Wetlands Scrub shrub wetlands are located throughout the Clear/Clarks Creek Basin. Scrub-shrub habitat was often associated with emergent and forested wetland habitat. Dominant species in these wetlands include willows, red alder, black cottonwood, and Douglas spirea. Forested Wetlands Forested wetlands are located primarily in riparian areas that are inaccessible to development within the steep ravines in many of the subbasins. Dominant species in these wetlands include black cottonwood, western red cedar, and red alder Upland Habitat Upland habitat in the Clear/Clarks Creek Basin includes primarily coniferous and deciduous forestland, grassland, and landscaped areas associated with residential, commercial, and light industrial development. Most of the uplands in the basin have been disturbed, leaving fragmented patches of forest land and grassland in a matrix of suburban development. With these changes in land use, invasive plants, most notably Scotch broom and bent grass, have established themselves throughout the basin. Pierce County Public Works & Utilities
127 CURRENT CONDITIONS Forest Land The lower reaches of the many of the creeks that drain the basin have considerable intact forest land associated with them. Many of these large tracts of forest land are also associated with parks such as Swan Creek Park, Orangegate Park, and Clarks Creek Park. In many cases, these greenbelts and parks are one and the same. One of the most substantial forest lands observed in the basin is located in the headwaters of Clarks Creek. This forest land is especially important because the City of Puyallup supplements its drinking water supply from springs that emerge in the subbasin. Douglas fir dominates most of the upland forest in the basin. The understory is dominated by salal, service berry, and red osier dogwood, with red alder saplings in open pockets. The dominant species in the forest edge are young Douglas fir, western red cedar, red alder, big leaf maple, and Himalayan blackberry. Most of the conifer and deciduous forest in the basin has been changed from its pre-european settlement condition by two to three timber harvests and over the last century conversion to agriculture and residential land uses. Grassland Grass species dominate the agricultural areas in the basin. Trees are sparse and are limited mainly to certain riparian areas and to wetlands with soils that are too wet to farm. Agricultural and developmental disturbances have significantly modified the species composition in the basin. Landscaped Areas Vegetation in residential and commercial areas is dominated by non-native ornamental trees and shrubs. Turf and non-native grasses are also a prevalent ground cover in the non-forested areas. 4.6 Water Quality Fishing and swimming are impaired uses within most of the streams and rivers in the watershed. Compliance with the State Surface Water Quality Standards (WAC a) is not occurring in Clarks Creek, Clear Creek and Swan Creek due to high fecal bacteria levels (Lower Puyallup Watershed Action Plan, 1995). According to Ecology s (d) list 1, four streams are currently listed as not attaining water quality standards: Clarks Creek (fecal coliform and ph) Clear Creek (fecal coliform) Meeker Ditch (fecal coliform, temperature, dissolved oxygen, ph) Swan Creek (fecal coliform) A stream on the 303(d) list is placed on a schedule for preparation of a TMDL. The City of Puyallup has been managing preparation of a TMDL study for Clarks Creek. A TMDL for BOD, Ammonia and Residual Chlorine was prepared for the Puyallup River watershed in 1993 (which included pollutant loading contributions from the Clear/Clarks Creek Basin). The TMDL divides capacity for BOD, Ammonia and Residual Chlorine among the point 1 The only 303(d) list approved by the U.S. E.P.A. is the (d) list. Pierce County Public Works & Utilities
128 CURRENT CONDITIONS dischargers in the Puyallup River Basin, including Pierce County stormwater. The discharge limits are administered through NPDES permits. (Ecology, 1983 and 2000). Other water bodies within the basin are likely to be included on the State s (d) list, and additional TMDLs will be developed with wasteload allocations for Pierce County Washington State Assessment of Water Quality Washington State s 2004 assessment of water quality sorts water quality determinations into five categories as follows: Category 1. Meets tested standards for clean water. (Note that a water body can be Category 1 for certain parameters, but listed on the 303(d) list for impairment from a different pollutant). Category 2. Waters of concern. Segments of streams that currently meet State water quality standards overall, but either where some exceedance have occurred, where there is a record of declining water quality even though the average is acceptable, or the expected level of urban development indicates that the stream is likely to become impaired unless remedial steps are taken. Category 3. No data or no usable data is available. Category 4. Polluted waters that do not require a TMDL: o Category 4a Has a TMDL o Category 4b - Has a pollution control plan o Category 4c - Impaired by a non-pollutant, such as containing a barrier to fish passage Category 5. Polluted waters that require a TMDL [The 303(d) list] Table 4-13 shows the 2004 assessment of water quality for the Clear/Clarks Basin. Change between 1998 and 2004 The (d) listing of Clarks Creek for fecal coliform and ph is unchanged in the 2004 listing. However, the 2004 assessment adds fish habitat, fish passage barriers and dissolved oxygen as impairments to the quality of water for fish. Fish habitat is a significant beneficial use. The general pattern is repeated in Swan Creek, Clear Creek, and Meeker Ditch. Pierce County Public Works & Utilities
129 CURRENT CONDITIONS Creek TABLE Assessment of Water Quality for the Clear/Clarks Creek Basin a Reach Extent State Assessment Category Swan Creek Pioneer Way East to Clear Creek 5 Fecal Coliform Water Quality Parameter Swan Creek Pioneer Way East to Clear Creek 4c Fish Habitat b, Instream Flow Swan Creek 80th Street E to 64th Street East 112th Street E to 99th Street East 4c Fish Passage Barrier Squally Creek 48th Street East to Pioneer Way East 4c Fish Habitat, Instream Flow Clear Creek Gay Road to Puyallup River 5 Fecal Coliform Clear Creek Gay Road to Puyallup River 4c Bioassesment, Fish Habitat, Instream Flows Clear Creek 64th Street East to 48th Street East 4c Fish Habitat, Instream Flows Clear Creek Gay Road to Swan Creek 2 Dissolved Oxygen Rody Creek 80th Street East to Clarks Creek 4c Fish Habitat, Fish Passage Barrier Diru Creek Township 20, Range 4, Section 29 4c Fish Habitat, Instream Flows Meeker Ditch 5th Street SW to 4th Street SW 5 Fecal Coliform, ph Meeker Ditch 9th Street SW to Clarks Creek 4c Fish Habitat, Instream Flow Meeker Ditch 5th Street SW to 4th Street SW 2 Dissolved Oxygen, Fecal Coliform, Temperature Clarks Creek Township 20, Range 4, Section 30 5 Fecal Coliform, ph Clarks Creek WDFW Fish Hatchery to 10th Avenue SW 4c Fish Habitat, Fish Passage Barrier Clarks Creek 1,500 feet upstream of Stewart Road to Puyallup River 2 Dissolved Oxygen Clarks Creek WDFW Fish Hatchery to 10th Avenue SW 1 Temperature a Source: Washington State Department of Ecology website b Fish habitat is defined by Ecology as habitat, which is used by fish at any life stage at any time of the year including potential habitat likely to be used by fish, which could be recovered by restoration or management and includes off-channel habitat. The Category 4c list of waters impaired for fish use was not a part of the 1998 Water Quality Assessment. Fish passage barriers are addressed in the fish habitat descriptions of this chapter. The Lower Puyallup Watershed, Phase 1 Report (1992) stated that water quality testing in the Lower Puyallup had been sporadic and had been performed by a number of different agencies using different analytical methods. Nevertheless, many of the sampling results have been used by Ecology to place the streams on the 303(d) list. Statewide, data submittals for the preparation of Washington State s (d) list increased 10-fold over Water quality data have been collected in Swan Creek, Clear Creek, Diru Creek, Rody Creek, and Clarks Creek from 1983 through The USGS performed sampling on Clear Creek, Clarks Creek, Diru Creek, and Swan Creek during 1983 and Pierce Conservation District Pierce County Public Works & Utilities
130 CURRENT CONDITIONS (PCD) has been collecting samples from Clarks Creek at numerous locations since the late 1980s. KCM collected samples from Clarks Creek and Meeker Ditch in 1996 for the City of Puyallup, in cooperation with the PCD and the Puyallup Tribe. Ecology collected samples from Clear, Clarks, and Swan Creeks during an intensive sampling program in 1990 to calibrate their water quality model in support of the Puyallup River TMDL Study. The Puyallup Tribe has been collecting water quality samples from Clear, Clarks, Swan and Diru Creeks since The sources of water quality data include the United States Geological Survey (USGS), August 1983 through September 1984; KCM, Inc., 1996; and the Puyallup Indian Tribe, 1998 through Table 4-14 shows a summary of water quality data for various tributaries within the Clear/Clarks Creek Basin. Note that the average water temperature at all of the sampling sites among the tributaries exceeded 8.0 C (46ºF) but was substantially less than 18ºC (64.4ºF) permitted for Class A waters of the State. Average dissolved oxygen in milligrams per liter (mg/l) among the tributaries ranged from 9 to 14 mg/l. The average nitrate levels were between 0.5 to 2.7 micrograms per liter (µg/l). The lowest measurements were at the middle of Swan Creek and in Diru Creek downstream of the hatchery. Average phosphorus levels ranged between 0.1 µg/and 0.2 µg/l. The fecal coliform geometric mean for the different tributaries ranged from 20 to 2,500 MPN/100 ml. With a standard of 100MPN/100 ml, Clarks Creek at several locations, the East Fort of Clear Creek at 72nd Street East, and Swan Creek at 72nd Street East are problems. Potential sources of fecal coliform bacteria vary among the creeks. A study for the City of Puyallup is currently investigating the source of the fecal contamination in Clarks Creek through Microbial Source Tracking. The preliminary results shown below indicate that the main sources of fecal bacteria are from birds and rodents, with minimal contributions from canines, felines and humans. A USGS study observed higher densities of fecal coliform during storms, which suggests that storm runoff might be a source of fecal bacteria in the streams (USGS, 1987). State water quality standards are reproduced in Table Revised Water Quality Standards Ecology adopted major revisions to the State water quality standards in EPA must approve them before they can become effective. This should occur in Among the changes is a significant reduction in maximum temperature. The reduction in temperature reflects the designation of specific waterbodies as char spawning and early tributary rearing areas. The proposed standards are expected to have major effects on future 303(d) listings in the Clear/Clarks Creek Basin and County-wide Roosevelt Ditch Basin Roosevelt Ditch is a large fenced ditch that flows north from 80th Street East to 72nd Street East. A tributary ditch transports stormwater from 88th Street East to Roosevelt Ditch. The ditch is regularly maintained by the Pierce County Water Programs. Maintenance includes the trimming of grass and cattails, as well as the removal of blackberry bushes and small trees that threaten capacity of the ditch. Pierce County Public Works & Utilities
131 CURRENT CONDITIONS TABLE 4-14 Average Water Quality Data and Geometric Mean for Fecal Coliform for Lower Puyallup Tributary Sampling Sites Station Temp ( C) Dissolved Oxygen (mg/l) Nitrate Nitrite (µg/l) Total Phosphorus (µg/l) Fecal Coliform** (MPN/100 ml) Clear Creek at mouth Clear Creek at 31st St E East Fork Clear Creek at 72nd St E N/A Swan Creek at mouth Swan Creek at 72nd St E and 84th St E Rody Creek at Pioneer Way E Diru Creek below Hatchery Diru Creek above Hatchery Clark Creek at mouth Clark Creek at 66th St E Clark Creek at convergence with Woodland Creek Clark Creek near Pioneer Way E Clark Creek below Hatchery Clark Creek above Hatchery Water Quality Standard as of March/2004 Sources: 1 USGS Water-Resources Investigations Report , KCM, Inc., Puyallup Indian Tribe, <18º C >=8 mg/l None None 100 / 100ml Pierce County Public Works & Utilities
132 CURRENT CONDITIONS TABLE 4-15 Water Quality Criteria for Freshwater Class A in the State of Washington (WAC ) Parameter Standard as of March 2004 Fecal Coliform Bacteria Shall not exceed a geometric mean value of: With not more than 10% of samples exceeding: Dissolved Oxygen Shall exceed: Temperature 1 Turbidity ph 100 col./100 ml 200 col./100 ml 8.0 mg/l Shall not exceed: 18 C When background turbidity is 50 NTU or less, shall not exceed background turbidity by: When background turbidity is more than 50 NTU, shall not have more than an increase of: 5 NTU 10% Shall be within the range of: 6.5 to Proposed standard is 17.5 C pending EPA approval Nonpoint pollution is a water quality concern in the Roosevelt Ditch Basin. Portland Avenue East and other heavily traveled roads are a likely source of organic compounds, oil and grease. Sediments are another source of nonpoint pollution that probably affects water quality in Roosevelt Ditch. However, there are no water quality data available for Roosevelt Ditch Clear Creek Basin The Washington State Department of Ecology (Ecology) rates Clear Creek to be a fishable, but not swimable. Ecology placed the creek on the (d) list for fecal coliform bacteria. Nutrients and siltation were important factors in the determination, while pathogen indicators (fecal coliform bacteria) and low dissolved oxygen levels were moderate factors. Periodic low dissolved oxygen levels were determined to be a moderate problem, and are most likely caused by elevated nutrient concentrations. The sources of these problems were a combination of land development, runoff, septic on-site sewer systems, pasture land, animal management areas, channelization of streams, dredging, vegetation removal, stream bank modification, and highway runoff (Ecology, 1990). Table 4-15 summarizes water quality data for Clear Creek. In Clear Creek, altered hydrology from impervious surfaces in the upper watershed has led to erosion and sedimentation similar to that in Swan Creek. In Clear Creek, the channel has incised as much as 10 feet with vertical exposed banks below the 72nd Avenue East culvert. The most severe erosion observed in the Clear Creek Basin was below this culvert, with exposed banks continuous on both sides of the creek for 150 feet downstream of the culvert. A private Pierce County Public Works & Utilities
133 CURRENT CONDITIONS homeowner, interviewed on 72nd Avenue East, described how his backyard fence has required rebuilding due to the slumping land below. Exposed banks and slides of shorter length were also observed between the 45th Street East cul-de-sac and Pioneer Way East on Clear Creek. The Port of Tacoma constructed a habitat restoration project at the mouth of Clear Creek, which was completed in The 11-acre site containing a maze of ponds and wetlands was designed to enhance salmon habitat. While the effects and benefits of the project are still being analyzed by the Port, it is expected to have a positive effect on water quality. TABLE 4-16 Clear Creek Sampling Summary Organization/Location Parameter Sampled by the Puyallup Tribe Clear Creek at Gay Road East Temp (C) DO (mg/l) Nitrate- Nitrite (mg/l) Total P (mg/l) Fecal Coliform (col./100ml) Turbidity (NTU) Mean Maximum Minimum Number of Samples Source: Puyallup Tribe of Indians, 2003 ph Swan Creek Subbasin Swan Creek is listed for fecal coliform in the 1998 and (d) lists. Ecology rates Swan Creek as neither swimable nor fishable. Table 4-17 summarizes water quality data for Swan Creek. The 1992 Lower Puyallup Watershed Characterization Report cited nutrients and fecal coliform (the pathogen indicator) as probably stemming from pasture land, animal management areas, urban runoff and dredge mining. Samples taken by Pierce Conservation District found a minimum level of dissolved oxygen in Swan Creek to be 7.75 mg/l. Swan Creek had ph levels ranging from 6.17 to 8.07and a mean turbidity value of 28 NTU. High levels of sediment build up were reported in the lower reaches of Swan Creek, reflected the elevated turbidity values of 28 NTU. The State standard is 5 NTU. The Midland area, located between 74th Avenue East and Portland Ave, and extending from SR 512 to 72nd Street East (see Section 4.2), is exhibiting water quality problems associated with the combination of low percolation rates and septic tanks. The effluent that is intended to percolate down through the soil instead rises with the water table during the wet season creating a water quality problem. Pierce County Water Programs constructed a sedimentation/detention pond on Swan Creek in the valley in 1991 to meter high flows and allow sediments to precipitate. In the past, sediment was dredged from under the Pioneer Way Bridge over Swan Creek to prevent flooding. Dredging is Pierce County Public Works & Utilities
134 CURRENT CONDITIONS detrimental to fish according to the US Fish and Wildlife Service. Maintenance is performed annually or after major storm events to remove sediments accumulated in the pond. The City of Tacoma has constructed an off-channel wetland adjacent to Swan Creek, between Pioneer Way East and the railroad tracks. Flows enter the restored wetlands through a bypass channel. The vegetation and quiescent environment improve water quality and provide habitat for juvenile salmonids. TABLE 4-17 Swan Creek Sampling Summary Organization/Location Parameter Sampled by Pierce Conservation District ph DO (mg/l) Swan Creek Park, upstream of hiking bridge Nitrate (mg/l) % DO Air Temp C Water Temp C Discharge (cfs) Max Min Average # of Samples Swan Creek Park, downstream of hiking bridge Max Min Average # of Samples nd Street East Max Min Average # of Samples Source: Pierce Conservation District Squally Creek Subbasin No water quality sampling data was located for Squally Creek. However, a 1993 feasibility study for a detention pond investigated water quality of Squally Creek qualitatively. The study identified land-use and potential nonpoint pollution sources. In 1993 the Squally Creek Subbasin was zoned for one-acre single family residences. Land use existing in the basin consisted of livestock grazing, small farms and residences. Steep, easily eroded roadside ditches along 57th Street East and 64th Street East were listed as a source of sediments. Heavily used roads, particularly Waller Road East, were noted as a potential source of metals, oils and grease, suspended solids, and organic compounds. Debris dumping was cited as a problem. Construction with inadequate erosion and sedimentation controls was also listed as a source of pollutants. Agriculture and hobby farms were noted as possible source of pollutants such as nitrates and fecal coliform (KCM, Inc., 1993). Pierce County Public Works & Utilities
135 CURRENT CONDITIONS In Squally Creek, sediment has a large sand component. Flow in the lower reaches of the creek are very shallow, wide, and braided, with large pockets of standing water. Because of the color, size, and sand-like similarities, the Squally Creek sediments appear to be from glacial deposits that are currently exposed in the stream banks. Deposition immediately upstream of Pioneer Way in the Squally Creek channel also appears to be partially the result of large amounts of road fill placed in the channel during construction of Pioneer Way East. The fill appears to have caused a backwatering effect, creating a semi-inundated swamp-like habitat with multiple stream channels. The portion of Squally Creek downstream of the 48th Street East crossing is also currently a source of fine sediments. A detention facility was constructed along Squally Creek in 1995 with the intent of reducing erosion and sedimentation in the basin. The pond does not include any dedicated water quality features, although as it reduces peak storm event flows, it helps to reduce erosion and sediment deposits lower in the stream system. The pond might contribute to the bacterial and fecal problem in Clear Creek due to the water fowl that use the pond. The open, often stagnant water in the pond could increase water temperature directly downstream of the pond. But, Squally Creek has good riparian characteristics in the canyon reaches of the stream that extend up to 58th Street East; this probably mitigates some of the water temperature increase from Squally Creek Pond. In the lower reaches of the stream from Pioneer Way East to the confluence with Clear Creek, the excess of sediments contributes to invasive riparian vegetation. Canyon Creek Subbasin No water quality sampling data was located for Canyon Creek, the most easterly tributary to Clear Creek. The Canyon Creek Subbasin is a very narrow basin that drains an area of approximately four square miles on either side of Canyon Road East. Zoning in the headwaters of the creek and along Canyon Road to 104th Street East is urban, high-density residential and commercial. There is a commercial node at 84th Street East. The remainder of the subbasin is zoned Rural Separator. Despite rural zoning, the subbasin has experienced a significant amount of development in the last fifteen years along Canyon Road East bringing with it urban stormwater, increased peak flows eroding canyon sections of the stream banks, and sediment deposits in valley reaches. The County is designing a detention facility to curtail over-the-road flooding at 90th Street East (Canyon Creek Bypass Project No. D ). Facilities typically include certain features to improve water quality. Pre-design water quality data would benefit an understanding of existing water quality conditions and help to identify the most effective aspects of facility design from a water quality perspective Clarks Creek Basin Clarks Creek is on the (d) list for fecal coliform bacteria and ph. Clarks Creek has inherently high nutrient levels because of high nitrogen levels in the groundwater that feeds the upper reaches of Clark Creek. It is not known if the high levels of nitrogen in the groundwater are naturally occurring. Nitrate leaching into groundwater occurs when the depth to groundwater is shallow and underlying soil is sandy allowing the nitrate to be easily moved by water. Nitrogen fertilizers and animal manure are possible sources of nitrates that may enter groundwater. However, the decaying of organic matter in soil is a natural process that also adds Pierce County Public Works & Utilities
136 CURRENT CONDITIONS nitrates into the system. The USGS Ground-Water Hydrology of the Tacoma-Puyallup Area reports that nitrate concentrations at Maplewood Springs have shown and increasing trend of 0.05 mg/l per year. This may be an indication that land use, not natural causes, is affecting the nitrate levels in groundwater. As the basin is developed and ground water infiltration is impeded, it is possible to see a reduction in the amount of nitrate in the soil system. Table 4-18 summarizes water quality data for Clarks Creek. Ecology rates Clarks at fishable but not swimable. Nutrients and pathogen indicators are likely the cause of non-attainment. Runoff, storm sewers, vegetation removal, and stream bank modification are frequent causes of non-attainment. Other contributing sources include irrigated and specialty crops, land development, and flow regulations (Lower Puyallup Watershed, Phase 1 Report, 1992). The City of Puyallup has sponsored a pollution reduction study leading to a fecal coliform TMDL for the Clarks Creek basin and a cleanup action plan. The KCM Technical Memorandum (KCM, Inc., 1996) reports high levels of fecal coliform, bacteria, and nutrients over most of the Clarks Creek Basin. The only area excluded from this generalization was the area upgradient from the fairgrounds (no runoff received from the South Hill Mall area). Runoff from the fairgrounds, the South Hill Mall area, and the land along Meeker Ditch were identified as likely sources of pollutants to the ditch. The problem from the fairgrounds may have been corrected by a series of stormwater and collection system improvements and the discontinuation of direct animal wash water discharges to the storm system. The Memorandum also lists the WDFW fish hatchery as an apparent source of nutrients and possibly TSS to Clarks Creek. The duck pond at DeCoursey Park was reported as an apparent source of fecal coliform bacteria and nutrients. The mouth of Clarks Creek registered high levels of bacteria and nutrients. The KCM Technical Memorandum concluded that pollutants continue to enter the creek throughout its length. High levels of nitrogen are found in Clarks Creek due to the high nitrogen levels in the groundwater feeding the creek. The nitrogen might occur naturally in the groundwater; however, at this time it is not known. The upper reaches of Clarks Creek exhibit relatively low fecal coliform counts, while the downstream area (through DeCoursey Park in Puyallup) had a very high level of fecal coliform. This area has a large population of wildlife (ducks and geese) because many people feed them (PCD, 1990). Pierce County Public Works & Utilities
137 CURRENT CONDITIONS Clarks Creek at 56th Street Birds 44% Unknown 13% Sewage 3% Raw Sewage 3% Rodent 6% Raccoon 3% Human 6% Canine 13% Feline 9% Figure 4-13 Clarks Creek Microbial Source Tracking Results (MST) was used to identify the sources of fecal contamination. DNA taken from water samples is compared to library of 50,000 source samples to determine the general category of the source. (Clarks Creek Pollution Prevention Program, City of Puyallup, 2003). TABLE 4-18 Clarks Creek Sampling Data Organization/ Location Parameter Sampled by KCM, Inc. TSS (mg/l) Clarks Creek at 56th Street East Total P (mg/l) SRP (mg/l) NH3 (mg/l) NO3+NO2 (mg/l) Fecal C #/100 ml BOD (mg/l) DO (mg/l) Max Min Average # of Samples Clarks Creek near Pioneer Avenue (in the City of Puyallup) Max Min Average # of Samples Clarks Creek Downstream of Meeker Ditch Max Min Average # of Samples Pierce County Public Works & Utilities
138 CURRENT CONDITIONS TABLE 4-18 Clarks Creek Sampling Data Organization/ Location Parameter Sampled by KCM, Inc. TSS (mg/l) Total P (mg/l) Clarks Creek at Confluence with Meeker Ditch SRP (mg/l) NH3 (mg/l) NO3+NO2 (mg/l) Fecal C #/100 ml BOD (mg/l) DO (mg/l) Max Min Average # of Samples Clarks Creek near Maplewood Springs Max Min Average # of Samples Clarks Creek Max Min Average # of Samples Sampled by the Conservation District ph Clarks Creek at DeCoursey Park DO (mg/l) Nitrate (mg/l) % DO Air Temp (C) Water Temp (C) Discharge (cfs) Max Min Average # of Samples Clarks Creek at 2612 Tacoma Road, upstream of bridge Max Min Average # of Samples Clarks Creek at WDFW Fish Hatchery Max Min Average # of Samples Pierce County Public Works & Utilities
139 CURRENT CONDITIONS TABLE 4-18 Clarks Creek Sampling Data Organization/ Location Parameter Sampled by the Conservation District ph DO (mg/l) Nitrate (mg/l) Clarks Creek at Washington State University Extension % DO Air Temp (C) Water Temp (C) Discharge (cfs) Max Min Average # of Samples Rody Creek Subbasin Rody Creek is an intermittent stream that is tributary to Clarks Creek. Ecology rates it as fishable, but not swimable. Nutrients and pathogen indicators are the primary factors in this determination. Sources included runoff (high), pasture land, animal management areas, land development, and highway runoff (moderate) and septic systems (slight) (Ecology 1990). Table 4-20 summarizes water quality data for Rody Creek. Limited sampling has occurred on Rody Creek. Preliminary Microbial Source Tracking (MST) for Rody Creek undertaken for the Clarks Creek TMDL study indicates that birds and rodents are the leading contributors to the fecal contamination problem. Dogs and humans comprise the next two highest contributors. The human factor may be due to reliance on on-site sewer systems because the Rody Creek drainage area is outside of a sanitary sewer service area. Results of the MST on Rody Creek are presented below in Figure Rody Creek Birds 29% Rodent 29% Raccoon 4% Canine 21% Figure 4-14 Rody Creek Microbial Source Tracking Results Deer/Elk 4% Human 13% Pierce County Public Works & Utilities
140 CURRENT CONDITIONS (MST) was used to identify the sources of fecal contamination. DNA taken from water samples is compared to library of 50,000 source samples to determine the general category of the source. (Clarks Creek Pollution Prevention Program, City of Puyallup, 2003). TABLE 4-19 Rody Creek Sampling Data Organization/ Location Parameter Sampled by KCM, Inc. TSS (mg/l) Total P (mg/l) SRP (mg/l) NH3 (mg/l) NO3+NO2 FECAL C BOD DO Mouth of Rody Creek (mg/l) #/100 ml (mg/l) (mg/l) Max Min Average # of Samples Diru Creek Subbasin Diru Creek is listed on the (d) list for fecal coliform. Of all the streams listed in the Clarks/Clear Basin for fecal coliform, Diru had the lowest fecal coliform counts. Table 4-20 summarizes water quality data for Diru Creek. Diru Creek has been designated by Ecology as swimable but not fishable. The 2002 and (d) reports list habitat and in-stream flow problems as limiting fish populations. Water quality in Diru Creek is important because its waters supplement the well-water used by the Puyallup Tribe s fish hatchery. In addition, Diru Creek contributes to Clarks Creek where the Tribe is constructed a rearing facility and planning to release juvenile fish. Diru Creek Deer/Elk 4% Canine 4% Dog 8% Bovine 4% Birds 4% Unknown 38% Rodent 38% Figure 4-15 Pierce County Public Works & Utilities
141 CURRENT CONDITIONS Diru Creek Microbial Source Tracking (MST) Results MST was used to identify the sources of fecal contamination. DNA taken from water samples was compared to a library of 50,000 source samples to determine the general category of the source. (Clarks Creek Pollution Prevention Program, City of Puyallup, 2003). TABLE 4-20 Diru Creek Sampling Data Organization/ Location Parameter Sampled by KCM, Inc. Mouth of Diru Creek TSS (mg/l) Total P (mg/l) SRP (mg/l) NH3 (mg/l) NO3+NO2 (mg/l) FECAL C #/100 ml BOD (mg/l) DO (mg/l) Max Min Average # of Samples Source: KCM, 1993 Woodland Creek Subbasin Woodland Creek is a tributary of Clarks Creek that has not been evaluated under the WAC standards and therefore has not been rated by Ecology. The stream flows approximately four miles before flowing in the Clarks Creek downstream of Pioneer Way East. Woodland and Clarks Creek have sediment deposits downstream of Pioneer Way East like all of the other streams in the basin. But unlike the Rody Creek and Diru Creek, the sediments observed in Woodland and Clarks Creeks extend above Pioneer Way East. Sediments also have a darker color and finer texture characteristic of sediments that have entered the channel at street crossings. The sections of Woodland Creek above and below 84th Street East are currently sources of fine sediments. Table 4-21 summarizes water quality data for Woodland Creek. The width of the riparian corridor is closely related to the width of the ravine that contains the stream, Woodland Creek and Clarks Creek have the smallest riparian corridors of all the streams in the basin. The most severe incising occurs in Woodland Creek, above and below the 84th Street East crossing. Along Woodland Creek, the exposed soil layers appear to have higher clay content, and have subsequently resisted sloughing and slumping. However, downcutting in Woodland Creek was observed at depths of as much as eight feet, often in places with a channel width of only two to three feet. Very limited sampling data is available for Woodland Creek. Further sampling of Woodland Creek will take place as the City of Puyallup works to complete their TMDL study. Woodland Creek will be sampled as part of the study, before summer In addition, the Microbial Source Tracking results presented below describe the sources of fecal contamination. The human contribution to the fecal coliform problem may be due to the preponderance of residences in the basin using on-site sewer systems. Most of the basin is outside of a sanitary service area. Pierce County Public Works & Utilities
142 CURRENT CONDITIONS Woodland Creek Rodent 11% Human 11% Birds 52% Canine 26% Figure 4-16 Woodland Creek Microbial Source Tracking Results (MST) was used to identify the sources of fecal contamination. DNA taken from water samples is compared to library of 50,000 source samples to determine the general category of the source. (Clarks Creek Pollution Prevention Program, City of Puyallup, 2003). TABLE 4-21 Woodland Creek Sampling Data Organization/ Location Parameter Sampled by KCM, Inc. TSS (mg/l) Mouth of Woodland Creek Total P (mg/l) SRP (mg/l) NH3 (mg/l) NO3+NO 2 (mg/l) FECAL C #/100 ml BOD (mg/l) Max Min Average # of Samples DO (mg/l) Meeker Ditch Meeker Ditch within the City of Puyallup is the largest tributary to Clarks Creek, receiving runoff from residential and commercial areas (including parts of the South Hill Mall), the State Fairgrounds, and numerous hobby farms. Meeker Ditch has exhibited historical water quality problems, and is on the (d) list for fecal coliform bacteria, temperature, dissolved Pierce County Public Works & Utilities
143 CURRENT CONDITIONS oxygen, and ph. Likely sources include urban runoff and a lack of best management practices at the Fairgrounds animal handling operations. The City of Puyallup has apparently been addressing this last problem during the past several years. Table 4-22 summarizes water quality data for Meeker Ditch. Ecology rated Meeker Ditch in 1990 as neither swimable nor fishable. Nutrients, siltation, oil and grease, high temperature, and odor were factors in this determination. Cited sources of contamination included land development, runoff, channelization (putting the original stream into its present ditch), and vegetation removal. Dredged was noted as having a moderate effect on the designation (Ecology 1990). The County has received complaints about elodea (a type of aquatic vegetation) problem in Meeker Ditch. Meeker Ditch above Clarks Creek Birds 21% Unknown 21% Dog 4% Deer 11% Raccoon 11% Rodent 32% Figure 4-17 Meeker Ditch Microbial Source Tracking Results (MST) was used to identify the sources of fecal contamination. DNA taken from water samples is compared to library of 50,000 source samples to determine the general category of the source. (Clarks Creek Pollution Prevention Program, City of Puyallup, 2003). TABLE 4-22 Meeker Ditch Sampling Data Organization/ Location Parameter Sampled by KCM, Inc. TSS (mg/l) Total P (mg/l) Upstream from the confluence w/clark SRP (mg/l) NH3 (mg/l) NO3+NO2 (mg/l) FECAL C #/100 ml BOD (mg/l) DO (mg/l) Max Min Average # of Samples Pierce County Public Works & Utilities
144 CURRENT CONDITIONS TABLE 4-22 Meeker Ditch Sampling Data Organization/ Location Parameter Sampled by KCM, Inc. TSS (mg/l) Total P (mg/l) SRP (mg/l) NH3 (mg/l) NO3+NO2 (mg/l) FECAL C #/100 ml BOD (mg/l) DO (mg/l) Upper end of Meeker Ditch Max Min Average # of Samples Potholes Basin Potholes infiltrate collected stormwater into the ground or it is conveyed via the South Hill Pump Station directly to the Puyallup River. Water quality issues for the potholes differ from the stream basins by being associated with protection of ground water quality. Groundwater contamination from storm drainage sources can include: pathogens/ bacteria, metals, organic compounds, pesticides, and oil and grease. Spills and illicit discharges can also be harmful to groundwater quality if they go undetected. Sediments can affect the functioning of stormwater disposal facilities by clogging on-site sewer system drainfields or stormwater infiltration facilities or reducing the infiltration capacity/rate. Groundwater contamination from any source is a problem because the area uses a significant amount of groundwater for drinking water. Although most public water supplies come from deep aquifers generally thought to be protected from surface contamination, the degree of protection necessary has been recognized by the federal government in declaring this area part of a sole source aquifer. According to the USGS Water Resources Investigation Report , ground water quality in the potholes area is generally good. Nitrate concentrations in this study were reported to be 2.0 mg/l which is well below the primary drinking water standard of 10.0 mg/l. Analysis of data collected since 1975 performed for the investigation report indicates that nitrate concentrations in groundwater from Maplewood Springs are increasing at a rate of 0.05 mg/l per year. Nitrate in ground water is usually derived from sources at or near the surface and the increasing trend observed in groundwater from Maplewood Springs is thought to be a result of changing land use within the basin. Infiltration capacity/rate of stormwater disposal facilities can be compromised by excessive sediments. To some extent this has been a problem within the potholes basins. The 128th Street Pothole has had a reoccurring problem with clogging of the infiltration system. This was especially noticeable during the winters of when a combination of heavy rains and nearby construction caused clogging of the infiltration system and the resultant flooding of 128th Street East. Pierce County Public Works & Utilities
145 IDENTIFICATION OF PROBLEMS CHAPTER FIVE Identification of Problems Chapter Five documents the current flooding, riparian/aquatic habitat, water quality and other surface water management problems in the Clear/Clarks Creek Basin that were identified during the basin characterization. Problems listed in Chapter Five are analyzed in chapters six, seven, and eight. The analyses in chapters six, seven, and eight also supplement the problems listed here with forecasts of problems likely to occur due to the soils in the Basin, the topography, rainfall patterns, planned land use, existing regulations and the way regulations are administered and enforced. 5.1 Sources Used for Problem Identification The storm drainage and surface water management-related problems covered in this chapter are derived from several sources. In some cases, reports and studies cited in the existing conditions description (Chapter Four) identified problems. Other problems were reported by citizens and County staff during or after major storms and are on record in the Service Response System (SRS). The SRS is maintained by Pierce County Water Programs and integrated into the County s geographic information system (GIS). Citizens and businesses also reported problems during public meetings, or by responding to questionnaires. Cities, County departments, drainage districts, Pierce Conservation District, the Puyallup Tribe of Indians, and State and federal agencies shared information on aquatic habitat, water quality, flooding, consistency with land use, and storm drainage concerns. The sources of information include: Pierce County Service Request System (SRS) database The SRS database contains complaints and service requests for all County services from 1998 to the present. The SRS database contains entries that pertain to drainage, flooding, water quality, aquatic habitat, or erosion/sedimentation problems used for this report. Pierce County Water Programs Flood of 96 (F96) and Flood of 97 (F97) databases During the winters of 1996 and 1997, Pierce County experienced severe storms. During these events, Pierce County set up a call center to handle the large volume of complaints. Information related to the large storm events was used to create the Flood of 96 and Flood of 97 databases. Pierce County Water Programs Complaint Files ( ) Pierce County Water Programs has other written surface water complaint records on file. In some cases, the complaints had additional data associated with them. The additional data varied in content and included such items as service requests for the maintenance department, notes from a field visit, communication between County departments, petitions, and legal documentation. Pierce County Public Works & Utilities 5-1
146 IDENTIFICATION OF PROBLEMS Pierce County Water Over Road Sign Postings Record Pierce County also provided a list of road intersections and road segments where Roads Maintenance or Water Programs staff posted Water Over Road signs during storm events. Pierce County Water Programs Questionnaire Responses (Spring 2001) The County mailed a questionnaire to residents within the Clear/Clarks Creek Basin in April The survey offered property owners and other interested parties within the basin an opportunity to comment on flooding, habitat, water quality and other storm drainage problems. Riparian Habitat Field Visits (Summer and Fall 2001, Spring 2003) Information from field visits conducted by CH2M HILL staff noted some of the same problems that were cited by other sources. In some cases, the cause of those problems was observed. Pierce County Water Programs Staff Pierce Conservation District Pierce County Transportation Planning & Road Maintenance staff Draft Repetitive Loss Plan (Pierce County, January 2001) 303(d) List (Washington State Department of Ecology, 1998) Pierce County Storm Drainage and Surface Water Management Master Plan, James M. Montgomery Consulting Engineers, Inc., 1991 Existing Conditions Research Findings Presented in Chapter Four Additional Analysis of Arterial Culverts Additional analysis was extended to arterial roadway culverts shown by the results of hydraulic modeling to be at risk of flooding when: The expected increase in effective impervious area in the upstream tributary area under future land use conditions was greater than 25%; and Less than 0.5 feet of freeboard exists between the top of the culvert and the roadway. 5.2 Problem Investigation Information from the first seven sources was compiled into a database and the location of the complaint was noted on a map. With this spatial representation and complaint descriptions, problems were grouped into drainage issues. For example, if there were several complaints regarding flooding at a specific intersection, the complaints were grouped into a single drainage problem/issue. Each drainage issue was given a unique identification number beginning with a designation corresponding to the subbasin (e.g., Swan Creek problems have the prefix SW ). Pierce County Public Works & Utilities 5-2
147 IDENTIFICATION OF PROBLEMS A basin map, showing active and unresolved drainage issues, was used during interviews with Pierce County Water Programs staff knowledgeable about the Basin. Water Programs staff provided insight on the causes of some of these drainage issues. They identified the problems already corrected and the solutions implemented. Certain problems had Small Works or CIP projects to correct them pending in the near future. For example, some of the flooding problems within the pothole area were fixed with construction of the South Hill pump station and related improvements (South Hill Drainage Improvements, Pierce County Department of Public Works and Utilities,, November 2001). Certain problem solutions were referred to other County or local agencies. Drainage complaints that were classified as active, unknown, or closed without resolution, required further investigation. Follow-up calls, when contact numbers were available, provided additional insight as to the specifics of the complaint, if the problem still existed, how frequent the problem, and what work had been done to correct the problem, either privately or by the County. The classification of the problem was then updated in the database. An updated basin map was refined with these additional sources of information. The refined map was used to interview Pierce County Road Maintenance and Water Programs Maintenance staff. Maintenance staff responds on a daily basis to drainage problems in the field. When problems cannot be corrected with routine maintenance and repair, they are referred to staff responsible for long-range planning and capital projects. These two sections of the Public Works and Utilities Department were able to identify the causes of the remaining storm drainage problems. Tables 5-1, 5-2, 5-3, and 5-4 list the storm drainage problems of the Clear Creek, Clarks Creek, Potholes Area, and Roosevelt Ditch drainage basins that require further analysis and solution alternatives. The locations of the storm drainage problems itemized in the tables are illustrated in Figures 5-1, 5-2, and 5-3. Separate figures illustrate the problem locations in the major drainage divisions of the Clear/Clarks Creek Basin. Figure 5-1 presents the Clear Creek Basin and the adjoining Roosevelt Ditch drainage area. Figure 5-2 shows problems in Clarks Creek Basin. Figure 5-3 displays problem locations within the Potholes drainage area. Pierce County Public Works & Utilities 5-3
148 IDENTIFICATION OF PROBLEMS TABLE 5-1a Swan Creek Flooding, Riparian/Aquatic Habitat, Erosion and Water Quality Problems Problem ID Type Location Description SW-1 Flooding / Riparian/ Aquatic Habitat 80th Street East Swan Creek overtops 80th Street East. Roadway runoff causes property flooding in the 2600 block of 80th Street East. Culvert is a barrier to fish passage due to slope. SW-2 Flooding 2400 block of 80th Street East Obstructed culvert at 2400 block of 80th Street E causing roadside flooding. SW-3 SW-4 Erosion, Riparian/ Aquatic Habitat Swan Creek at 72nd Street East culvert outfall Flooding Swan Creek at Pioneer Road East 72nd Street East culvert is a barrier to fish passage due to the vertical drop at outfall. High flow velocity has eroded west bank and is compromising bank stability. A house is located less than 50 feet from eroded bank. In 1996, sediment washed down Swan Creek and caused road and property flooding at the downstream commercial shop on the east side of Swan Creek. There is a storm drain system that backed up along Pioneer Way most likely due to the high water level during this 100-year storm event. Additionally, there is a culvert downstream under the BNSF railroad that may have caused backing up of Swan Creek. An existing sedimentation pond upstream of Pioneer Way has been cleaned annually since No flooding has been reported since SW-5 Flooding 84th Street East Road and property flooding occurs on 84th Street East, about 400 feet east of Waller Road East. Flooding may be due to insufficient conveyance capacity or backwater in the 84th Street East storm drain system. SW-6 SW-7 Flooding County pond at 84th Street East Flooding Intersection of 24th Avenue East and 90th Street East. County detention facility (Waller Road East Pond 2) at 84th Street East and Swan Creek overflowed during 1996 event. Flooding observed at intersection of 24th Avenue East and 90th Street East. Stormwater may also overtop roadway. SW-8 Flooding Field drainage Construction of Waller Road Pond 3 obstructed natural drainage course in pasture adjacent to Swan Creek, downstream of Pond 3. SW-9 SW-10 Flooding 2600 block of 112th Street East Excessive vegetation in roadside ditch causes roadway flooding 150-feet west of Swan Creek crossing at 112th Street East. Flooding Swan Creek headwaters south of 112th Street E Shaded rows are problems to refer to the maintenance division & small works roster Poor drainage caused by saturated soils and flat topography. Standing water observed in roadside ditches and natural drainage system. Extensive wetlands in the area, but numerous wetland and fill and grade violations reported. Pierce County Public Works & Utilities 5-4
149 IDENTIFICATION OF PROBLEMS TABLE 5-1a - continued Problem ID Type Location Description SW-11 Flooding 9500 block of Portland Avenue East Roadway runoff causes driveway and garage flooding. SW-12 Flooding 2800 block of 96th Street E Roadway runoff causes property flooding. Driveway culvert is plugged. SW-13 Flooding 9900 block of Waller Road E Backyard flooding occurs due to filling in of Swan Creek. SW-14 Flooding block of Waller Road East Roadway runoff causes property flooding. SW-15 Flooding Waller Road and SR-512 Field flooding occurs south of SR 512 on west side of Waller Road East. A berm may have formed on the over bank obstructing runoff from the adjacent field. Yard flooding on 26 th Avenue E, likely due to SR 512 culvert backwater, also occurred in SW-16 SW-17 SW-18 SW-19 SW-20 Flooding 24th Avenue East from 84th Street East to 92nd Street East Riparian/ Aquatic Habitat Water quality Water quality Riparian/ Aquatic Habitat Insufficient inlet capacity causes road and property flooding. Swan Creek at 80 th Street East Trash dumped into creek channel Swan Creek north of 80th Street E Swan Creek Waller Road East at 92 nd Street East Reach on 303d list for fecal coliform - north of 64th Street East. Reach on upper Swan Creek is on the 303d list for fecal coliform levels. Trash dumped into creek SW-21 Erosion Swan Creek at 72 nd Street East Downstream erosion SW-22 Erosion Swan Creek from 72nd Street East to 64th Street East SW-23 Erosion b, Riparian/ Aquatic Habitat Swan Creek downstream of 64th Street East SW-24 Erosion Downstream of 64th Street East SW-25 Erosion Downstream of 64th Street East SW-26 Erosion Downstream of Burlington Northern Santa Fe Railroad SW-27 SW-28 Water quality Riparian/ Aquatic Habitat Upstream of 64th Street East Swan Creek from 84th Street East to 99th Street East Shaded rows are problems to refer to the maintenance division & small works roster Channel erosion is occurring downstream of 72nd Street East to 64th Street East due to high stream flow. Exposed vertical banks are 2 to 3 feet high. High stream flows have scoured a four to five foot hole at the 64th Street East culvert outlet and undermined the culvert headwall and apron. The culvert is also a barrier to fish passage due to steep slope and drop at outfall. A 300-foot long landslide occurred on the west bank 4,500 foot downstream of 64th Street East. The channel is eroding in the 8,000 foot reach downstream of 64th Street East due to high stream flow. Exposed vertical banks are 10 to 12 foot high. Channel down cutting is occurring downstream of railroad culvert due to high stream flow. Intermittent flow occurs upstream of this location in late summer This reach has a discontinuous riparian corridor with a reduced or non-existent buffer Pierce County Public Works & Utilities 5-5
150 IDENTIFICATION OF PROBLEMS TABLE 5-1a - continued Problem ID Type Location Description SW-29 SW-30 SW-31 SW-32 SW-33 SW-34 Riparian/ Aquatic Habitat Swan Creek at Burlington Northern Santa Fe Railroad Flooding Pioneer Way East (City of Tacoma) Riparian/ Aquatic Habitat Riparian/ Aquatic Habitat Riparian/ Aquatic Habitat Riparian/ Aquatic Habitat Swan Creek at Pipeline Road (City of Tacoma) Swan Creek at 84th Street East culvert outfall Swan Creek at 96th Street East culvert outfall Swan Creek at 104th Street East culvert outfall SW-35 Habitat Downstream of Pioneer Way East SW-36 SW-37 Water Quality Water Quality Swan Creek Swan Creek Culvert is a partial fish passage blockage due to excessive velocity. Private property flooding reported at Pioneer Way East The Pipeline Road culvert is a barrier to fish passage. The culvert may be a barrier to fish passage. The culvert may be a barrier to fish passage. The culvert is a barrier to fish passage due to slope. Sediment in channel Excessive nutrients Low dissolved oxygen/ High ph a. Some locations are associated with multiple problem types. Primary problem type is listed first. b. Erosion problems are addressed primarily as Water Quality (turbidity) and Aquatic/Riparian Habitat (sedimentation) problems. The erosion issue is much broader, extending into questions of slope stability, risk of damage to private property, and public safety. TABLE 5-1b Squally Creek Flooding, Riparian/Aquatic Habitat, Erosion and Water Quality Problems Problem ID a Type Location Description SQ-1 SQ-2 SQ-3 Flooding 7000 block of Waller Road East Front yard and house flooding was reported in A low bank is present on east side of roadside ditch. Flooding West side of 5600 block Vickery Avenue East Water Squally Creek at 48 th Street quality, East Riparian/ Aquatic Habitat Roadway flooding occurs due to undersized roadside ditch and culvert system. Trash in the creek from dumping into the creek. Shaded rows are problems to refer to the maintenance division & small works roster Pierce County Public Works & Utilities 5-6
151 IDENTIFICATION OF PROBLEMS TABLE 5-1b - continued Problem ID a Type Location Description SQ-4 Erosion Clear Creek confluence Eroding banks and sedimentation occurs where Squally Creek flows into Clear Creek. SQ-5 Erosion Downstream of 48th Street East SQ-6 Water quality, Riparian/ Aquatic Habitat Pioneer Way East SQ-7 Erosion Downstream of Squally Creek Detention Pond SQ-8 Water quality Throughout stream system Small slide has occurred blocking the channel and adding a barrier to fish passage. Invasive riparian vegetation in and along the creek Squally Creek Detention Pond was designed for a 25-year storm event so does not have capacity for peak flows from larger events, incising stream channel No water quality data exists TABLE 5-1c Clear Creek Flooding, Riparian/Aquatic Habitat, Erosion and Water Quality Problems Problem ID Type Location Description CL-1 Flooding 44 th Street East near Gay Road Road and property flooding because of a low bank on the east side of the roadside ditch CL-2 CL-3 CL-4 Flooding 6600 block of 44th Avenue East Flooding Intersection of 96th Street East and 48th Ave East 4700, 4800, and 4900 block of 96th Street East, north side Flooding Clear Creek at 104th Street East Road flooding occurs due to two obstructed driveway culverts. Road flooding occurs due to obstructed culvert at intersection. Property flooding occurs due to absence of drainage system on 96th Street East. Reed canary grass is pervasive in the natural drainage channel causing chronic road and property flooding at 104th Street East. CL-5 CL-6 Flooding West Fork Clear Creek, 88th Street East to 84 th Street East Flooding East Fork Clear Creek at 76th Street East Extensive road and property flooding occurs on the West Fork of Clear Creek from 88th Street E to 84th Street East. Road flooding occurs at 88th Street E. Property flooding has been reported at the 3700 block of 88th Street East and the 8700 block of Vickery Avenue East. A wire fence has been installed at the downstream end of the culvert and may be obstructing flow. One-half foot head differential was noted during a site visit. Private property flooding has been reported downstream. This property is located in floodplain. The 1991 Stormwater Master Plan identified this culvert as having insufficient conveyance capacity. Shaded rows are problems to refer to the maintenance division & small works roster Pierce County Public Works & Utilities 5-7
152 IDENTIFICATION OF PROBLEMS TABLE 5-1c- continued Problem ID a Type Location Description CL-7 CL-8 CL-9 CL-10 Flooding 4700 block of 105th Street East Chronic property flooding reported in a depression area south of roadway. Depression drains to Clear Creek with a 36-inch diameter culvert crossing at 105th Street East. Fence posts placed in channel by downstream property owner likely causes a backwater condition at the 105th Street East culvert aggravating the flooding problem. Topography suggests that the culvert is in the historic drainage way. Flooding 4500 block of 112th Street East Property flooding caused by dumping in drainage ditch. Flooding 9300 block of 40th Avenue East Flooding 4700 block of Pioneer Way East Yard flooding Excessive vegetation in the roadside ditch on south side of Pioneer Way East between 44 th Street East and 52 nd Street East. CL-11 Flooding 4700 block of 53 rd Street East Depression on private property collects surrounding runoff 1 CL-12 Flooding 5400 block of 57 th Avenue East Driveway flooding from public road drainage CL-13 CL-14 CL-15 CL-16 CL-17 CL-18 Flooding 4000 block of 53rd Ct. Street East Riparian/ Aquatic Habitat Riparian/ Aquatic Habitat Water Quality Riparian/ Aquatic Habitat Water Quality Riparian/ Aquatic Habitat Clear Creek from 104 th Street East to Vickery Avenue East 4500 Block at Pioneer Way East Clear Creek below Pioneer Way East Clear Creek from Pioneer Way East to the Puyallup River. Pioneer Way E to Gay Road East CL-19 Erosion West Fork of Clear Creek downstream of 72nd Street East Stormwater runoff from private road causes property flooding 1 Trash in creek channel On the County s Dirty Dozen list as an illegal junk/wrecking yard, plus several occupied recreational vehicles and a large amount of solid waste cover the site Reach is on the 303d list due to fecal coliform levels. Erosion upstream has caused sedimentation in channel from Pioneer Way East to the Puyallup River Invasive aquatic vegetation present in the reach extending from Pioneer Way to Gay Road East The stream bank is eroding due to high stream flow in West Fork in vicinity of 72nd Street East. Exposed vertical banks are 12-feet-high in the reach 500 feet downstream and 5-feet high in reach 100-feet upstream of 72nd Street East. A 3-foot deep scour hole is present at culvert outlet. 1 This is a private property internal drainage issue. Shaded rows are problems to refer to the maintenance division & small works roster Pierce County Public Works & Utilities 5-8
153 IDENTIFICATION OF PROBLEMS TABLE 5-1c - continued Problem ID a Type Location Description CL-20 Erosion East Fork of Clear Creek at 72nd Street East Stream bank erosion and channel down cutting are occurring on the East Fork in the 500 foot reach downstream of 72nd Street East due to high stream flow. The culvert is perched 3 feet above the eroded channel. CL-21 Erosion Clear Creek between Pioneer Way East and 45th Street East CL-22 Erosion Downstream of 64th Street East CL-23 CL-24 CL-25 CL-26 CL-27 CL-28 CL-29 CL-30 CL-31 CL-32 Water Quality Riparian/ Aquatic Habitat Riparian/ Aquatic Habitat Riparian/ Aquatic Habitat Riparian/ Aquatic Habitat West Fork of Clear Creek at 72nd Street East Stream bank erosion and minor slides The stream bank is eroding and the channel down cutting. Intermittent flow occurs upstream of this location Pioneer Way to Gay Road East The natural channel has been straightened in this reach. The riparian buffer has been significantly reduced. 84th Street East to 99th Street East 76th Street East to 80th Street East Fish Hatchery Flooding West Fork Clear Creek at 72nd Street East Flooding East Fork Clear Creek at 72nd Street East Riparian/ Aquatic Habitat Gay Road East Flooding East Fork Clear Creek between 88th Street E and 84th Street East Riparian/ Aquatic Habitat Clear Creek at Pioneer Way East CL-33 Erosion 5000 block of Vickery Avenue East on main stem Clear Creek This reach has a discontinuous riparian corridor with reduced or non-existent buffer on the West Fork. This reach has a discontinuous riparian corridor with reduced or non-existent buffer on the East Fork. The instream dam is a barrier to fish passage. An extensive debris jam has blocked the upstream end of the culvert. The upstream end of the culvert is blocked with extensive debris jam. This culvert may be a barrier to fish passage due to high flow velocity. Extensive road and property flooding occur from 88th Street E to 84th Street East. This culvert may be a fish passage barrier. Stream bank erosion in West Fork in 100-ft reach in vicinity of 5000 block of Vickery Avenue East. Fill became saturated and resulted in mass wasting of hillside on west bank with 200-ft- landslide chute to Clear Creek. Approximately 100 ft along the west bank of Clear Creek was damaged. Shaded rows are problems to refer to the maintenance division & small works roster Pierce County Public Works & Utilities 5-9
154 IDENTIFICATION OF PROBLEMS TABLE 5-1d Canyon Creek Flooding, Riparian/Aquatic Habitat, Erosion and Water Quality Problems Problem ID Type Location Description CY-1 CY-2 CY-3 Flooding Pipeline Road, Canyon Road, 90th Street East Flooding Intersection of Canyon Road and 112th Street East Flooding West Fork of Canyon Creek at 116th Street East Canyon Creek overtops Pipeline Road, Canyon Road, and 90th Street East. Road flooding occurs at the intersection of Canyon Road and 112th Street East. West Fork of Canyon Creek overtops 116th Street East. Water-on-Road sign and evidence of roadway overtopping observed in 2/03. Downstream culverts on 112th Street East and SR-512 may cause backwater in system. Debris clogged the culvert at 112 th Street East twice. CY-4 Flooding 8600 block of Canyon Road Poor maintenance of private system causes private property flooding at 8600 block of Canyon Road. CY-5 CY-6 CY-7 CY-8 Flooding East Fork of Canyon Creek, block of 58th Avenue East and and blocks of 59th Avenue East Flooding Canyon Creek at 84 th Street East Flooding West Fork of Canyon Creek at 92 nd Street East Flooding West Fork of Canyon Creek at 104th Street East East Fork of Canyon Creek causes widespread roadway and property flooding Hydraulic analysis predicts overtopping of 84 th Street East during 100-year storm from the culvert Concern about inadequate conveyance capacity of culvert Concern about inadequate conveyance capacity of culvert CY-9 Flooding East Fork at 96th Street East Roadway flooding may occur on East Fork at 96 th Street East. CY-10 CY-11 Flooding East Fork Canyon Creek at 104th Street East Flooding East Fork Canyon Creek at 112 th Street East Roadway flooding may occur in the future. The 1991 Stormwater Master Plan identified this culvert as having insufficient conveyance capacity. Culvert may be undersized. CY-12 CY-13 CY-14 Combined with other entries CY-15 Water Quality 46th Avenue E and 58th Avenue East Septic odors present at Quiet Ridge subdivision retention pond. CY-16 CY-17 No record. Water Quality block of 58th Avenue East CY-18 Erosion Canyon Creek at 80 th Street East. May have skipped number in sequence Report of failing septic system Stream bank is eroding. Shaded rows are problems to refer to the maintenance division & small works roster Pierce County Public Works & Utilities
155 IDENTIFICATION OF PROBLEMS TABLE 5-1d continued Problem ID a Type Location Description CY-19 Erosion Tributary Channel erosion and bank sliding, location could not be found CY-20 Erosion Upstream of second Canyon Stream bank is eroding Road crossing. CY-21 Erosion Downstream of second Canyon Road crossing CY-22 Erosion Downstream of 72nd Street East CY-23 Riparian/ Clear Creek confluence to Aquatic Pioneer Way East. Habitat Water Quality CY-24 Water 72nd Street East Quality CY-25 CY-26 CY-27 CY-28 CY-29 Riparian/ Aquatic Habitat Riparian/ Aquatic Habitat Riparian/ Aquatic Habitat Riparian/ Aquatic Habitat Clear Creek confluence to Pioneer Way East Clear Creek confluence to Pioneer Way East 84th Street E to 99th Street East 4200 block of Pioneer Way E; Driveway culvert upstream of Clear Creek Confluence Flooding Canyon Creek at 72nd Street East Shaded rows are problems to refer to the maintenance division & small works roster Stream bank is eroding and channel down cutting with 10-foot-high exposed banks in 1,000-foot reach downstream of second Canyon Road crossing due to high stream flow Channel is down cutting Upstream erosion has caused sedimentation in channel from Clear Creek confluence to Pioneer Way East. Intermittent flow occurs upstream of this location. Invasive aquatic vegetation is pervasive in the channel. The natural channel has been straightened and the buffer significantly reduced. This reach has a discontinuous riparian corridor with a reduced or non-existent buffer The driveway culvert is a fish passage barrier due to steep slope The upstream end of culvert is blocked with an extensive debris jam CY-30 Flooding 5600 block of 103rd Street East Chronic flooding occurs due to backwater at 103 rd Street E. The 1991 Stormwater Master Plan identified this culvert as having insufficient conveyance capacity. CY-31 Flooding Pipeline Road East Fork Canyon Creek overtops Pipeline Road. The 1991 Stormwater Master Plan identified this culvert as having insufficient conveyance capacity. CY-32 CY-33 CY-34 CY-35 CY-36 Riparian/ Aquatic Habitat Burlington Northern Santa Fe Railroad Flooding 44th Street E between 47 th Avenue E and 50th Avenue E and in the Gay Road East vicinity The BNSF railroad culvert is a fish passage barrier due to steep slope Extensive property and road flooding has been documented in this area. This area is located in the Clear Creek floodplain and has been identified as a repetitive loss area. Flooding 4700 block of 53rd Street East Private property flooding occurs. Flooding 5400 block of 57th Avenue Road runoff is causing driveway flooding. East Flooding 4700 through 5300 block of Pioneer Way East Excessive vegetation in roadside ditch causing overtopping of Pioneer Way East. Pierce County Public Works & Utilities
156 IDENTIFICATION OF PROBLEMS TABLE 5-2a Rody Creek Flooding, Riparian/Aquatic Habitat, Erosion and Water Quality Problems Problem ID Type Location Description RY-1 Riparian/ Aquatic Habitat 72nd Street East RY-2 Flooding 6800 block of Bentley Road East RY-3 Erosion 80th Street East Stream bank is eroding. The upstream end of culvert is blocked with extensive debris jam Road runoff flows down driveway and washes around home. RY-4 Flooding 5700 block of 80th Street E Roadside ditch is flooding the driveway. RY-5 Flooding block of 62nd Avenue Roadway runoff from 62nd Avenue East causes East property flooding. RY-6 Flooding nd Avenue East Roadside ditch overtops. RY-7 Flooding 96th Street E at Pipeline Road Rody Creek overtops 96th St. East. The 1991 Stormwater Master Plan identified this culvert as having insufficient conveyance capacity. RY-8 Flooding 98th Street East Road and property flooding of Rody Creek at 98th Street East. According to property owner, th Street East, flooding occurs annually due to clogging of the inlet by debris. Water backs up causing property and septic tank flooding. Flooding also reported upstream at block of 98th St East and block of 61 st Ave East (possible reduction with recent maintenance project) Plan identified this culvert as insufficient conveyance capacity. RY-9 Flooding Pioneer Way East Roadway flooding may occur at Pioneer Way East; culvert may be a fish passage barrier RY-10 Flooding 90th Street East Roadway flooding may occur at 90 th St East RY-11 Flooding 104 th Street East Fear of roadway overtopping RY-12 Flooding Rody Creek at 112 th Street East Possible roadway overtopping RY-13 Flooding Creek at 128 th Street East Possible roadway overtopping RY-14 Erosion 72nd Street East Channel down cutting occurring in 100-ft reach downstream of 72 nd St East. Culvert is a barrier to fish passage due to excessive outfall drop (3 ft) RY-15 Water quality 84th Street East Intermittent flow occurs upstream of this point RY-16 RY-17 RY-18 Riparian/ Aquatic Habitat Riparian/ Aquatic Habitat Riparian/ Aquatic Habitat Clarks Creek to Pioneer Way East 86th Street E to 99th Street East Upstream of Pioneer Way East The natural channel has been straightened channel with the buffer reduced. Invasive riparian vegetation also is present This reach has a discontinuous riparian corridor with a reduced or non-existent buffer The instream weir is a barrier to fish passage Shaded rows are problems to refer to the maintenance division & small works roster Pierce County Public Works & Utilities
157 IDENTIFICATION OF PROBLEMS TABLE 5-2b Diru Creek Flooding, Riparian/Aquatic Habitat, Erosion and Water Quality Problems Problem ID Type Location Description DU-1 Flooding Cross culvert on 66th Avenue East DU-2 Flooding 9700 block of 66th Avenue East DU-3 Flooding 9800 block of 67th Avenue Ct. East DU-4 Flooding block of 67th Avenue East DU-5 Flooding 9900 block of 63rd Avenue Ct. East Private driveway floods on 66th Avenue East Roadside ditch and culvert system has limited capacity of which causes road flooding. Stormwater inundation occurs in roadway depression. Road flooding occurs due to blocked culvert inlet. Driveway and garage flood. DU-6 Flooding Creek at 90 th Street East Possible roadway overtopping DU-7 Flooding 96th Street East Roadway flooding may occur at 96th Street East. The 1991 Stormwater Master Plan identified this culvert as having insufficient conveyance capacity. DU-8 Flooding 104th Street East Roadway flooding may occur at 104th Street East. The 1991 Stormwater Master Plan identified this culvert as having insufficient conveyance capacity. CU-9 Flooding Whole stream Water quality DU-10 Riparian/ Aquatic Habitat Clarks Creek confluence to Pioneer Way East DU-11 Erosion Downstream of 72nd Street East DU-12 DU-13 Water Quality Riparian/ Aquatic Habitat 84th Street East Clarks Creek confluence to Pioneer Way East DU-14 Flooding 6600 block of Pioneer Way East Invasive riparian vegetation is present in the 2,200- foot reach from Clarks Creek confluence to Pioneer Way East. Stream bank is eroding in the 100 foot-long reach downstream of 72nd Street East. Exposed vertical banks are 8-feet-high. Intermittent flow occurs upstream of this location The natural channel has been straightened and the buffer reduced in 2,200-foot reach from Clarks Creek confluence to Pioneer Way East Flooding occurs due to backwater at private driveway culvert on Diru Creek near confluence with Clarks Creek Shaded rows are problems to refer to the maintenance division & small works roster Pierce County Public Works & Utilities
158 IDENTIFICATION OF PROBLEMS TABLE 5-2c Woodland Creek Flooding, Riparian/Aquatic Habitat, Erosion and Water Quality Problems Problem ID Type Location Description WO-1 Erosion Woodland Creek at 84 th Street East WO-2 Flooding Woodland Avenue E south of 102nd Street E WO-3 Flooding East side of Woodland Avenue at 119th Street E WO-4 Flooding 6900 block of 113th Street Ct. East Bank erosion, channel down cutting downstream of 80th Street East due to high stream flow. Three foot deep channel incision. Reduced riparian buffer The area south of 102nd Street East is a closed depression with a restrictive outlet pipe. Frequent and extensive flooding occurs in this area. There were also numerous reports of property flooding in this area during the 1997 flood event. Road and property flooding occur due to plugged driveway culvert. Grate inlet is blocked. WO-5 Flooding 102nd Street East Roadway flooding may occur at 102nd Street E. WO-6 Flooding 72nd Avenue E from 93rd Street East to 96th Street East WO-7 Flooding 84 th Street East & Woodland Creek Woodland Creek overtops 93rd Street East, 94th Street East and driveway culverts on 72 nd Avenue East. Concern that the creek with overtop 84 th Street East WO-8 Flooding 80th Street East Woodland Creek overtops 80th Street East. The 1991 Stormwater Master Plan identified this culvert as having insufficient conveyance capacity. This culvert is also a barrier to fish passage due to excessive outfall drop. WO-9 Flooding 6800 block of 128th Street East Raised roadway is causing private property flooding. County investigated problem in 1993 and determined it was related to an improved road that was constructed the previous year. WO-10 Flooding block of Woodland Avenue East WO-11 Flooding 9100 block of Woodland Avenue East WO-12 Flooding 9100 block of Woodland Avenue East Road flooding occurs due to blocked culvert. Property flooding occurs at 9100 block of Woodland Avenue East. Property flooding occurs at 9100 block of Woodland Avenue East. WO-13 Flooding 6800 block of 90th Street East Road and driveway flooding occur on 6800 block of 90th Street East. WO-14 Flooding Intersection of Woodland Avenue East and 84th Street East Minor depression is causing stormwater ponding at southeast corner of intersection due to no outlet. WO-15 Flooding 6900 block of 81st Ct. East Stormwater runoff from private road causes flooding at 6900 block of 81st Ct. East. WO-16 Flooding 8700 block of 72nd Avenue East Low, seasonal storm flow is washing out driveway. Shaded rows are problems to refer to the maintenance division & small works roster Pierce County Public Works & Utilities
159 IDENTIFICATION OF PROBLEMS TABLE 5-2c continued Problem ID Type Location Description WO-17 Flooding Woodland Creek at 96th Street East WO-18 Flooding Intersection of 96th Street East and 74th Avenue East Blocked culvert is causing road flooding. Runoff sheet flows from asphalt ditch on west side of 74 th Avenue East and floods intersection. WO-19 Flooding 7200 block of 102nd Street East Catch basin inlet is full of gravel and causing road flooding. WO-20 Flooding block of 74th Avenue East WO-21 Flooding Woodland Avenue from 80th Street East to 76th Street East WO-22 WO-23 Riparian/ Aquatic Habitat Riparian/ Aquatic Habitat 84th Street East Upstream of Pioneer Way East Stormwater runoff from roadway and adjacent property runoff causes private property flooding. According to residents, new development on Woodland Avenue between 80 th Street East to 76th Street East altered drainage patterns, which have resulted in flooding. Stormwater runoff was diverted to east side of road when road was expanded. There is an instream barrier to fish passage due to 12-foot high cascade in channel. Invasive riparian vegetation is present in this reach. WO-24 Erosion 84th Street East Scour is occurring at culvert outlet. WO-25 Erosion Downstream of 84th Street East Channel is down cutting downstream of 84th Street East due to high stream flow. Channel incision is 5- feet-deep. WO-26 WO-27 WO-28 WO-29 WO-30 WO-31 Riparian/ Aquatic Habitat Erosion, Riparian/ Aquatic Habitat Water quality Riparian/ Aquatic Habitat Riparian/ Aquatic Habitat Water Quality Upstream of 80th Street East Downstream of 80th Street East. 84th Street East Clarks Creek confluence to Pioneer Way East WSU Experimental Farm Upstream erosion has caused sedimentation in channel. Stream bank erosion and channel down cutting downstream of 80th Street East due to high stream flow. Three foot deep channel incision. Reduced riparian buffer. Intermittent flow occurs upstream of this location. The natural channel has been straightened and the buffer reduced. The culvert is a barrier to fish passage due to velocity. At & near the mouth Contributing fecal matter to Clarks Creek, 63% from birds and mammals Shaded rows are problems to refer to the maintenance division & small works roster Pierce County Public Works & Utilities
160 IDENTIFICATION OF PROBLEMS TABLE 5-2d Clarks Creek Flooding, Riparian/Aquatic Habitat, Erosion and Water Quality Problems Problem ID Type Location Description CK-1 Riparian/ Aquatic Habitat Tacoma Road, Stewart Avenue, 66 th Avenue East Invasive aquatic vegetation in channel has caused Clarks Creek to overflow its banks and flood surrounding property CK-2 Flooding 9200 block of 104th Street East Structure on property floods because it is located at the same elevation as the creek. Development in the area may have increased the creek water surface elevation. CK-3 Water Quality Meeker Ditch CK-4 Flooding 1000 block of 16th Street SW (Meeker Ditch), 12th Avenue SW, and 2210 Pioneer Way. (City of Puyallup) CK-5 Riparian/ Aquatic Habitat Clarks Creek north of 15th Avenue SW. (City of Puyallup) This reach is on the 303d list due to fecal coliform, temperature, dissolved oxygen and ph levels Flooding occurs in the 1000 block of 16th Street SW (Meeker Ditch), 12th Avenue SW, and 2200 block of Pioneer Way East. Poor riparian and aquatic habitat and water quality occur in Clarks Creek north of 15th Avenue SW. CK-6 Flooding 8400 block of 96th Street East Roadside ditch in 8400 block of 96th Street East overtopping during rainfall events. CK-7 Flooding block of 82nd Avenue NW CK-8 Flooding 7400 block of Stewart Avenue and 6300 block of 76th Avenue East. (City of Puyallup) Flooding occurs in block of 82nd Avenue NW. Flooding occurs in 7400 block of Stewart Avenue and 6300 block of 76th Avenue East. CK-9 Flooding 7800 block of 112th Street East Road and property flooding occur due to undersized storm drain system under Woodland Elementary School. CK-10 Flooding Fruitland Avenue between 104th Street E to 96th Street East. CK-11 CK-12 CK-13 CK-14 Water Quality Water Quality Riparian/ Aquatic Habitat Riparian/ Aquatic Habitat Water Quality Tacoma Road Clarks Creek Puyallup River confluence to Puyallup City Limits Puyallup River confluence to Puyallup City Limits Ditch and culvert system is undersized and is a chronic maintenance problem. Septic systems area failing. This reach on 303d list due to fecal coliform levels and ph levels. Invasive aquatic vegetation in channel Upstream erosion has caused sedimentation in channel. CK-15 Erosion Creel at 99th Street East Stream banks are eroding. Shaded rows are problems to refer to the maintenance division & small works roster Pierce County Public Works & Utilities
161 IDENTIFICATION OF PROBLEMS TABLE 5-2d continued Problem ID Type Location Description CK-16 CK-17 CK-18 CK-19 CK-20 CK-21 Riparian/ Aquatic Habitat Riparian/ Aquatic Habitat Riparian/ Aquatic Habitat Riparian/ Aquatic Habitat Riparian/ Aquatic Habitat Water Quality Clarks Creek confluence with Puyallup River to Puyallup City Limits Meeker Creek - 11th Street SW (City of Puyallup) Roadside ditch tributary to Meeker Ditch - 11th Street SW (City of Puyallup) Unnamed Tributary to Meeker Ditch - 12th Avenue SW (City of Puyallup) Clarks Creek - Fish Hatchery (State of Washington) Clarks Creek The channel is disconnected from floodplain with reduced buffer from confluence with Puyallup River to Puyallup City Limits. The culvert is a possible barrier to fish passage. The culvert is a barrier to fish passage due to steep slope. The culvert is a possible barrier to fish passage. The hatchery dam is a barrier to fish passage. Excessive nutrients. Connected to CK-13, invasive vegetation and CK-12, ph standard exceeded. TABLE 5-3 Potholes Flooding, Aquatic Habitat, and Water Quality Problems Problem ID a Type Location Description PH-1 Flooding block of 128th Street E Dry wells overflowing causing road flooding. PH-2 Flooding Flooding from Meadow Park Pond overflow - Resolved with pond expansion. PH-3 Flooding Drainage dispute between adjacent property owners that has been Flooding from Meadow Park Pond overflow - Resolved with pond expansion. Field flooding at the Meridian (Meridian Greens Golf Course). resolved PH-4 Flooding Same as PH-3 Field flooding at the Meridian (Meridian Greens Golf Course). PH-5 Flooding 89th Avenue Ct. E Black Swamp pothole is flooding surrounding properties and surcharging storm drain system on 89th Avenue Ct. E. PH-6 Flooding block of 92nd Avenue E Drainage swale overtops 92nd Avenue E and causes road and property flooding. Backwater through existing 24-inch diameter stormdrain causes overtopping of inlet structures. One inlet structure is located off the street and in the front yard of the property in the block of 92nd Avenue E. PH-7 Flooding Road and property flooding at block of 149th Street E Road and property flooding at 149th Street E PH-8 Flooding Road and property flooding at Road and property flooding at 145th Street E 145th Street E and 144th Street E. - and 144th Street E Resolved through maintenance Shaded rows are problems to refer to the maintenance division & small works roster Pierce County Public Works & Utilities
162 IDENTIFICATION OF PROBLEMS TABLE 5-3 continued Problem ID a Type Location Description PH-9 Flooding block of 127th Street E Road flooding at block of 127th Street E PH-10 Flooding Stormwater runoff from private road causes flooding on private property at block of 82nd Avenue Ct. E PH-11 Flooding Restaurant parking lot built in swale is causing private property flooding. PH-12 Flooding block of 112th Avenue E and block of 136th Street E Stormwater runoff from private road causes flooding on private property at block of 82nd Avenue Ct. E Restaurant parking lot built in swale is causing private property flooding. Roadway runoff is causing property flooding. PH-13 Flooding Property flooding in a closed Property flooding in a closed depression depression - Resolved with County project. PH-14 Flooding 9600 block of 148th Street Ct. E Road flooding at 9600 block of 148th Street PH-15 Flooding 150th Street E; 9700 block of 156th Street E; block of 97th Street E Ct. E Roadway and properties are in a closed depression. PH-16 Flooding 99th Avenue East Road flooding reported at 99th Avenue E PH-17 Flooding Cascade Park and Firgrove Roadway and property flooding reported in subdivision subdivision due to obstructed roadside ditch PH-18 Flooding 98th Avenue Ct. E. and 152nd Street E (Willow Tree Subdivision) and culvert system. Infiltration facility overflow to roads and surrounding property during periods of high groundwater. PH-19 Flooding 9600 block 159th Street Ct. E Runoff from commercial development to the west is causing roadway flooding at 9600 block of 159th Street Ct. E. PH-20 Flooding block of 83rd Avenue E Private detention pond overflowing at block of 83rd Avenue E PH-21 Flooding block of 103rd Avenue Ct. E Dry well is under capacity. PH-22 Flooding 141st Street Ct. and 144th Street E Road and property flooding at 141th Street Ct. and 144th Street E PH-23 Flooding South Hill Pump Station at Hemlock Pond Permission to use current pump station discharge outlet is temporary TABLE 5-4 Roosevelt Ditch Flooding, Riparian/Aquatic Habitat, Erosion and Water Quality Problems Problem ID Type Location Description RD-1 Flooding 7700 and 7800 block of Golden Givens Road East RD-2 Flooding Coventry Court Apartment on 10th Avenue Ct E Stormwater inundates the road shoulder and adjacent driveway Shaded rows are problems to refer to the maintenance division & small works roster Detention pond may be undersized or has a clogged outlet. Pond has been reported to overflow into the apartment yards. Pierce County Public Works & Utilities
163 IDENTIFICATION OF PROBLEMS TABLE 5-4 continued Problem ID a Problem ID a Problem ID a Problem ID a RD-3 Flooding 900 block of 75th Street East Apartment storm drain system needs maintenance RD-4 Flooding 9th Avenue E and 75th Street East RD-5 Flooding 7200 block of 12th Avenue East RD-6 Flooding 12th Avenue E, just south of 80th Street East RD-7 Flooding 7600 block of Portland Avenue East RD-8 Flooding Roosevelt Ditch at 85 th Street East RD-9 Flooding Roosevelt Ditch at 80 th Street East RD-10 Flooding 2100 block of 72nd Street East RD-11 Flooding 7300 block of 20th Avenue East RD-12 Flooding 2200 block of 80th Street East RD-13 Flooding 1600 block of 85th Street East RD-14 Flooding 8700 and 8800 block of Portland Avenue East RD-15 Flooding 8700 block of 18th Avenue East RD-16 Flooding 2100 block of 91st Street East Storm drain system is undersized and causes property flooding. Road and property flooding due to absence of drainage system. A roadside ditch to the north of the house flows south towards the house but has no outlet. Road flooding occurs due to obstructed roadway ditch and culvert system. Storm drain system overtops Portland Avenue East and causes roadway and property flooding in 7600 block. Possible roadway overtopping during severe storms Possible roadway overtopping during severe storms Road flooding occurs due to insufficient grate inlet capacity in sag. The natural drainage channel receiving stormwater drainage from private property and the roadway has been filled in downstream of the road. This channel is on private property. Fill has also been placed in the roadside ditch near the 7400 block of 20th Ave East. The roadside ditch has an adverse slope causing road and property flooding Diverted stormwater causes overtopping of ditch and culvert system at 85th Street East and roadway and property flooding Roadway flooding occurs due to depressions in the road. Ditch and culvert system overtop 18 th Avenue East causing road and property flooding. Roadway runoff is causing property flooding. RD-17 Flooding 90th Street East Roadway flooding may occur at 90th Street East. Shaded rows are problems to refer to the maintenance division & small works roster Pierce County Public Works & Utilities
164 à w w w w w w w w w w w w w w w w w w w w w w w w w w w w w w w w v u ý þ þ ý ý ÿ xz xzy { xzy ~ xz Ž xz} xz xz { x ~ s t u u ƒ x ƒ xz ƒ x ˆ ƒ xzy} xz} xzž xz xzy x xz{ xz~ x xz x x y w xzˆ x x Ž x } x x x { xzy xzy x { xz xzy } xzy Ž xz y xzˆ xzy ˆ f#ghij h)k `#akbc\d xzy b)e xzy y xz xz~ xz x ˆ xz x xz{ xz } x y x Ž w ŠOx V#WKXZY\[^]O_ x P#QRST R)U xzž H#IKJLM JON!#"$&%' $)( *,+-./ x } w ŠOxz{ w ŠOxz} w ŠOxz{ w ŠOxzŽ 78 9: 2 w ŠOxzy ƒ xz ƒ xzž ƒ xz ƒ xzyž ƒ xzy ƒ xzy ƒ x ƒ xzyy ƒ x ~ š ƒ xz~ œ ž Ÿ?@ => ;;< ƒ xzy ŒZxzyˆ ƒ x { ƒ xzy ƒ xzy ƒ xzy~ ƒ xz{ ƒ xz} ŒZxz ŒZxz{ ŒZxzy ŒZxzyŽ ŒZxzy{ ŒZxz} ŒZxzŽ ŒZx Ž ƒ xzy{ ŒZxzy CDEF G AB ŒZxzy ŒZxzyy ŒZx ˆ ŒZxz{ ŒZxzˆ l#mknzo\p^qor ŒZxzy ŒZxzy} ŒZxzy~ ŒZxz} ŒZxzy ŒZx ŒZxz ƒ xz ŒZxz ŒZxz~ ƒ xz & ª «& ª ŒZxzy ŒZxz ŒZx ŒZx ±³²z µ ŒZxz ¹ ºƒ» ¼ Ä Æ Â Ã Â Ä Ä Å À Ç È É À Ê Á ¼KÀ Á Ç Á ÆOÀ½ ÁZ½ËÉ Á ½ ¼ Ì Á  À½,Í É ½ ¼ Á À½KÀ à Á À  ¼ Ä Á Å ¼¾½ ¼KÀ Á  Ã! #"$ % & ' &( ' *),+ -#*.0/# &12435 ù ú û³ü³ü³ü^ü ò#óó#ó ó ò#óó#ó ô#óó#óöõ # ø Î ÖÚÔÕ ¾ÖáÎÛ ÎÏ,Ð ÑKÒ ÓÔÎ Û Õ¾Ö Û¾ë¾ÖÚ ÕÔ,ÖáìÐíÔîÓÔÕ,Ö Ø ÎÙÐ Ú¾ÖÛ¾ÚÔÜ&Ý Þ Ôß àôáâôã Ú ÕÔáÙ ß Î ïó¾öû¾ðèôñ ñôç Ó í ä åôæôç èôä Îé êï Î Ó Õ¾Ö Î ŒZx ŒZxzŽ ý þ þ þ ý þ ý ýþ ý ý þ
165 '& ( f BCD IJ ƒ QP O N LMN K ô ó í ì í ì í ï í ñìï ò ñ í ð ï ì ì ì í î vxw kyo vxw kyq vxw ky vxw kyopm vxw kyo vxw kyots hjilknopu hjilknots hjilknopr hjilknm vxw kyopr hjilknopq zj{ knots hjilkno zj{ knopu zj{ knopo zj{ knop ˆ nšp }~ knqp }~ knup hjilknopo hjilknopq \^] _`ba a/cd/e vxw k s vxw kyu vxw kyop }~ knqpo }~ knqp ˆ n }~ knop ˆ nšp ˆ nšpœ zj{ kno }~ knots ˆ nšt ˆ nšpš ˆ nž zj{ knopq }~ knqpm hjilkn hjilknu hjilk s hjilknopm hjilknop hjilknop R S TVUWYX/Z1[/Z : ;<=> <? vxw kyop vxw kyop vxw ky vxw kym vxw kyopo vxw kyopq zj{ knr zj{ kn zj{ knq zj{ kn zj{ k s zj{ knm }~ k s }~ knopu }~ knopq }~ knopo zj{ knu }~ knq }~ knopm }~ knop }~ knop }~ kn }~ knop }~ knopr }~ knr F HG EF hjilknop hjilkn hjilknqp hjilknr hjilkn hjilknop hjilknq ) * +,-/.10 vxw ky }~ knqp vxw kyr $% #" vxw kyopu }~ kn }~ knu š œžš Ÿ ˆ žª «ª / ˆ ž / ± ²/ ˆ / / ³ µ± ^ t ˆ / «/«/ žª «ˆ žª ^± ž ª / ˆ õµöø øù úøû ü³ýyúpþ úøývÿ ³þ û j øÿ úøý ø øû ÿ ý øý ø øù ÿ øÿ øýøùøû ú xü ü úøúx ùøû ú èpé êlëlëlë ë àâáýáâá á àâáýáâá ãâáýáâáåä æâæ ç ¹ ¹ º» ¼ ½y¾ ¹ À Á  à ¹ ÄÅ» Æ ÁÇ Æ ÈÉËÊt ÌyÍ Î Ï ÐtÆyÀ Î ÄtÌy¹ ÑyÒ Ó ÔyÕ Ñy¹Öp º ¹ ¾yÀ Á ¹ Á Æ Ày Á Î ¹Ç Ç Ç Ø Á ÆyÀ  Á Î Ù» Ú Û ¾ À Á Üݾ ÁÇ ÞÝÕ ßyß Ô ¾yÚ ï í í ì ñì ñ ð
166 žÿ k o l } n } } } k o y ö ô ò ð ï ð ï ð ò ð ôïò õ ô ð ó ò ï ï ï ð ñ ˆ ŠŒ kto o m n kpo Ž Eš rœ ˆŽ Œ "! k l m m n kpo ˆ o q n o kto m n kpo ˆ ˆ Š siƒp n lvn m n kpo ˆŽ ˆŽ m*q n m n kpo ˆŽ [\]^E_` ˆŽ ^a sizp{ n ˆ ˆ LMMNOP NQ o q q lrn m n kpo ˆ Š lvn m n kpo RTSUVEWIX VZY ˆ ŠŠ ABCEDGFIH(JK bc cedgfigihzj sts(u n lvn m n kpo ˆŽ Š ˆŽ ˆ Š m n kpo #$&%('*),+.-,/ m n kpo ˆ ˆ niq m n m m n kpo ˆ k o siwpw n lrn m n kpo ˆŽ ˆŽ ˆŽ ˆŽ sts(x n m n kpo o n k m n >? <= :; ; mrmro siwpw n lrn m n kpo l~m q q ork m n kpo t p r ª ±v³ ± ±v² µt vªe ³ «¹«º vª «ª «e ªT«ªe ¼v «½ ª ± v² øºù(ú(ûü(ý þ ÿ ü ü(ÿ Äý ú ü(ÿ (ú(ý ú ÿ ú(ÿ ú (ú(û ú (ÿ (û(ý ü þ þeü(ü úû(ý ü!" êeë ìîíîíîí,í ã&ää&ä ä ã&ää&ä å&ää&äçæè&è é ¾ ¾ À Áe Ãľ ÅTÆ Ç È ¾ ÉÊÀ ËTÆÌTËÄÍiÎŽÏ»ÇÄÐ ÑÄÒ ÓÄÔ»Ë ÅÄÒ É»Ð ¾ Õ ÖÄ ÄØ ÙÄÕ ¾ÚEÛ ¾ à ÅTÆ ¾ Æ ËÄÅ ÇTÆ Ò ¾Ì Ì ÌTÜTÆ Ë ÅÄÇ Æ Ò Ý À ÞÄß ÃÄÅ Æ àãtæìtáùäâ âäøpã Þ ð ï ôï ô ó
167 STORMWATER DRAINAGE & FLOODING CHAPTER SIX Stormwater Drainage and Flooding Analysis Chapter Six presents an overview of existing and potential future drainage and flooding problems in the Clear/Clarks Creek Basin. The drainage problems identified in Chapter Five were analyzed to determine the extent and frequency of flooding at each location. This chapter describes existing problem areas within each subbasin. It forecasts future flooding problems that are likely to result from land development set out in the Comprehensive Plan. The chapter also presents potential solutions to these problems, including capital improvement projects (CIPs), maintenance activities, and programmatic measures. The end of this chapter lists specific projects to address existing and forecast drainage problems. Chapter Nine factors the solutions laid out in this chapter into the Basin Plan recommendations. 6.1 Flow Modeling and Analysis This section summarizes the models and analytical methods used to evaluate the drainage and flooding problems within the Clear/Clarks Basin. Pipe systems, inlets, catch basins, stream channels, roadside ditches, and culverts were subjected to drainage and flooding analysis. Section discusses the methods used to estimate flows within the major drainages. Section discusses the hydraulic methods used to analyze problems resulting from stream flows. More detailed information on modeling methods and assumptions of these analyses can be found in Appendix G Stream Flow Hydrologic modeling was performed to determine the long-term flood-frequency, flow duration, and runoff characteristics for the Clear/Clarks Creek watersheds. Hydrologic modeling simulates the volume of stormwater given various topographic, rainfall, soil, and land use conditions. The results of the hydrologic analysis are used as input to the hydraulic analyses presented in Section These results are also used to qualitatively assess hydrologic impacts to the water quality and habitat conditions presented in Chapter Seven and Chapter Eight. The Hydrologic Simulation Program Fortran (HSPF) model (USGS, 1997) was used to develop peak flow rates and flow duration for the creeks and major conveyances in the basin. The HSPF model used in this analysis was originally developed by the United States Geological Survey (USGS) in the early-1990 s to support earlier basin planning efforts (USGS, 1994) and included the entire Clear Creek Basin and the Rody and Diru Creek subbasins in the Clarks Creek Basin. This model was recently refined by Northwest Hydraulic Consultants (NHC) to support a Federal Emergency Management Agency (FEMA) restudy of the Clear Creek floodplain (NHC, 2003). NHC revised the USGS model to provide a refined subbasin delineation and also updated the land-use information for current and future conditions. The HSPF model developed by NHC was extended to include the entire Clarks Creek Basin. As part of the effort, additional subbasins were delineated, new flow routing tables (FTABLES) Pierce County Public Works & Utilities 6-1
168 STORMWATER DRAINAGE & FLOODING were created, and existing and future conditions land use parameters were developed. Generally all subbasins were delineated using 2-ft contour mapping and the 2001 drainage inventory provided by Pierce County. Figure 6-1 shows the HSPF Reaches and subbasins used for the hydrologic analysis. Development of the HSPF model is documented in Appendix F. Frequency Analysis The long-term flood frequency analysis used the synthetic extended 158-year precipitation timeseries developed for Pierce County (MGS Engineering, 2001). The time series was created by combining applicable high-quality one-hour records from rainfall measuring stations located in Western Washington, Oregon, and British Columbia. Performing a 158-year continuous simulation is useful because it allows for interpolation (rather than extrapolation) of the extreme storm events of interest (e.g., 50- to 100-year). Peak flood frequency is the probability that a given peak flood event will occur in any year. Flood frequency is expressed as a return period (the inverse of the probability) and represents the average interval between the occurrences of a specific magnitude flood. For example, a peak flood with a 50% probability of occurring in any given year is equivalent to a 2-year return period (1/0.5 = 2). Data on the frequency of floods is used to evaluate the hydraulic performance of structures and to estimate the average interval of flooding. Peak flood frequency is used primarily as input to hydraulic models to estimate the flooding potential at roadway cross culverts. Typically, peak flood values computed from the frequency analysis are also used as input into hydraulic models to compute a corresponding peak stage frequency, i.e., the frequency that the elevation of the water surface of a stream will exceed a certain depth (or elevation). Stage frequency can be estimated directly from HSPF data for areas with widespread and extended inundation. Table 6-1 shows the results of the peak flood frequency and peak stage frequency analysis for existing and future land use conditions. Peak flood frequency was computed at 41 locations in the Watershed using the standard Log Pearson Type III distribution (USGS, 1982). Peak stage frequency was also computed for the Woodland Creek reach in the vicinity of 112th Street East. HSPF model output locations (reach discharge points) are shown on Figure 6-1. Additional information on the frequency analysis is provided in Appendix F. The HSPF analysis predicted that peak flows will increase for all return periods and all subbasins throughout the Clear and Clarks Creek Basins under future land use. Table 6-1 shows that highest peak flows are predicted to occur in the subbasins with the largest tributary areas: Swan Creek, Clear Creek, Canyon Creek, and the mainstem of Clarks Creek. Pierce County Public Works & Utilities 6-2
169 æ _ y { z x } ~ ü œ žÿ ¾ À ÁÂÀ ÃÄ Å OPQ RS TU ;< => ÐÑ Ò» ab _` ^ \] qrs tu vw Ž ¹º ON M ON LM S ý ÿ z) ÆÇÉÈ ÈËÊÌ Ç Æ Ê xzy { g kf ci jgh gh fe cd lmonp qsr t>uwv \L] ^ _a` ^ b c ` d efjglhi g*j ô!õ öøõúùû çéèêû ë ì[í@ôs Wîsï#ðƒÖÚWîsïs GÒ ñsôòë>äùö âó Úó ݃ÖÓoÖ ÔWÚ ÝƒØ Ôs GÒ ÞÕÝƒØ GÒ ßWÚ#Û àsásás WÚÙÖ â#ã>äsàsâsås GÒ Ö ÔWÚ Û%Ó4Ò Ôs GÜƒÚ Ñ'ÒÓÕÔGÒ Ö ÙØÚ n p o no klm m & š?@"a$b&ced*f GHJILKM I*N Ž $ L * [ YZ VWX V áâ àß Þß ÜÝ ÚÛ "!$#&%('*) þ¹ÿ ý üû ± ²$³L µ ³* * *+,.-#/,0! #"$ #% &(' z'x Ž x% x%y Ž x)x x%z s 6ˆ x x%}x x ~ T U UWV%XY V[Z x%{ x%} x%wy x% x%x G w w w s % s s % s ªs % s «! s ²±³. µ ¹ º²±» ¼» ½!¾ À Á ÂÃoÄ» ºoÀ Å Æ Ç È É Å Ê6Ë µ»  ¼ ¼ ¼ Ì Â ³Éo͵ λ É Ï Ï Èµ Ð y) 89: y'x x% 0 /. -,+ + z)y y){ ÍÎÏ Í y)z z)z y)y {)z z){ {'x {)y {) ÓÔÕaÖ Ø Ö Ù ½ ¼» š z ~ z) z z)ƒ x z)} ž ž œ œ6 [Š Œ ŽŽ ½»¼ ˆ Š Œ Š 8:9; <>=@??AB%C PQ PR òóaôõö øúù N SRŸ PQ PR z)ƒ y ãäåjælçè æ*é êëì"í$î&ïzð ñ DEGFIH J F%K! #"%$'&)( }~ ƒ ª«& * ý þ
170 STORMWATER DRAINAGE & FLOODING HSPF Reach a Swan Creek Location TABLE 6-1 Existing and Future Flood Frequency 2-Year Peak Flow 25-Year Peak Flow 100-Year Peak Flow (cfs) (cfs) (cfs) Existing Future %Diff Existing Future % Diff. Existing Future % Diff. 1 Pioneer Way East th Street East (Extended) 3 72nd Street East th Street East th Street East Squally Creek 30 Pioneer Way East nd Street East Clear Creek 6 Pioneer Way East th Street East (Extended) 10 East Fork at 64th Street East 11 East Fork at 72nd Street East 12 Upper East Fork Clear at 96 th Street East 13 East Fork Clear at 96th Street East 8 West Fork at 64th Street East 9 West Fork at 84th Street East Canyon Creek Pioneer Way East th Street East th Street East East Fork at 90th Street East 18 East Fork at Pipeline Road 17 West Fork at Canyon Road and 90th Street East 15 West Trib. at Canyon Road East Pierce County Public Works & Utilities 6-5
171 STORMWATER DRAINAGE & FLOODING HSPF Reach a Rody Creek Location TABLE 6-1 Existing and Future Flood Frequency 2-Year Peak Flow 25-Year Peak Flow 100-Year Peak Flow (cfs) (cfs) (cfs) Existing Future %Diff Existing Future % Diff. Existing Future % Diff. 19 Pioneer Way East th Street East th Street East Diru Creek 22 Pioneer Way East th Street East th Street East Woodland Creek 40 Pioneer Way East th Street East th Street East SR S b Stage at 112th Street East (feet) Clarks Creek Outfall to Puyallup River 33 Stewart Avenue East USGS Gage th Avenue SW th Street SW (Extended) 37 96th Street East c Meeker Ditch c Diversion to Highway Basin 39 Pioneer Way Storm drain Outfall a See Figure 6-1 for HSPF Reach locations b HSPF Reach 43S values (including Difference) are shown in units of feet. c HSPF Reach 38-1 is the primary discharge point from the subbasin. HSPF reach 38-2 represents the secondary diversion out of the Clear/Clarks Creek Basin Pierce County Public Works & Utilities 6-6
172 STORMWATER DRAINAGE & FLOODING The highest peak flows were predicted for Swan Creek under both existing and future land use conditions. The Swan Creek Subbasin is the second largest subbasin (behind Clarks Creek) and is one of the more developed subbasins with a relatively high (20%) effective impervious area (EIA). Swan Creek, Woodland Creek, and mainstem Clarks Creek (above 15th Avenue SW) have the highest increase in peak flows under future land use conditions. A small increase in future peak flows will occur in the lower Canyon Creek Subbasin at Pioneer Way. However, peak flow rates in the upper Basin are predicted to be significantly higher. Overall, the Clear Creek Subbasin will likely experience only a slight increase in peak flows under future conditions because only a slight increase in EIA is expected under future land use conditions. At over 3,000 acres, the subbasin associated with the main stem of Clarks Creek (upstream of 7th Avenue West) is the largest subbasin in the system. However, it generates peak flows on a magnitude similar to much smaller and less developed subbasins. Table 6-1 shows that the 25- year peak flow for the existing land use condition for Clarks Creek at 7th Avenue West (HSPF Reach 35) is about 180 cubic feet per second (cfs). This compares with the 25-year peak flow in Clear Creek, which is a much smaller (2,000 acres) and less developed basin. The reasons for this are twofold. First, a significant amount of highly permeable outwash soil exists in this part of the Clarks Creek Subbasin. A large portion of the rainfall infiltrates outwash soils and enters the stream system as groundwater inflow rather than as runoff from the land surface. Secondly, a storm drain diversion exists near 15th Avenue SW and Meridian Avenue South in the City of Puyallup (near SR-512), which transfers a large amount of stormwater out of the Clarks Creek system to the Mid-Puyallup River Basin. Generally, flow at a point in a watercourse is proportional to the upstream area tributary to that point. However, the HSPF model results suggest that this is not always the case in Canyon, Rody, and Woodland Creeks. Using Canyon Creek as an example, Table 6-1 shows that the 25- year peak flow for the existing land use condition at 90th Street East (HSPF Reach 182) is approximately seven (7) cfs higher than the 25-year peak flow at 77th Street East (HSPF Reach 16). In the Canyon, Rody, and Woodland Creek systems, the reduction in flow is likely due to a combination of floodplain storage and infiltration in reaches where high stream flow has down cut the channel in the canyon reaches exposing the highly permeable outwash soil layer. Woodland Creek shows the greatest increase (62%) in effective impervious area and the greatest increase in peak flows at Pioneer Way East (HSPF Reach 40). Flood depths will increase at 112th Street East (HSPF Reach 43) under future land use conditions but the increase in peak flow is predicted to be less than 5%. Only a minimal increase in peak flows is expected in this reach because the increased flooding will further attenuate peak flows. In addition, discharge from this reach is limited to about 15 cfs through the pipe under 104th Street East. Peak streamflow rates used by FEMA to develop floodplain information were substantially lower than peak flow rates predicted by the hydrologic analysis presented in Table 6-1. For instance, the 100-year peak flow rate published in the Unincorporated Pierce County Flood Insurance Study for Swan Creek at Pioneer Way was 244 cfs. The flood insurance study value is 125 cfs lower than the peak 100-year flow rate of 374 cfs (see Table 6-1) predicted by the HSPF model. Pierce County Public Works & Utilities 6-7
173 STORMWATER DRAINAGE & FLOODING This difference is probably due to a combination of land development and the availability of a longer hydrologic and precipitation data record. The original flood insurance study was conducted in Since that time, additional impervious area has been added with new development, which in turn has increased peak flows in Swan Creek. Additionally, analytical techniques used to develop peak flows for the FEMA study were much less sophisticated then the techniques used in the HSPF analysis and likely under predicted peak flows in the Basin. Flow Duration and Stage Duration Analysis The amount of time (generally expressed as a percent of total time) in which a given flow, or stage, is equaled or exceeded. Duration analysis provides insight on basin hydrology during nonflood events. For example, extended periods of high-flow can erode streambanks and incise the stream channel, leading to bank failure. Extended periods of high-flow also increase the difficulty of maintaining fish sustaining habitat. Conversely, extended periods of low-flow can adversely affect water quality during the summer months. Water quality effects can include temperature increases, reductions in dissolved oxygen, and concentration of pollutants. Flow duration was computed for 13 locations in the Clear/Clarks Creek Basin. Flow duration data was used to qualitatively identify water quality and habitat problems due to low streamflow, erosion, and poor habitat function. Table 6-2 shows the results of this analysis. Flow duration plots are provided in Appendix F. The HSPF analysis predicted that the duration of high flows will increase under future conditions for most subbasins (see Table 6-2). In this region, flows above the two-year peak flow level typically exceed the capacity of the stream channel and often result in erosion of the channel banks and bottom. Table 6-3 illustrates that the duration of these potentially damaging flows will increase in most of the streams and will likely worsen erosion in reaches already experiencing incising and down cutting. TABLE 6-2 Existing and Future Flow Duration HSPF Percent Time Exceeded b Reach a Location Existing Land Use Condition 1 Swan Creek - Pioneer Way East Swan Creek - 67th Street East (Extended) Squally Creek - Pioneer Way East Clear Creek - 49th Street East (Extended) Clear Creek West Fork at 64th Street East Clear Creek - East Fork at 72nd Street East Canyon Creek - Pioneer Way East Canyon Creek - W Trib. at Canyon Road East Canyon Creek 77th Street East Canyon Creek 84th Street East Pierce County Public Works & Utilities 6-8
174 STORMWATER DRAINAGE & FLOODING TABLE 6-2 Existing and Future Flow Duration HSPF Percent Time Exceeded b Reach a Location Rody Creek - 84th Street East Diru Creek - Pioneer Way East Woodland Creek - 84th Street East Future Land Use Condition 1 Swan Creek - Pioneer Way East Swan Creek - 67 th Street East (Extended) Squally Creek - Pioneer Way East Clear Creek - 49th Street East (Extended) Clear Creek - West Fork at 64th Street East Clear Creek East Fork at 72nd Street East Canyon Creek - Pioneer Way East Canyon Creek West Trib. at Canyon Road East Canyon Creek 77th Street East Canyon Creek 84th Street East Rody Creek - 84th Street East Diru Creek - Pioneer Way East Woodland Creek - 84th Street East a See Figure 6-1 for HSPF Reach locations b Percent time exceeded refers to the percent of time a tabulated flow rate is exceeded. For example, flow in Swan Creek at Pioneer Way East exceeds 13.3 cfs 10% of the time. Similarly, flow in Squally Creek at Pioneer Way East exceeds 0.6 cfs 50% of the time. TABLE 6-3 Average Number of Hours per Year with Flow Duration Above 2-year Peak Flow Level a HSPF Reach a Location Existing Future Change in Duration 1 Swan Creek - Pioneer Way E Swan Creek - 67th Street (Extended) Squally Creek - Pioneer Way E Clear Creek - 49th Street E (Extended) Clear Creek - West Fork at 64th Street E Clear Creek - East Fork at 72nd Street E Canyon Creek - Pioneer Way E Canyon Creek - W Trib. at Canyon Road E Canyon Creek - 77th Street E Canyon Creek - 84th Street E Rody Creek - 84th Street E Diru Creek - Pioneer Way E Woodland Creek - 84th Street E See Figure 6-1 for HSPF Reach locations. Pierce County Public Works & Utilities 6-9
175 STORMWATER DRAINAGE & FLOODING Runoff Volume and Low-Flow Analysis Appendix H presents the results of the runoff volume analysis as the predicted average monthly and annual runoff volume under existing and future land use conditions. The results are used qualitatively in the water quality and habitat analysis in a manner similar to the flow duration analysis. Table 6-4 shows the months of the year when the model predicted the occurrence of low flows in Clear and Clarks Creek and the tributary drainages. Generally, the model predicted that water is available year-round in the most downstream reaches of each creek, but intermittent flow occurs in the upper reaches when stream flow drops to very low levels in the summer. The volume analysis showed that stream flow occurs in all the reaches from late fall through spring, but drops to nearly zero in all creeks during the summer except for the lowland reaches of Clear Creek and Clarks Creek. These creeks are able to sustain streamflow year-round in the Puyallup Valley reaches due to the presence of springs and seeps in the toe of the plateau Hydraulic Analysis Hydraulic analyses were conducted for many of the major stream channels, tributary drainage systems, and localized flooding problems located within the Clear/Clarks Creek Basin. Hydraulic models were used to evaluate flooding issues resulting from insufficient conveyance capacity, evaluate fish passage conditions through stream culverts, and to develop routing elements for use in the hydrologic model. The models used in this analysis include: HEC-RAS Backwater model developed by the US Army Corps of Engineers specifically designed to simulate the hydraulics of open channel systems. This model contains many options for simulating flow through culverts, including a wide variety of culvert shapes to choose from, and accounts for losses through culverts better than many other programs. This model was used for reaches with more than one culvert or where backwater effects were assumed to occur. The problem investigation for RD-7 is an example of an application if this model. HY8 Culvert analysis program developed by the Federal Highway Administration (FHWA). This model computes barrel velocity and headwater depth and was used to analyze culvert hydraulics at flooding problem locations occurring at a single location with limited downstream backwater effects. The problem investigation for CL-6 is an example of this model. Inlet control nomographs A graphical procedure developed by the FHWA that computes headwater for pipe and culvert systems. This technique is used to analyze roadside and driveway culverts. The problem investigation for WO-6 is an example of an application of this model. Storm drain analytical techniques Uniform flow analysis was used to simulate the hydraulics of drainage systems consisting mostly of enclosed pipes. Backwater analysis was performed in areas with significant backwater influence. Inlet and catch basin capacity was analyzed in accordance to WSDOT Hydraulics Manual grate inlet design capacity. The problem investigation for SW-5 is an example of an application of this model. Pierce County Public Works & Utilities
176 STORMWATER DRAINAGE & FLOODING The existing problem areas described in Chapter Five were analyzed using the analysis tools described above. Each problem was analyzed to determine the extent of flooding under existing and future land use conditions. Then the 136 flooding problems were evaluated to determine the cause of flooding. The first step in this evaluation consisted of a desktop assessment followed by a site visit to gain a better understanding of the problem. During the initial evaluation, over 40 of the flooding problems were determined to either: have been resolved; were outside the jurisdiction of the county; were private property issues; or could be resolved through maintenance activity. Almost 40 of the remaining problems could be analyzed qualitatively and would likely be considered a small works project. Small works projects are generally implemented by County Water Programs maintenance crews at a cost of less than $25,000. The remaining 54 problems required hydraulic analysis using the techniques described previously. Hydraulic analysis results can be found in Appendix I. 6.2 Existing Problems Flooding Repetitive Losses The Federal Emergency Management Agency (FEMA) has identified Pierce County as a repetitive loss community. FEMA defines repetitive loss properties as those where two or more National Flood Insurance Program (NFIP) claims of at least $1,000 each have been paid within any 10-year period since To participate in the NFIP Community Rating System, Pierce County developed a Repetitive Loss Plan (January 2001). Lower Canyon Creek is a Repetitive Loss Area The valley part of the Canyon Creek Basin is one of three areas experiencing repetitive losses from flooding, based on FEMA records. According to the Repetitive Loss Plan, widespread flooding occurs in the vicinity of 47th and 50th Avenues East, and 40 th and 55th Streets East. Flooding is due to the backwater effects of the Clear Creek floodgates. The mouth of Canyon Creek is close to the mouth of Clear Creek into the Puyallup River. The floodgate at the mouth of Clear Creek can either prevent, or cause flooding, depending on flow conditions in the Puyallup River and Clear Creek. If river stages are high in the Puyallup River, the gates close preventing river flood waters from entering the Clear Creek system. However, this also prevents Clear Creek from discharging into the river and results in water backing up into Swan Creek, Clear Creek, and Canyon Creek. A number of homes in this area were identified as repetitive loss properties. Flooding occurred at other properties in the repetitive loss area; however, no insurance claims were filed. According to the Draft Repetitive Loss Plan, residents in this area filed flood insurance claims in seven of the last 20 years. This corresponds to a 33% chance of flooding in any year. The Drainage Issues figure specific to the Clear Creek Basin (Figure 5-1) shows the general location of the repetitive loss area. Pierce County Public Works & Utilities
177 STORMWATER DRAINAGE & FLOODING Causes of Drainage Problems Overview In general, the drainage problems in the Basin are being compounded by the cumulative effects of historic and ongoing development. The addition of each single-family home results in more impervious surface area and additional surface water runoff. With the increasing development of the Clear/Clarks Creek Basin, there are issues related to the loss of floodplain storage area along the creeks, undersized culverts, and the loss of flow capacity due to invasive vegetation in the roadside channels and streams that are not addressed by development regulations. Development regulations concentrate on not increasing the rate or volume of stormwater coming from a building site, not on runoff, channels or streams passing through. In addition, development is authorized within the 500-year floodplain and many wetland violations occur. Figure 4-10 shows the location of the 500-year floodplain. Figure 4-11 shows the location of wetland areas. Drainage districts continue to operate in some parts of the Clear/Clarks Creek Basin. County maintenance staff generally is not allowed to perform ditch maintenance work within the boundaries of a Drainage District or on private property. County maintenance staff can perform work within a road Right-of-Way (ROW) or an easement. In terms of surface water that flows through different jurisdictions, the County maintenance staff can only address problems within unincorporated Pierce County boundaries. In some cases, a ditch in need of maintenance within a Drainage District may be the cause of upstream flooding within the County s jurisdiction. Access to storm drainage facilities is hindered by encroachment of buildings, outbuildings, fences, and yards into the ROW or drainage easements. In some cases, fences and sheds are built directly over manholes and encroach into the ROW. Unauthorized landscaping in the ROW can also be a problem Storm Drainage and Surface Water Management Plan Culverts An analysis of culverts in the Clear/Clarks Creek Basin was performed for the 1991 Storm Drainage and Surface Water Management Plan, Volumes I and II (1991 Plan) (James M. Montgomery Consulting Engineers, Inc., 1991). The 1991 Plan analyzed 96 County-owned culverts. Of these culverts, 70 (73%) did not meet the design criterion (the ability to pass the 25-year design flow with a water depth less than 1.5 times the diameter of the culvert). 47 of these culverts were determined to be sufficiently undersized to warrant their inclusion in the study s Capital Improvement Program. Culvert upgrades were proposed because it was not feasible to provide enough detention upstream to reduce flood flows. The Clear Creek Basin contained 24 projects and the Clarks Creek Basin contained 23. No culvert projects were proposed within the pothole or Roosevelt Ditch areas. Other culverts in the Clear/Clarks Creek Basin were not selected for improvement because they: 1) had adequate capacity; 2) it was not cost-effective to provide the upgrades; or 3) the culverts functioned as a flow controller and helped to reduce downstream flood peaks. Pierce County Public Works & Utilities
178 STORMWATER DRAINAGE & FLOODING Undersized Storm Drain Pipelines 12 storm drain lines within the James M. Montgomery, Inc., study area were analyzed. Of these, five pipelines were found to be sufficiently undersized to warrant a recommendation to improve them: 24-inch diameter pipeline carrying Woodland Creek from 104 th Street East to 100 th Street East 36-inch diameter pipeline on south side of 97 th Street East in the Swan Creek Basin 12-inch diameter pipeline along 66 th Avenue East carrying Diru Creek from 106 th Street East to 104 th Street East Pipeline connecting along 58th Street East and 112 th Street East connecting area east of 58 th Street East to Canyon Creek 24-inch diameter pipeline along 76 th Street Ct. East connecting Portland Avenue East stormdrain system to Roosevelt Ditch Undersized Private Storm Drainage Facilities The 1991 Plan also identified three undersized private bridges and 73 private culverts in the Clear/Clarks Creek Basin study area. No analysis was performed on the bridge passages (assumed that they were adequate); however, the Plan states that approximately 50 (70%) of the private culverts appear to be inadequately sized. Detention Facilities Recommended The 1991 Plan identified 36 sites for detention facilities. The 1991 Plan also recognized the importance detention in protecting streams from excessive erosion. 11 sites were identified in the Clear Creek Basin, four in the Clarks Creek Basin, and 20 sites were in the Potholes Basin. All but four of the detention projects recommended for the creek drainages were located at roadway embankments. One of the projects recommended siting a sedimentation basin in Swan Creek Park. This project was constructed in 1990 and modified in The remaining three projects in the creek drainages and all the projects recommended for the Potholes Basin consisted of flood plain zoning or acquisition. Implementation of the 1991 Plan The implementation of the 1991 Plan is as follows: 17 of the recommended projects in the 1991 Plan have been constructed. 33 projects are included as recommendations in this basin plan. Ten of these projects are currently in various stages of design by Water Programs. The updated hydrologic and hydraulic analysis conducted for this plan showed that the culverts at 20 of the project locations were found to have adequate capacity and therefore, did not need to be upgraded. 21 of the projects recommended in the 1991 Plan were not recommended in this basin plan. 12 of the projects in the 1991 Plan recommended constructing dams to provide additional instream Pierce County Public Works & Utilities
179 STORMWATER DRAINAGE & FLOODING detention storage in the system. These storage facilities would be created through the placement of new structures in the stream channel or by converting existing roadway embankments to dams. The 1991 detention CIP projects were not included in this basin plan because these types of structures are barriers to fish passage and would probably not be permitted by the regulatory agency. Also, converting roadway embankments to dams raises a public safety issue, should the embankment fail. A comparison of the 1991 Plan to this basin plan can be found in Appendix C Culvert and Channel Capacity The hydraulic analysis tools described in the previous section were used to evaluate 54 of the 138 flooding problems presented in Chapter Five. The evaluation included 33 culverts, 13 stormdrain systems, and seven roadside ditch and culvert systems. The most common flooding problem is roadway overtopping due to insufficient culvert conveyance capacity. In addition, 24 instances of property flooding are documented. The greatest concentration of drainage problems occurs in the Roosevelt Ditch, Canyon Creek, Rody Creek, and Woodland Creek subbasins. 12 of the 33 culverts, eight of the 13 storm drains, and all seven of the ditch and culvert systems analyzed for this basin plan were found to be undersized and flood under existing land use conditions. Table 6-5 lists the undersized culverts, Table 6-6 lists the undersized storm drains and Table 6-7 lists the undersized ditch and culvert systems. Pierce County Public Works & Utilities
180 STORMWATER DRAINAGE & FLOODING a TABLE 6-4 Frequency of Flooding at Undersized Roadway Culverts under Existing Land Use Conditions Problem ID a Location Return Period SW-1 80th Street East 25-yr CL-5 88th Street East 10-yr CY th Street East 10-yr CY-3 116th Street East 5-yr CY-30 b 103rd Street East 25-yr CY-31 Pipeline Road 50-yr RY-7 96th Street East at Pipeline Road 25-yr RY-8 98th Street East 1-yr DU-7 96th Street East 100-yr WO-6 72nd Avenue East from 93rd Street East to 96th Street East 2-yr WO-8 80th Street East 2-yr RD-17 90th Street East 25-yr See Figures 5-1, 5-2, and 5-3 for problem locations. b. Culvert has sufficient capacity, structure flooding occurs at 104 th Street East a TABLE 6-5 Frequency of Flooding in Storm Drain Systems under Existing Land Use Conditions Problem ID a Location Return Period SW-5 84th Street East 25-yr SW-16 24th Avenue East from 84th Street East to 92nd Street East 2-yr CL-3 CY-5 North Side of Intersection of 96th Street East and 48th Ave East, 4700, 4800, and 4900 block of 96th Street East block of 58th Avenue East and and block of 59th Avenue East 1-yr 10-yr CK-9 104th Street East (Woodland Elementary School) 10-yr PH block of 92nd Avenue East 2-yr PH block of 127th Street East 5-yr RD block of Portland Avenue East 25-yr See Figures 5-1, 5-2, and 5-3 for problem location. Pierce County Public Works & Utilities
181 STORMWATER DRAINAGE & FLOODING TABLE 6-6 Frequency of Flooding in Roadside Ditch & Culvert Systems under Existing Land Use Conditions Problem ID a Location Return Period SQ block Vickery Avenue west side 2-yr CL-4 104th Street East 1-yr DU block of Pioneer Way East 100-yr CK block of 104th Street East 5-yr CK block of 96th Street East 2-yr RD block of 20th Avenue East 25-yr RD block of 85th Street East 1-yr a See Figures 5-1, 5-2, and 5-3 for problem location Stream Bank Erosion/Instability The hydrologic analysis did not include flow prediction under pre-development conditions. However, typically, urbanization leads to an increase in peak flows for all return periods with the largest relative increase occurring for the high-frequency events. These increased peak flows tend to increase the depth and frequency of streambed scour (Booth, 1990). Current detention standards are effective in controlling peak flows from large storm events, but extend the flow duration for intermediate level storm events and provide little benefit for smaller storms (CH2M HILL, 2001). The increased peak flows have degraded the canyon reaches of streams by incising, or down cutting, the channel. Channel down cutting leads to a widening of the channel when the oversteepened streambanks collapse. Active channel incision and collapsing streambanks are a significant source of sediments in the creek systems. The most notable example is Swan Creek below 64 th Street East, where past episodes of channel down cutting have widened the channel to form nearly vertical banks for more than a mile (8,000 feet) downstream of 64th Street East. Channel down cutting has caused significant damage to the 64 th Street East culvert where the concrete outlet apron has detached from the culvert and fallen into the creek. The culvert is now perched about four-feet above the channel, and scour at the culvert outlet is undermining the integrity of the culvert. If left unchecked, continued erosion may ultimately compromise the integrity of the roadway embankment. Streambank erosion can contribute to flooding when sediment is transported from the canyon reaches and settles in the low-gradient, slow moving, floodplain reaches. Sediment accumulation in these reaches reduces the conveyance capacity of the channels, culverts and bridges and can lead to overbank flooding. Over time, property loss through the streambank erosion will occur as the channel responds to the reduced conveyance capacity. In the most extreme case, sediment deposition can result in channel avulsion. Channel avulsion occurs when the channel becomes so obstructed with sediment that the stream jumps it banks and cuts a new channel. Channel avulsion has occurred in Woodland Creek upstream of 80 th Street East when sediment from an upstream incision event was transported downstream to a more Pierce County Public Works & Utilities
182 STORMWATER DRAINAGE & FLOODING moderately sloped reach. Sediment deposition occurred which clogged the channel causing the creek to overtop its banks. No new channels were created with this event but a large amount of gravel was deposited in the floodplain of this reach. Additional discussion on streambank erosion is provided in Section Groundwater Recharge The conversion of pervious land to impervious land usually results in more stormwater discharge to the stream system and less rainwater available for groundwater recharge to the shallow and deep groundwater aquifers. Recharge to the shallow groundwater is important because it provides base flow to the creeks during the dry summer months. See Chapter Eight for additional discussion on base flow in the creeks. Recharge to the deep groundwater aquifer is an important source of water supply in the Basin, in the most northerly part of a designated Sole Source Aquifer. Groundwater recharge is affected most in the western part of the Basin overlain by till soils (hydrologic soil types C and D, see Figure 4-2). These soils have a very low infiltrative capacity and groundwater recharge rates in this are sensitive to land use conversion. Conversely, the soils on the eastern side of the Basin are overlain by outwash soils (hydrologic soil types A and B, see Figure 4-2) which have very high infiltration rates are not likely effected by conversion to impervious land cover. 6.3 Future Problems Flooding Hydrologic analysis predicted a significant increase in peak flow rates under future land use conditions in Swan and Woodland Creeks. The largest increases occur for the more frequent events. The creek analysis also predicted that the duration of flow above the two-year peak flow rate (channel shaping flow) will also increase in Swan and Woodland Creeks and in the upland reaches of Canyon Creek. Because stream flow rates in excess of the two-year peak flow rate most heavily influence channel shaping processes, higher peak flows of longer duration will likely increase the rate of erosion in these stream and further degrade habitat. More frequent flooding will also occur with increased flow rates predicted to occur under future land use conditions. The analysis showed that flooding will occur at one new location and occur more frequently at 11 existing problem areas. Table 6-8 shows the problems from Table 6-6 that will increase in frequency under future land use conditions. Note that the hydrologic analysis of future land-use conditions did not consider the effect of the stormwater detention facilities. If current stormwater management standards are properly applied for all new development then peak flow increases may not be as high as predicted, although, and importantly, cumulative effects would continue. However, there are numerous approved subdivisions in the basin that were approved before adoption of the current stormwater standards. Previous stormwater control regulations were much less stringent, so peak flow will likely increase if these projects are built. Pierce County Public Works & Utilities
183 STORMWATER DRAINAGE & FLOODING TABLE 6-7 Problem Locations with Increased Frequency of Flooding under Future Land Use Conditions Problem ID a Location Return Period CL-6 76th Street East 100-yr CY th Street East 5-yr CY-3 116th Street East 2-yr CY block of 58th Avenue East, block of 59th Avenue East 2-yr CY-30 b 103rd Street East 5-yr RY-7 96th Street E at Pipeline Road 10-yr WO-6 72nd Avenue East between 93rd Street East-96th Street East 1-yr WO-8 80th Street East 1-yr CK-9 104th Street East (Woodland Elementary School) 10-yr PH block of 127th Street East 2-yr RD block of Portland Avenue East 10-yr RD block of 20th Avenue East 10-yr RD-17 90th Street East 10-yr a See Figures 5-1, 5-2, and 5-3 for problem location b Culvert has sufficient capacity, structure flooding occurs at 104 th Street East Stream Bank Erosion/Instability Table 6-1 showed that streamflow rates in nearly all creeks are likely to increase in the future, which will further increase the rate of channel erosion and streambank instability. Furthermore, Table 6-3 showed that the duration of flows greater than the two-year peak flow event (channel shaping flow) will increase in most creeks with significant increases in Swan Creek, Canyon Creek, and Woodland Creek. Each of these streams already experience high rates of erosion. Additional discussion on streambank erosion is provided in Section Groundwater Recharge Groundwater recharge rates will probably decline in the areas with the highest density (and highest impervious area) of future development. Figure 4-6 shows that shows that the entire Roosevelt Ditch area, and Swan, Canyon, Rody, Diru Creek subbasins south of 112th Street East and the Woodland Creek subbasin are zoned as medium density residential or mixed use districts, which typically have higher levels of impervious area. The Clarks Creek subbasin and the Potholes Basin are zoned for similar land uses, but groundwater recharge rates are not expected to be affected because these areas are underlain by the highly infiltrative outwash soils. Pierce County Public Works & Utilities
184 STORMWATER DRAINAGE & FLOODING 6.4 Potential Solutions Three types of CIP projects were developed to solve drainage problems. They are: Peak flow attenuation through regional detention or retention Conveyance improvements (enlarged storm drain pipelines and cross culverts) Acquisition (floodplain and headwaters) Stormwater detention facilities attenuate peak flows by storing stormwater runoff during peak flow events, then slowly releasing the stored water over an extended period of time. Stormwater retention facilities also store stormwater runoff during peak flow events, but they infiltrate the water into the ground rather than discharge to the surface. Stormwater retention is more desirable than detention because groundwater is recharged and base stream flows may be improved as a result. However, stormwater retention has limitations in the Clear/Clarks Creek Basin due to the absence of suitable soils in many of the subbasins. Both regional detention and retention facilities are expensive and sometimes difficult to site. Conveyance improvements generally involve replacing smaller, undersized pipes or surface conveyance systems with larger more efficient systems. Conveyance improvement projects frequently include measures that retain floodplain storage, such as floodplain excavation or raised roads, so that the flooding problem is not passed downstream. Property acquisition is an effective strategy when vulnerable property lies within the floodplain or the flooding is so extensive that the solution costs more than the property that is being protected, or to preserve natural functions of floodplains including their flood storage and channel migration functions. Easement or property acquisition is also needed for some projects to provide a dedicated tract for drainage facilities. Programmatic solutions can be very useful in preventing future flooding problems. These measures include changes to storm water management standards, land acquisition and management programs for preserving floodplain, education, low-impact development, increased maintenance and inspection, monitoring, technical assistance, and floodplain mapping. The capital improvement program (CIP) projects and programmatic solutions recommended to address individual problems identified in this chapter can be found in Chapter Nine. Over 100 drainage problems were investigated during development of the Clear/Clarks Creek Basin Plan. Each of these problems was evaluated and a determination made about the manner in which each of the problems should be addressed in the Plan. The problem groupings: Not directly addressed in the Plan because the drainage problem has been resolved, involves a private storm drain system, or is outside the authority of the County; Needs County action, but does not require a major capital cost or program; Suitable for a Capital Improvement Program (CIP) project; More appropriately solved with an existing county-wide program; or Requires additional study to fully understand the problem. Each of these solution classifications is described in detail in the following sections. Pierce County Public Works & Utilities
185 STORMWATER DRAINAGE & FLOODING Problems Resolved or Not Addressed in the Basin Plan Over the course of the investigation, it was found that some of the flooding problems had been resolved with earlier projects or other activity. Others problems were found to be private issues, outside the jurisdiction of the County, or administered by other County departments or agencies. Some of the flooding problems have been resolved through ongoing activity in the basin by Water Programs or other County agencies. Private property flooding problems not addressed in this Plan were usually due to flooding from adjacent private property or occurred in privately owned drainage systems. The remaining problems were located outside the jurisdiction of the County. These problems were included in the original list because they were reported to the County. Some of these problems were reported to the County by residents living in incorporated areas and other reported problems occurred in areas that have since been annexed by adjacent communities. A total of 46 drainage problems were not addressed with this Plan: 28 of the drainage problems were found to have been resolved; 12 problems were assumed to be private property issues; and six drainage problems were referred to other jurisdictions. Tables 6-9 through 6-11 list problems not addressed in the Basin Plan. TABLE 6-8 Resolved Drainage Issues Problem ID a Problem Description Problem Resolution SW-6 Pond overtopping at 84th Street East during 1997 event. Hydrologic analysis shows detention pond has sufficient capacity. Event likely exceeded design standard SW-8 Obstructed field drainage Obstruction cleared by constructing a ditch CL-6 Private property flooding No structure flooding, property is located in floodplain CY-2 Road flooding at intersection of Canyon Road and 112th Street East Drainage improved with recent roadway improvement project CY-6 84th Street East Hydraulic analysis showed no flooding at this site CY-7 West Fork at 96th Street East. Hydraulic analysis showed no flooding at this site CY-8 West Fork at 104th Street East Hydraulic analysis showed no flooding at this site CY-9 East Fork at 96th Street East Hydraulic analysis showed no flooding at this site CY-11 East Fork at 112th Street East Hydraulic analysis showed no flooding at this site RY-9 Pioneer Way East Hydraulic analysis showed no flooding at this site RY-10 90th Street East Hydraulic analysis showed no flooding at this site RY th Street East Hydraulic analysis showed no flooding at this site RY th Street East Hydraulic analysis showed no flooding at this site RY th Street East Hydraulic analysis showed no flooding at this site DU-1 Private driveway flooding on 66th Avenue East. A cross culvert has been installed to convey flow under drive Pierce County Public Works & Utilities
186 STORMWATER DRAINAGE & FLOODING TABLE 6-8 Resolved Drainage Issues Problem ID a Problem Description Problem Resolution DU-6 90th Street East Hydraulic model showed no flooding at this site DU-8 104th Street East Hydraulic analysis showed no flooding at this site WO-7 84th Street East Hydraulic analysis showed no flooding at this site WO-11 Property flooding at 9100 block of Woodland Avenue East. WO-13 Road and driveway flooding on 6800 block of 90th Street East CK-7 PH-2 PH-8 PH-13 PH-16 PH-22 Flooding at block of 82nd Avenue NW Flooding from Meridian Park Place Pond overflow Road and property flooding at 145th Street East and 144th Street East. Property flooding in a closed depression Road flooding reported at 99th Avenue East Road and property flooding at 141st Street Ct. and 144th Street East Berm constructed along driveway to prevent roadway runoff from entering property Maintenance activity has resolved this problem Additional detention ponds constructed in the area Detention pond has been expanded Maintenance activity has resolved this problem Recent County project has solved this problem Maintenance activity has resolved this problem Recent County project has solved this problem RD-8 85th Street East Hydraulic analysis showed no flooding at this site RD-9 80th Street East Hydraulic analysis showed no flooding at this site a See Figure 6-2 for problem location Problem ID a CL-8 CL-9 CL-13 CY-4 WO-15 PH-3 PH-4 TABLE 6-9 Private Property Drainage Issues Problem Description Property flooding at 4500 block of 112th Street East caused by dumping in drainage ditch Yard flooding at 9300 block of 40th Avenue East Stormwater runoff from private road causes property flooding at 4000 block 53rd Ct. Street East Poor maintenance of private system causes private property flooding at 8600 block of Canyon Road Stormwater runoff from private road causes flooding at 6900 block of 81 st CT East Drainage dispute between adjacent property owners that has been resolved Pierce County Public Works & Utilities
187 STORMWATER DRAINAGE & FLOODING Problem ID a PH-10 PH-11 PH-19 PH-20 RD-3 TABLE 6-9 Private Property Drainage Issues Problem Description Stormwater runoff from private road causes flooding on private property at block of 82nd Avenue Court East Restaurant parking lot built in depression is causing private property flooding Runoff from commercial development to the west is causing roadway flooding at 9600 block of 159th Street Court East Private detention pond overflowing at block of 83rd Avenue East Parkside Village storm drain system needs maintenance a See Figure 6-2 for problem location TABLE 6-10 Drainage Issues Referred to Other Jurisdictions Problem ID a Problem Description Jurisdiction SW-15 Field flooding south of Hwy 512 on west side of Waller Road. Drainage District No. 14 SW-30 Private property flooding on Pioneer Way East City of Tacoma CL-8 Property flooding at 4500 block of 112th Street East caused by dumping in drainage ditch Drainage District No. 14 CY-31 Flooding at Pipeline Road City of Tacoma CK-4 CK-8 Flooding at 1000 block of 16th Street SW (Meeker Ditch), 12th Avenue SW, and 2200 block of Pioneer Way East Flooding at 7400 block of Stewart Avenue and 6300 block of 76th Avenue East City of Puyallup City of Puyallup a See Figure 6-2 for problem location Pierce County Public Works & Utilities
188 _ ô YZ [ žÿ ÇÈ OPQ RS TU ;< => /. 0 ÔÕ ÿ À qrs tu vw»¼½ ¾ À YZ º ¹ ª «ŒŽ Š ÉÊÌË ËÎÍÏ Ê É Í Œd Š "!$#&%('*) ÒÓ ÐÑ Ð t xs w tu pv tu sr pq yz {} ~ + ƒ \L] ^ _a` ^ b c ` d +šnš +šnš +šnš +šnš +šnš BEDF ŒŽ Š ŒŽ Š ŒŽ Š efjglhi g*j n p o no m klm ŒŽ Š ƒ š& œ ŒŽ Š?@"A$B&CED*F GHJILKM I*N $ L * VWX V ³ µ$ L *¹ º : :;<#=3> <? 1 Š µ ³² ± 1 Š 1 Š µ ³² ± 1 Š äå ãâ áâ ßà ÝÞ 1 Š 1 Š ªE«ˆ Š ˆ Š ˆ Š ÃÆ Å ÃÄ Á ˆ Š ˆ Š V ˆ Š ˆ Š ˆ Š ˆ Š ˆ Š ˆ Š ˆ Š ˆ Š ˆ Š ˆ Š ˆ Š ˆ Š ˆ Š šœ ŽŠ šœ ŽŠ šœ ŽŠ šœ ŽŠ Š Š Š Ö ØaÙÚÛ ÙÜ Š ¾ ¾ ¼ Ÿž Š no lm k ij Ÿž Š h Ÿž Š % Š GIHJ K+LNM MOP5Q ö aøùúûüþý % Š ` ]_ ]^ \[ RS%TVU W T5X,-/ ƒ ˆŠ ƒ &± *² a b bdc5ef chg 89: ŒŒƒ Ž æçèjélêë é*ì % Š -,+ + íîï"ð$ñ&òôóõ xyza{ } {~!#"%$ &(' )+* ñ ö ÿ ñ ñ õ ô ö ï(ó ñëøvùúêûø+ò(ó ü%ô ñ ô ý þœó ö ö ñëøvùiÿ ëîï í ï þœó ö ö ñëøvù ëîï í ï ícñ ïœô íëîïœò êìëîí ïðëëñ ò(ó»%¼ ½ ¾ À Á Â5   Á Â5  à Â5 ÂÅÄ1Æ ÆÇ! "$#"$%% $&%' () ' * + %%() '*,&%.-0/ 1223 È È ÉËÊÌ#Í Î È Ï Ð Ñ Ò È ÓËÊÔ ÐÕ Ô Ö1 ØÑ Ù Ú Û Ü Ý Ô Ï Û Ó Ù È Þ ß à á â Þ È ãeäé È Î Ï ÐÈ Ð Ô Ï Ñ ÐÛ ÈÕ Õ Õ å Û Ì/â æî Ï Ð ç Ô Íâ è è áî é
189 STORMWATER DRAINAGE & FLOODING Small Works Projects, Maintenance, and Enforcement Issues Fifty-one of the drainage problems identified in the Basin Characterization can be addressed by a small works project at a cost less than $100,000, maintenance activity, or enforcement of County ordinances. This includes 37 small works projects, 20 maintenance projects, and 2 enforcement actions. Table 6-12 lists these projects and the proposed resolution Capital Improvement Program Projects There were 35 projects developed to solve 34 drainage problems in the Clear/Clarks Creek Basin. These projects are of a mix of conveyance improvements (culvert, pipeline and swales), raising roadways out of the floodplain, property acquisition, and detention expansion. In addition to these projects, the detention projects presented as habitat CIPs (see Section 8.5) will provide additional flood protection in the creek reaches. Table 6-13 summarizes CIP projects by subbasin in the Clear/Clarks Creek Basin. The project locations for the Roosevelt Ditch, Swan Creek, Squally Creek, Clear Creek and Canyon Creek subbasins are shown in Figure 9-1. The project locations for the Rody Creek, Diru Creek, Woodland Creek, and Clarks Creek subbasins are shown in Figure 9-2. The project locations for the Potholes subbasin are shown in Figure 9-3. Each of the projects listed in Table 6-13 are discussed in greater detail in Chapter Nine Potential Programmatic Measures Six programmatic measures are recommended that will serve to reduce flood hazard impacts. These include: Develop and Implement a Land Management Program for Flood Hazard Reduction and Water Quality and Habitat Impact Mitigation (an acquisition-maintenance program) Adopt Updated Stormwater Management Standards Develop and Implement an Education, Outreach and Technical Assistance Program Develop and Implement a Surface Water Management Monitoring Program Require Flood Disclosure Statements on Property Titles Pierce County Public Works & Utilities
190 STORMWATER DRAINAGE & FLOODING 6.5 Sites Requiring More Detailed Data or Analysis Two additional studies are recommended to fill information gaps in the Clear/Clarks Creek Basin: CIP03-SW-DS01 Floodplain Analysis-Swan Creek Headwaters South of 112th Street East This area has experienced groundwater and surface flooding in the past in addition to wetlands, fill, and grade violations. The land use in this area is expected to convert from single-family residential to medium-density residential and mixed-use in the future. A detailed hydrologic and hydraulic analysis should be performed to quantify the extent of the flooding problem. The floodplain should be mapped and the base flood elevation (BFE) established to ensure that existing floodplain storage is retained. CIP03-CL-DS01 Floodplain Analysis-West Fork Clear Creek, 84th to 88th Street East Extensive road and property flooding has been reported in this area. Several structures appear to be located in the floodplain, however; accurate structure low-water entry, and culvert elevation information are unavailable. A detailed hydrologic and hydraulic analysis should be performed to quantify the extent of the flooding problem. The floodplain should be mapped and the BFE established to ensure that existing floodplain storage is retained. TABLE 6-11 Small Works Drainage Issues Identified for Clear Clarks Creek Subbasins ID No. a Location Problem Description Potential Solution SW block of 80th Obstructed culvert causing roadside Maintain obstructed culvert. Street East flooding. SW-4 Swan Creek at Pioneer Road East SW-7 SW-9 SW-11 SW-12 SW-13 SW-14 SW-16 Intersection of 24th Avenue East and 90th Street East block of 112th Street East 9500 block of Portland Avenue East 2800 block of 96th Street East 9900 block of Waller Rd E Swan Creek block of Waller Rd East 24th Avenue E from 84th Street East to 92nd Street East Sedimentation buildup at Pioneer Way causing property flooding. Culvert downstream under the BNSF railroad also backs up contributing to flooding. Maintain sedimentation pond upstream of Pioneer Way and the culvert under the BNSF railroad. Stormwater ponds at the intersection. Construct ditch on 90th Street East to drain stormwater to Roosevelt Ditch. Excessive vegetation in roadside ditch causing roadway flooding 150-feet west of Swan Creek crossing. Roadway runoff causing driveway and garage flooding. Roadway runoff causing property flooding and driveway culvert is plugged. Backyard flooding due to filling in of Roadway runoff causing property flooding. Insufficient inlet capacity causing road and property flooding. Maintain of ditch. Install raised asphalt lip to prevent road runoff from entering residential driveway. Install berm on south side of road and clear obstructions from driveway culvert. Maintain this section of Swan Creek. Install inlet in driveway and connect with 12-inch-diamter storm drain to drainage structure just south of the home. Provide additional inlet capacity in existing storm drain system. (This problem is also recommended as a candidate Low Impact Development Resolved Through: Maintenance Maintenance Small Works Project Maintenance Small Works Project Small Works Project Maintenance Small Works Project Small Works Project Pierce County Public Works & Utilities
191 STORMWATER DRAINAGE & FLOODING TABLE 6-11 Small Works Drainage Issues Identified for Clear Clarks Creek Subbasins ID No. a Location Problem Description Potential Solution retrofit project). SQ block of Waller Rd Front yard and house flooding Reestablish east bank of roadside East reported in Low bank on east ditch. SQ block Vickery Avenue west side side of roadside ditch. Roadway flooding due to undersized roadside ditch and culvert system. CL block of 44th Avenue East Road flooding due to two obstructed driveway culverts. CL-3 Intersection of 96th Road flooding due to obstructed Street East and 48th culvert at intersection. Ave East Property flooding due to no drainage 4700, 4800, and 4900 system on 96th Street E. block of 96th Street East, north side CL-6 76th Street East Wire fence installed at downstream end of culvert may be obstructing flow. One-half foot head differential through fence noted during site visit. CL-7 CL-11 CL block of 105th Street East 4700 block of 53rd Street East 5400 block of 57th Avenue East CL-28 West Fork Clear Creek at 72nd Street East CL-29 East Fork Clear Creek at 72nd Street East CY-29 Canyon Creek at 72nd Street East CY through 5300 block of Pioneer Way East RY-1 RY-2 Rody Creek at 72nd Street East 6800 block of Bentley Rd East Chronic property flooding reported at 4700 block of 105th Street East in depression area south of roadway Fence posts placed in channel by downstream property owner likely cause a backwater condition at the 105th Street East culvert aggravating the flooding problem. Excavate ditches to provide additional conveyance capacity. Provide grate inlet in driveway between 5600 block of Vickery Avenue Clean culverts in 6600 block of 44th Avenue E. Construct new ditch and culvert conveyance system on 96th Street E. Clean blockages in culverts at intersection. Remove fence. Encourage downstream landowner to remove obstructions in channel. Resolved Through: Small Works Project Small Works Project Maintenance Small Works Project Small Works Project Enforcement Private property flooding. Install drywell on south side of road. Small Works Project Road runoff causing driveway Small Works flooding. Project Upstream end of culvert is blocked with extensive debris jam. Upstream end of culvert is blocked with extensive debris jam. Upstream end of culvert is blocked with extensive debris jam. Excessive vegetation in roadside ditch causing overtopping of Pioneer Way. Upstream end of culvert is blocked with extensive debris jam. Road runoff runs down driveway and washes around home. Install inlet to collect stormwater runoff at driveway and discharge to drainage swale located behind house. Requires drainage easement through property. Remove debris dam Remove debris dam Remove debris dam Clear excessive brush from roadway ditches on south side of Pioneer Way East between 44th Street East and 52nd Street East Remove debris dam Install asphalt berm to prevent road runoff from entering residential driveway. Maintenance Maintenance Maintenance Maintenance Maintenance Small Works Project RY block of 80th Street East Roadside ditch flooding driveway. Install culvert under driveway. Small Works Project RY block of 62nd Roadside ditch overtopping. Maintain ditch and culvert system. Maintenance Avenue East RY-14 Rody Creek at 72nd Upstream end of culvert is blocked Remove debris dam Maintenance Pierce County Public Works & Utilities
192 STORMWATER DRAINAGE & FLOODING TABLE 6-11 Small Works Drainage Issues Identified for Clear Clarks Creek Subbasins ID No. a Location Problem Description Potential Solution Street East with extensive debris jam. DU block of 66th Limited capacity of roadside ditch and Increase capacity of roadside ditch. Avenue East culvert system causing road flooding. DU block of 67th Stormwater ponding on roadway Install catch basin inlet and connect Avenue Ct. East occurs in depression. with 12-inch-diamter storm drain to existing storm drain system located on east side of road. DU block of 67th Road flooding due to blocked culvert Maintain culvert inlet in block DU-5 Avenue East 9900 block of 63rd Avenue Ct. East inlet. Driveway and garage flooding. DU-7 96 th Street East Hydraulic analysis predicted flooding for 100-year event under existing and future land use conditions. WO-3 WO-4 WO-9 WO-10 WO-12 WO-14 WO-16 WO-17 WO-18 WO-19 WO-20 WO-21 East side of Woodland Avenue at 119th Street East 6900 block of 113th Street Ct. East 6800 block of 128th Street E Road and property flooding due to plugged driveway culvert. of 67th Avenue East. Install new inlet on 12-inch-diamter storm drain on west side of 63rd Avenue Ct. East. Replace existing 18-inch-diamter culvert with a 24-inch-diamter culvert. Maintain driveway culvert. Resolved Through: Small Works Project Small Works Project Maintenance Small Works Project Small Works Project Maintenance Blocked grate inlet. Maintain grate inlet. Maintenance Private property flooding due to raised roadway block of Woodland Avenue 9100 block of Roadway runoff causing property Woodland Avenue East flooding. Intersection of Woodland Avenue and 84th Street East 8700 block of 72nd Avenue East Woodland Creek at 96th Street East Intersection of 96th Street East and 74th Avenue East 7200 block of 102nd Street East block of 74th Avenue East Woodland Avenue from 80th Street East to 76th Street East Blocked culvert causing road flooding. Maintain culvert. Water ponding at southeast corner of intersection due to no outlet. Water is coming from the south and west side and washing out driveway. Flow is minimal and seasonal. Blocked culvert causing road flooding. Maintain culvert. Runoff sheet flows from asphalt ditch on west side of 74th Avenue East and floods intersection. Install thickened pavement edge and inlet to capture runoff in storm drain system. Install asphalt berm to prevent road runoff from entering residential driveway. Construct ditch at southeast corner and slope toward Woodland Creek. Owner installed culvert has alleviated his driveway flooding problem. Maintenance of roadside ditch still needed on east side of 8700 block of 72nd Street East. Construct ditch on east side of 74th Avenue East and redefine ditch on south side of 96th Avenue East, west of intersection. Install inlet at southeast corner of intersection and connect to 96th Avenue East ditch. Catch basin inlet is full of gravel and Maintain catch basin. causing road flooding. Roadway and adjacent property runoff Extend existing ditch to flooding causes private property flooding. problem location. According to residents, new Improve drainage system on east development on Woodland Avenue side of road. between 80th Street East to 76th Street East altered drainage patterns which have resulted in flooding. Roadway was expanded and roadway runoff is diverted to east side of road. Small Works Project Maintenance Small Works Project Small Works Project Maintenance Maintenance Small Works Project Maintenance Small Works Project Small Works Project Pierce County Public Works & Utilities
193 STORMWATER DRAINAGE & FLOODING TABLE 6-11 Small Works Drainage Issues Identified for Clear Clarks Creek Subbasins Resolved Through: Small Works Project ID No. a Location Problem Description Potential Solution CK block of 96th Hydraulic analysis predicted that the Improve roadside ditch in front of Street East roadside ditch in front of 8400 block of 8400 block of 96th Street East 96th Street East is unable to convey the 25-year event without overtopping. PH block of 127th Road flooding Install catch basin. Small Works PH-12 PH-17 PH-20 PH-21 RD-1 RD-2 RD-4 RD-5 RD-6 RD-10 RD-12 RD-14 RD-16 a Street East block of 112th Avenue East and block of 136th Avenue East Cascade Park and Firgrove subdivision block of 83rd Avenue East block of 103rd Avenue Ct. East 7700 and 7800 block of Golden Givens Rd East Coventry Court Apartment on 10th Avenue Ct. 9th Avenue E and 75th Street East 7200 block of 12th Avenue East 12th Avenue E, just south of 80th Street East 2100 block of 72nd Street East 2200 block of 80th Street East 8700 and 8800 block of Portland Avenue East 2100 block of 91st Street East See Figure 6-3 for problem location. Roadway runoff is causing property flooding. Roadway and property flooding reported in subdivision due to obstructed roadside ditch and culvert system. Private detention pond overflowing Install berm and inlet structure to direct runoff to storm drain system. Install storm drain system or clean out and maintain existing ditch and roadside culvert system. Project Small Works Project Small Works Project Require detention pond owner to Enforcement maintain of repair pond. Dry well is under capacity. Provide additional drywells. Small Works Project Stormwater ponding on the road Small Works shoulder and in front of driveway. Project Detention pond may be undersized or has a clogged outlet. Pond has been reported to overflow into the apartment yards. Storm drain system is undersized and cause property flooding. Road and property flooding due to absence of drainage system. A roadside ditch to the north of the house flows south to the house but has no outlet. Road flooding due to obstructed roadway ditch and culvert system. Install a new catch basin at low point of depression and connect to storm drain system located approximately 100 feet north. Inspect outlet structure. Provide additional capacity if pond analysis shows pond is undersized. Replace existing storm drain system with larger diameter pipe. Install storm drain system on 12th Avenue E and connect to system on 72nd Street E. Regrade ditch on 12th Avenue East and reset cross culvert inverts on 12th Avenue East and 80th Street East. Install flanking catch basin(s) Road flooding due to lack of grate inlet capacity in a sag. around existing sag catch basin. The roadside ditch has an adverse Regrade ditch to provide positive slope causing road and property drainage to Roosevelt Ditch. flooding. Roadway flooding due to depressions in the road. Roadway runoff is causing property flooding. Install a catch basin at depression and connect to Portland Avenue storm drain system. Install inlet catch basin. Maintenance Small Works Project Small Works Project Small Works Project Small Works Project Small Works Project Small Works Project Small Works Project Pierce County Public Works & Utilities
194 STORMWATER DRAINAGE & FLOODING Project Number Swan Creek Sub-Basin CIP03-SW-AC01 TABLE 6-12 Flooding and Drainage CIP Projects Project Name 112th Street East Floodplain Storage/Wetland Preservation Project Solves Problem CIP03-SW-CR01 80th Street East Culvert Replacement Project SW-1 CIP03-SW-PL01 84th Street East Pipeline Storm drain Replacement Project SW-4 CIP03-SW-SBS01 a Stream bank Stabilization at 72nd Street East Outfall SW-3 CIP03-SW-SBS03 a Stream bank Stabilization at 64 th Street East Outfall SW-23 Squally Creek Sub-Basin No Drainage Projects Clear Creek Sub-Basin CIP03-CL-VC01 104th Street East Riparian Area Enhancement Project CL-4 CIP03-CL-CR01 88th Street East Culvert Replacement Project CL-5 Canyon Creek Sub-Basin CIP03-CY-DP02 90th Street East Detention Project CY-1 CIP03-CY-RD01 116th Street East Roadway Improvement Project - West Fork CY-3 CIP03-CY-SL01 58th Avenue East Property Acquisition Project with Setback Levee CY-5 CIP03-CY-RD02 104th Street East Roadway Improvement and Culvert Replacement Problem - East Fork CY-10 CIP-03-CY-AC01 Property Acquisition at 5600 block of 104th Street East CY-30 CIP-03-CL-AC02 Canyon Creek Floodplain Repetitive Loss Land Acquisition CY-33 Rody Creek Sub-Basin CIP03-RY-SBS02 a Stream bank Stabilization Project at 80th Street East RY-3 CIP03-RY-SWL01 62nd Avenue East Drainage Swale Project RY-5 CIP03-RY-CR01 Pipeline Road and 96th Street East Culvert Replacement Project RY-7 CIP03-RY-CR02 98th Street East Culvert Replacement Project RY-8 CIP03-RY-DP01 Rody Creek Regional Detention Facility Expansion RY-7 RY-8 Diru Creek Sub-Basin No Drainage Projects Woodland Creek Sub-Basin CIP03-WO-CR01 72nd Avenue E Culvert Replacement Project - 93rd Street East to 96th Street East WO-6 CIP03-WO-CR02 a 80th Street East Culvert Replacement Project WO-8 CIP03-WO-DP01 Woodland Avenue Flood Control Phase II CIP WO-2 Pierce County Public Works & Utilities
195 STORMWATER DRAINAGE & FLOODING Project Number Clarks Creek Sub-Basin TABLE 6-12 Flooding and Drainage CIP Projects Project Name Solves Problem CIP03-CK-AC01 Property Acquisition at 9200 Block of 104th Street East CK-2 CIP03-CK-PL01 CIP03-CK-PL02 Potholes Sub-Basin 112th Street East Drainage Improvement Project (Woodland Elementary School) Fruitland Avenue Drainage Improvement Project - 104th Street East to 96th Street East CK-9 CK-10 CIP03-PH-IP th Street East Infiltration Pond PH-1 CIP03-PH-PL01 92nd Avenue East Storm Drain Improvement Project PH-6 CIP03-PH-PL02 156th Street East Regional Drainage Improvements PH-15 CIP03-PH-PL03 136th Street East Pipeline (D ) PH-18 CIP03-PH-PL04 144th and 94th Avenue East Pipeline (D ) PH-14 PH-15 PH-18 CIP03-PH-PL05 Springfield Pothole Pipeline Project (D ) PH-23 CIP03-PH-PL06 South Hill Pump Station Discharge Pipeline Roosevelt Ditch Sub-Basin CIP03-RD-DIV01 85th Street East Diversion RD-13 RD-15 CIP03-RD-DP01 Portland Avenue East Regional Detention Facility RD-7 CIP03-RD-RD01 90th Street East Roadway Improvement RD-17 CIP03-RD-SWL01 20th Avenue East Drainage Swale RD-11 a. Also listed as an Aquatic Habitat CIP project (See Table 8-7). Pierce County Public Works & Utilities
196 WATER QUALITY ANALYSIS CHAPTER SEVEN Water Quality Analysis 7.1 Introduction Chapter Seven analyzes the water quality information and problems described in Chapter Four, Existing Conditions; Chapter Five, Identification of Problems; and problems uncovered during the Phase 2 habitat field investigations documented in Chapter Eight. This chapter begins with a review of water quality problems, followed by a description of existing water quality facilities. It then describes a watershed assessment and treatment model used to establish alternative responses successful in other parts of the United States. It identifies the programs and activities of other agencies that bear on treatment alternatives. The chapter concludes by recommending solutions to the problems. Solutions range from enhanced water quality monitoring to gain a better understanding of water quality conditions in the Clear/Clarks Creek Basin, to capital improvement projects focused on improving water quality. 7.2 Water Quality Problems Review Significant water quality problems exist in the Basin including: High levels of fecal coliform bacteria: Swan Creek, Clear Creek, and Clarks Creek are on the State s (d) list of impaired water bodies due to fecal coliform levels. Fecal coliform is an indicator of pathogens. The Clarks Creek TMDL used microbial source tracking to determine the sources of fecal coliform in the Clarks Creek system and found that humans are not the primary source. High nutrient loading (nitrogen and phosphorus): Although the current water quality standards do not contain maximum levels of nitrogen and phosphorus, the State has adopted nutrient standards and is waiting for EPA approval. High nutrient levels lead to the growth of invasive vegetation including algae growth. As the vegetation decomposes, it uses oxygen, which depletes the supply for fish and other aquatic life. High nutrient levels can also increase acidity (ph). When oxygen is stripped from carbon dioxide, carbonic acid is produced. Clarks Creek is also on the Washington 303(d) list for ph. Excessive sediment (turbidity and suspended solids): Erosion within open channels and streams is a chronic problem of urban stormwater, especially where land development is occurring. Eroded soil clouds stream water. Then where the stream slows, soil particles precipitate to the channel bottom, covering spawning gravels, taking up flood storage capacity, and providing a medium for algae and invasive vegetation. Pierce County Public Works & Utilities 7-1
197 WATER QUALITY ANALYSIS Remaining water quality concerns were primarily associated with odor complaints, low summertime flows in creeks, erosion and sedimentation, elevated water temperatures, and dumping of garbage into or near streams. Table 7.1 lists the water quality concerns reported by citizens, County staff, and the project consultant, CH2M Hill. Table 7-1. Water Quality Problems Problem ID Location Description Swan Creek SW-17 Swan Creek at 80 th Street East Trash dumped into creek channel SW-18 Swan Creek north of 64th Street E Reach on 303d list for fecal coliform SW-19 Upper Swan Creek On the 303d list for fecal coliform levels SW-20 Waller Road East at 92 nd Street East Trash dumped into creek SW-21 Swan Creek at 72 nd Street East Downstream erosion SW-22 SW-23 SW-25 SW-26 Swan Creek from 72nd Street East to 64th Street East Swan Creek downstream of 64th Street East Downstream of 64th Street East Downstream of Burlington Northern Santa Fe Railroad Channel erosion is occurring downstream of 72nd Street East to 64th Street East due to high stream flow. Exposed vertical banks are 2 to 3 feet high. High stream flows have scoured a four to five-foot hole at the 64th Street East culvert outlet and undermined the culvert headwall and apron. The channel is eroding in the 8,000-foot reach downstream of 64th Street East due to high stream flow. Exposed vertical banks are 10 to 12 foot high. Channel down cutting is occurring downstream of railroad culvert due to high stream flow. SW-27 Upstream of 64th Street East Intermittent flow occurs in late summer SW-35 Downstream of Pioneer Way East Sediment in channel SW-36 Swan Creek Excessive nutrients SW-37 Swan Creek Low dissolved oxygen/ High ph SQ-3 Squally Creek Squally Creek at 48 th Street East Trash in the creek from dumping into the creek SQ-4 Clear Creek confluence Eroding banks and sedimentation occurs where Squally Creek flows into Clear Creek. SQ-6 Pioneer Way East Invasive riparian vegetation in and along the creek SQ-8 Throughout stream system No water quality data exists Pierce County Public Works & Utilities 7-2
198 WATER QUALITY ANALYSIS CL-8 Clear Creek 4500 block of 112th Street East Dumping garbage in drainage ditch CL-14 CL-15 CL-16 CL-17 CL-18 CL-21 CL-22 CL-23 Clear Creek from 104 th Street East to Vickery Avenue East 4500 Block at Pioneer Way East Clear Creek below Pioneer Way East Clear Creek from Pioneer Way East to the Puyallup River. Pioneer Way E to Gay Road East Clear Creek between Pioneer Way East and 45th Street East Downstream of 64th Street East West Fork of Clear Creek at 72nd Street East Trash in creek channel On the County s Dirty Dozen list as a junk/wrecking yard, plus several occupied recreational vehicles and a large amount of solid waste cover the site Reach is on the 303d list due to fecal coliform levels. Erosion upstream has caused sedimentation in channel from Pioneer Way East to the Puyallup River Invasive aquatic vegetation present in the reach extending from Pioneer Way to Gay Road East Stream bank erosion and minor slides The stream bank is eroding and the channel down cutting. Intermittent flow occurs upstream of this location CL-24 Pioneer Way to Gay Road East The natural channel has been straightened in this reach. The riparian buffer has been significantly reduced. CY-15 CY-17 CY-18 CY-20 CY-21 CY-22 CY-23 Canyon Creek 46th Avenue E and 58th Avenue East block of 58th Avenue East Canyon Creek at 80 th Street East. Upstream of second Canyon Road crossing. Downstream of second Canyon Road crossing Downstream of 72nd Street East Clear Creek confluence to Pioneer Way East. Septic odors present at Quiet Ridge subdivision retention pond. Report of failing septic system Stream bank is eroding. Stream bank is eroding Stream bank is eroding and channel down cutting with 10-foot-high exposed banks in 1,000-foot reach downstream of second Canyon Road crossing due to high stream flow Channel is down cutting Upstream erosion has caused sedimentation in channel from Clear Creek confluence to Pioneer Way East. CY-24 72nd Street East Intermittent flow occurs upstream of this location. CY-25 Clear Creek confluence to Pioneer Way East Invasive aquatic vegetation is pervasive in the channel. Pierce County Public Works & Utilities 7-3
199 WATER QUALITY ANALYSIS Rody Creek RY-3 80th Street East Stream bank is eroding. RY-8 98th Street East Road and property flooding of Rody Creek at 98th Street East. According to property owner, th Street East, flooding occurs annually due to clogging of the inlet by debris. Water backs up and causes flooding of property and septic tanks. Flooding also reported upstream in the block of 98th St East and the block of 61 st Ave East (possible reduction with recent maintenance project). The 1991 Plan identified this culvert as insufficient conveyance capacity. RY-15 84th Street East Intermittent flow occurs upstream of this point. RY-16 Clarks Creek to Pioneer Way East Diru Creek DU-9 Whole stream Water quality DU-10 DU-11 Clarks Creek confluence to Pioneer Way East Downstream of 72nd Street East The natural channel has been straightened with the buffer reduced. Invasive riparian vegetation also is present. Invasive riparian vegetation is present in the 2,200- foot reach from the mouth to Pioneer Way East. Stream bank is eroding in the 100 foot-long reach downstream of 72nd Street East. Exposed vertical banks are 8-feet-high. DU-12 84th Street East Intermittent flow occurs upstream of this location DU-13 WO-1 Clarks Creek confluence to Pioneer Way East Woodland Creek Woodland Creek at 84 th Street East The natural channel has been straightened and the buffer reduced in 2,200-foot reach from Clarks Creek confluence to Pioneer Way East Bank erosion, channel down cutting downstream of 80th Street East due to high stream flow. Three foot deep channel incision. Reduced riparian buffer WO-23 Upstream of Pioneer Way East Invasive riparian vegetation is present in this reach. WO-24 84th Street East Scour (erosion) is occurring at culvert outlet. WO-25 Downstream of 84th Street East Channel is down cutting downstream of 84th Street East due to high stream flow. Channel incision is 5- feet-deep. WO-26 Upstream of 80th Street East Upstream erosion has caused sedimentation in channel. WO-27 Downstream of 80th Street East. Stream bank erosion and channel down cutting downstream of 80th Street East due to high stream flow. Three foot deep channel incision. Reduced riparian buffer. WO-28 84th Street East Intermittent flow occurs upstream of this location. WO-29 Clarks Creek confluence to Pioneer Way East The natural channel has been straightened and the buffer reduced. Pierce County Public Works & Utilities 7-4
200 WATER QUALITY ANALYSIS Clarks Creek CK-11 Tacoma Road Septic systems reported as failing. CK-12 Clarks Creek On 303d list due to fecal coliform levels and ph levels CK-13 CK-14 Puyallup River confluence to Puyallup City Limits Puyallup River to Puyallup City Limits Invasive aquatic vegetation in channel Upstream erosion has caused sedimentation in channel. CK-15 Creek at 99th Street East Stream banks are eroding. CK-21 Clarks Creek Excessive nutrients. Connected to CK-13, invasive vegetation and CK-12, ph standard exceeded. Potholes PH-23 Throughout drainage area No water quality data exists Roosevelt Ditch RD-8 Throughout drainage area No water quality data exists Existing Stormwater Treatment Facilities The Clear/Clarks Creek Basin contains 75 ponds: 37 detention facilities; 22 infiltration facilities; one sedimentation pond; and one water quality pond. The majority of ponds serve individual developments. Pre-1997 stormwater drainage systems for developments were designed to handle flow without water quality treatment features. Ponds are larger so suspended solids have more time to precipitate before stormwater is discharged into the regional conveyance system. Pierce County Water Programs usually designs regional ponds with a presettling basin or other features that remove suspended sediments from the water before it is released from the pond. Sand filters have been used at infiltration ponds. Catch basins in the stormwater conveyance system have chambers that collect sediment. Sediment is periodically removed. Vegetation in drainage ditches also aids in removing sediment by slowing movement of the water in a way that enables suspended solids to settle. Water quality can/should be addressed in the design of upgrades to existing facilities and in new construction Water Quality Facilities in Private Development In 1992, Ecology developed the Stormwater Management Manual for Puget Sound (1992 Stormwater Management Manual) in response to a directive of the Puget Sound Water Quality Management Plan (Ecology, 1992) to address stormwater issues described in the federal National Pollutant Discharge Elimination System, Phase I rules. The 1992 stormwater manual included water quality treatment standards in the form of structural Best Management Practices (BMPs). It called for government agencies to require water quality treatment of stormwater discharges from new and redevelopment projects that create additional impervious surfaces. The manual listed an array of structural BMPs along with design guidelines. Because structural BMP treatment systems (i.e., wet ponds, wet vaults, and bioswales) are typically designed to achieve 80% removal of total suspended solids, an objective of 80% removal was set. Pierce County Public Works & Utilities 7-5
201 WATER QUALITY ANALYSIS Monitoring Data No sampling data was available for Roosevelt Ditch, Squally Creek, Canyon Creek, Woodland Creek, or the Potholes drainage area. Lacking results from systematic water quality sampling, Pierce County must rely on data from sporadic sampling, one-time sampling, shifting sampling points, and other methods that are not statistically reliable. Adequate water quality is critical to the protection of beneficial uses, including salmonid. When water quality is found to not meet standards, monitoring of various chemical and biological parameters in streams helps in the discovery of pollution sources and aids in developing effective remedies Temperature The data indicate general compliance with temperature standards throughout the Basin. Mean temperature values and individual sample values were below the standard of 18 degrees centigrade. All of the sampling locations are in the Puyallup River Valley reaches of the streams, where anadromous fish reside. Low stream temperatures are probably due to the groundwater contributions to stream flow that occur in the canyon and valley reaches of the streams. Groundwater recharge within the aquifers catchment area that maintains the groundwater contributions to stream flow will be important to protect water temperature. A second major influence is tree cover along streams so streams remain shaded Dissolved Oxygen Mean dissolved oxygen concentrations in samples were generally well above the State standard of 8 mg/l; ranging from a low of mg/l in Rody Creek, to a high of 12.3 mg/l at the mouth of Swan Creek. A few individual samples for Swan Creek and Clarks Creek also did not meet the standard. Much of the excess biological oxygen demand comes from rotting aquatic and herbaceous invasive vegetation that has filled stream channels where riparian vegetation has been removed Nutrients Nutrients, measured by nitrate, nitrite, and total phosphorus concentrations, are not regulated under Washington s current water quality standards. However, high nutrient levels in surface water can result in excessive aquatic plant growth, eutrophication, and (as aquatic plants and algae decay) depressed dissolved oxygen levels (EPA, 1993). The mean nutrient concentrations shown in Table 7-3 range from 0.1 mg/l to 0.26 mg/l for total phosphorus, and 0.53 mg/l for nitrate+nitrite. The federal Environmental Protection Agency s (EPA) Technical Guidance Manual for rivers and streams (EPA-822-B ) published in 2000, states that in general streams should contain less than 21.8 ug/l (0.218 mg/l) of total phosphorus and 0.38 mg/l of total nitrogen. Values appear to be moderately high in the Basin, although they are consistent with concentrations found in similar developed basins of the region (Minton, 2002). The moderately high nutrient concentrations do not appear to be significantly affecting the dissolved oxygen concentrations. For example, only 5% of the Swan Creek samples exceeded State standards for dissolved oxygen; 8% of the Clarks Creek samples exceeded standards. However, as the Basin Pierce County Public Works & Utilities 7-6
202 WATER QUALITY ANALYSIS develops further, nutrient concentrations are likely to increase unless preventive measures are undertaken. Nutrients are probably one of the contributing factors for the excessive growth of aquatic plants in the lower reaches of the streams Fecal Coliform Fecal Coliform bacteria concentrations for most the streams sampled did not meet the water quality standard. Swan Creek, Clear Creek, and Clarks Creek are on the State s current (1998) 303(d) list. The listings were based on a limited number of samples and the data are highly sporadic. These factors tend to skew the statistics. Some of the high fecal coliform values may reflect a storm event. Fecal coliform concentrations can temporarily increase by several orders of magnitude in urban stormwater runoff (EPA, 1993). Fecal coliform bacteria are present in large numbers in the feces and intestinal tracts of humans and other warm-blooded animals, and can enter water bodies from human and animal waste. Fecal coliform are indicator organisms, which means they signal the presence of other pathogenic bacteria and are associated with the presence of viruses or other types of pathogens. Swimming in waters with high levels of fecal coliform bacteria increases the chance of developing illness (fever, nausea or stomach cramps) from pathogens entering the body through the mouth, nose, ears, or cuts in the skin. Diseases and illnesses that can be contracted in water with high fecal coliform counts include typhoid fever, hepatitis, gastroenteritis, dysentery, and ear infections Turbidity and Suspended Solids Swan Creek and Diru Creek had mean turbidity values of 28 and 22 Nephelometric Turbidity Units (NTUs), respectively. In this region, values in excess of 10 NTUs represent cloudy conditions and indicate the presence of silt or sediment. Field studies performed for this plan identified excessive sediment buildup in lower Swan Creek, Woodland Creek, Clear Creek, and Canyon Creek. Sediment deposits are evidence of turbid conditions in the past. The deposits also contribute to turbidity during later storm events as faster water and new current directions pick up sediments and transport them further downstream. High concentrations of suspended solids (measured as Total Suspended Solids, TSS) can cause many problems for stream health and aquatic life. Suspended solids can block light from reaching submerged vegetation. As the amount of light passing through water is reduced, photosynthesis slows down. Reduced rates of photosynthesis causes less dissolved oxygen to be released into the water by plants. If light is completely blocked from bottom dwelling plants, the plants will stop producing oxygen and will die. As the plants are decomposed, bacteria will use up more oxygen from the water. Low dissolved oxygen can result in fish kills. High suspended solids can also cause an increase in surface water temperature, because the suspended particles absorb heat from sunlight. Higher water temperatures can cause dissolved oxygen levels to fall even further (because warmer waters can hold less DO), and can harm aquatic life in many other ways (Mitchell and Stapp, 1992). High total suspended solids in a water body can often mean higher concentrations of bacteria, nutrients, pesticides, and metals in the water. These pollutants may attach to sediment particles on the land and be carried into water bodies with storm water. In the water, the pollutants may be released from the sediment or travel farther downstream (Federal Interagency Stream Restoration Working Group, 1998). Pierce County Public Works & Utilities 7-7
203 WATER QUALITY ANALYSIS ph ph values have been generally good across the Basin, with a few exceptions. Low values detected in Diru Creek could be due to process water from the fish hatchery. The sampling location was immediately downstream of the hatchery. Clarks Creek is on the 303(d) list for ph, as is its tributary Meeker Ditch in the City of Puyallup. The Clarks Creek listing was prompted by three samples taken in 1996; two of which were slightly below the minimum of 6.5. A more recent study ( ) involved 12 rounds of monitoring at five locations on the creek over a 15-month period. Results include three samples with ph slightly below 6.5; two of which occurred during a very large (25-50 year recurrence) on October 21, None of the Clarks Creek samples exceeded the State maximum ph of 8.5. Based on these results, ph does not appear to be a problem in Clarks Creek at present. ph measures the acidity or alkalinity of water and other solutions. It is presented on a scale from zero to 14. A ph of 7 is neutral. PH values of 0 7 indicate acidity, and values from 7 to 14 indicate alkalinity. A solution with a ph value of 7 is neutral; a solution with a ph value less than 7 is acidic; a solution with a ph value greater than 7 is basic. Natural waters usually have a ph between 6 and 9. The scale is negatively logarithmic, so each whole number (reading downward) is ten times the preceding one (for example, ph 5.5 is 100 times as acidic as ph 7.5). The ph of natural waters can be made acidic or basic by human activities such as heavy automobile traffic. Drainage water from forests and marshes is often slightly acidic, due to the presence of organic acids produced by decaying vegetation. Very high (greater than 9.5) or very low (less than 4.5) ph values are unsuitable for most aquatic organisms. Young fish and immature stages of aquatic insects are extremely sensitive to ph levels below 5 and may die at these low ph values. High ph levels (9-14) can harm fish by denaturing cellular membranes. Changes in ph can also affect aquatic life indirectly by altering other aspects of water chemistry. Low ph levels accelerate the release of metals from rocks or sediments in the stream. These metals can affect a fish s metabolism and the fish s ability to take water in through the gills, and can kill fish fry Sediment Severe erosion occurring in the stream channels is causing siltation of the streambeds in the lower reaches. The buildup of sediment in the lower reaches is due primarily to scour of banks and transport of particles downstream during storm events, or due to pollutant wash off of impervious surfaces, and construction sites with inadequate erosion and sedimentation controls. Sediment accumulations are a significant problem in the valley reaches of all of the creeks. Eroded material from incising stream channels and sediment loads from land clearing, grading, and construction projects deposits in the valleys. The sediment removes the capacity of stream channels to handle stormwater and the capacity of floodplains to store excess runoff. Sediment provides a medium for invasive aquatic plants. Sediment buries food needed by aquatic life. Pierce County Public Works & Utilities 7-8
204 WATER QUALITY ANALYSIS Excessive Growth of Invasive Aquatic Vegetation Excessive growth of invasive vegetation occurs in the lower reaches of Clear Creek and Clarks Creek. Both the complaints database and the habitat field surveys identified the excessive growth of invasive aquatic vegetation such as elodea, reed canary grass, and milfoil in the lower, slow moving reaches of the creeks. Two factors in combination contribute to the excessive growth. The large sediment loads in the streams enriches water with nutrients. Additionally, the reaches receive an overabundance of sunlight because property owners have removed much of the streamside trees and shrubs that provide shade. Excessive vegetation can reduce fish passage and the hydraulic capacity of the stream, contribute to flooding problems, and create an oxygen demanding during plant die-off and decay. See Chapter Eight for additional discussion of this problem. 7.3 Watershed Analysis The analysis of water quality and identification of treatment options for the Clear/Clarks Creek Basin uses two methods. The first method uses the Watershed Treatment Model (WTM) developed by the Center for Watershed Protection under an EPA grant. The model is a simple spreadsheet-based general water quality treatment model that Water Programs staff ran for the Clear Creek Basin and the Clarks Creek Basin. The model factors land use, sources of non-point pollution, the amount of impervious surfaces, the availability of sanitary sewer systems, and other existing information about a basin to identify effective water quality management practices. The second method consists of finding the source of the water quality problems, be it dumping, loss of tree canopy over streams, or down cutting of stream channels with increasing stormwater peaks flows, etc. For each water quality problem, the analysis identifies factors bearing on future conditions and considers the future condition likely given the development regulations currently in effect, planned growth, and stormwater flows forecast from the results of hydrologic and hydraulic model runs. From this analysis, needs for water quality facilities or programmatic actions were determined Watershed Treatment Model The Watershed Treatment Model predicts the mass loading or concentration of certain pollutants found in stormwater based on existing and future land use conditions. The model can also be used to rapidly assess and quantify the general effectiveness of various watershed treatment options to reduce water pollution. Because it is a simple model, it only tracks sediments, nitrogen, phosphorus and bacteria. However, these pollutants are the most significant indicators in water quality in a watershed. The advantage of using this model lies in its ability to compare treatment options and their relative effectiveness in reducing the quantity of pollutants in surface water. Estimates used in the model are based on certain principles and simple algorithms. Pierce County Public Works & Utilities 7-9
205 WATER QUALITY ANALYSIS The model has two basic components: Pollution Sources Component. The pollutant sources component looks at the watershed s pollutant load without treatment measures in place. It takes into account land uses, primary source pollutants (pollutants that enter the water directly from various sources, secondary source pollutants (pollutants formed when primary pollutants react with each other or with other compounds present), and the common loading these factors produce. Treatment Options Component. The treatment options component uses simplified assumptions to determine how various treatment measures will reduce the uncontrolled load. The model uses a total of 20 different treatment options to evaluate potential pollutant load reductions. These options range from education programs to the treatment of point sources Model Development The model consists of inputs such as the existence of sanitary sewer overflows and whether connections of household wastewater to storm drains occur within the drainage area being analyzed. Clear Creek and Clarks Creek water quality, land use, environmental practices, existing governmental or non-profit agency programs, and similar information was entered into the model. Much of the data used in the model was obtained from the County s Geographic Information System (GIS), supplemented with data provided by various County, city, and tribal employees. Where GIS or other data were not available, the experience and expertise of County staff were used; for example, the existence of sanitary sewer overflows in the basins or whether connections of household wastewater to storm drains have been reported Model Results Existing Loads Table 7-2 presents the estimates of existing primary and secondary pollutant loadings for urban and rural lands and associated land uses given the characteristics of the Basin. It lists estimated loadings for total nitrogen, total phosphorus, total suspended solids, and fecal coliform for both rural and urban sources and shows the larger sources in the Basin. Results suggest that the secondary sources in rural areas account for less than 1% of the total pollutant loading and, therefore, are not significant. In urban areas, the model indicates that the greatest contributors to overall pollutant loadings are channel erosion, active construction, urban land use and illicit connections. Illegal (illicit) connections are non-stormwater discharges to the storm system, such as wash water and direct connections of household wastewater. Note that vacant lots are parcels without a building value and not categorized as forest or agriculture rather than an undeveloped plot of land. Pierce County Public Works & Utilities
206 WATER QUALITY ANALYSIS Table 7.2 Predicted Existing Loads for Clear and Clarks Creek basins From Watershed Treatment Model Area (acres) Total Nitrogen (lb/year) Total Phosphorus (lb/year) Total Suspended Solids (TSS) Fecal Coliform (billion colonies/year) URBAN SOURCES Urban Land 10,565 70,516 11,983 1,687, ,465 Active Construction 645 8,318 2,994 1,663,611 0 SSOs ,018 CSOs Illicit Connections 0 1, , ,288 Channel Erosion , ,607,779 0 Marinas Road Sanding ,397 0 Point Sources 0 5,762 1, ,049 0 Vacant Lots 2,577 9,019 1, ,700 67,002 RURAL SOURCES Rural Land 830 3, ,000 32,370 Forest ,000 4,080 Livestock Open Water 121 1, ,755 0 TOTAL LOAD 101,081 23,599 6,571, ,224 Storm Load 63,815 21,021 6,368, ,634 Non-Storm Load 37,266 2, , ,590 Source: Pierce County Water Programs Results approximate actual water quality data. The model somewhat underestimates loadings for nitrogen, phosphorus, and total suspended solids and overestimates loading for fecal coliform. A number of reasons exist for differences between model estimates and water quality samples results. Actual sampling data is limited and tends to be biased to excursions above water quality standards. Actual sample data may not represent the median annual pollutant concentration. Fecal coliform monitoring typically has a high variability. Additionally, although the model operates with specific information about the Clear/ Clarks Creeks Basin, the model is not specifically calibrated for the Basin and cannot be expected to reproduce actual in-stream loads unless supplemented by more complex models. Pierce County Public Works & Utilities
207 WATER QUALITY ANALYSIS Table 7-3. Comparison of Data with Results of the Watershed Treatment Model Avg Clear/Clarks Water Quality Data Converted Data Model Results Nitrogen 1.6 mg/l 271,683 lb/year 101,081 lb/year Phosphorus 0.2 mg/l 33,124 lb/year 23,599 lb/year TSS 37.3 mg/l 9,552,426 lb/year 6, lb/year Fecal Coliform 600 col/100ml 460,368 Source: Pierce County Water Programs billion colonies/year 702,223 billion col/year Exist ing load proje ction s form the basis for the next step. The model contains a set of watershed treatment options and estimates of the amount of nitrogen, phosphorus, total suspended solids, and fecal coliform loads that each treatment option removes from the watershed. According to the model, the most effective overall watershed treatment option is Erosion and Sediment Control particularly at lowering total suspended solids and phosphorus loadings. The most effective treatment option for removing nitrogen would be a Lawn Care Education Program. For lowering fecal coliform levels, an On-Site Septic System Education Program was the most effective Analysis of the Results Table 7-4 lists the total net benefit from each management practice for Clear Creek. Table 7-5, Watershed Treatment Model Net Benefit of Future Management Practices for Clarks Creek Basin, lists the load reductions for each management practice considered by the model. Pierce County Public Works & Utilities
208 WATER QUALITY ANALYSIS Table 7-4 Predicted Load Reduction Benefits of Future Management Practices Clear Creek Basin Fecal Pollutant Nitrogen (Rank) Phosphorus (Rank) TSS (Rank) Coliform Units (lbs/year) (lbs/year) (lbs/year) (billion/year) Lawn Care Education 2471 (1) 49 (7) 0 (16) 0 (11) 10 Pet Waste Education 194 (7) 25 (10) 0 (16) 1689 (5) 12 Erosion and Sediment Control 970 (2) 349 (2) (2) 0 (11) 1 Street Sweeping 262 (5) 70 (4) (4) 0 (11) 3 Street Sweeping - Sanding 0 (17) 0 (17) 77 (14) 0 (11) 17 Impervious Cover Disconnection 21 (13) 2 (14) 267 (11) 81 (9) 14 Structural Stormwater Management Practices 122 (9) 106 (3) 6757 (6) 611 (6) 3 Riparian Buffers 5 (14) 0 (15) 470 (10) 0 (11) 15 Catch Basin Cleanouts 216 (6) 54 (6) (3) 0 (11) 6 Marina Pumpouts 0 (17) 0 (17) 0 (16) 0 (11) 18 Septic System Education 378 (4) 29 (9) 1163 (8) (1) 2 Land Reclamation 0 (17) 0 (17) 0 (16) 0 (11) 18 Impervious Cover Reduction 28 (12) 8 (11) 1066 (9) 101 (8) 13 Stormwater Retrofits 96 (10) 32 (8) 8117 (5) 169 (7) 9 Illicit Connection Removal 146 (8) 63 (5) 1224 (7) (4) 3 CSO Repair/ Abatement 0 (17) 0 (17) 0 (16) 0 (11) 18 SSO Repair/ Abatement 0 (16) 0 (16) 0 (15) 20 (10) 16 Septic System Inspection/Repair 73 (11) 6 (12) 224 (12) (2) 11 Septic System Upgrade 445 (3) 6 (12) 224 (12) (2) 8 Channel Protection 2 (15) 471 (1) (1) 0 (11) 7 Point Source Reduction 0 (17) 0 (17) 0 (16) 0 (11) 18 Total Reduction (Rank) Sum Rank Pierce County Public Works & Utilities
209 WATER QUALITY ANALYSIS Table 7-4 Predicted Load Reduction Benefit of Future Management Practices Clarks Creek Basin Fecal Pollutant Nitrogen (Rank) Phosphorus (Rank) TSS (Rank) Coliform (Rank) Sum Rank Units (lbs/year) (lbs/year) (lbs/year) (billion/year) Lawn Care Education 6272 (1) 125 (7) 0 (15) 0 (11) 10 Pet Waste Education 1015 (5) 132 (6) 0 (15) 8822 (6) 7 Erosion and Sediment Control 1194 (3) 430 (1) (1) 0 (11) 2 Street Sweeping 879 (6) 234 (3) (5) 0 (11) 6 Street Sweeping - Sanding 0 (17) 0 (17) 0 (15) 0 (11) 17 Impervious Cover Disconnection 35 (12) 2 (15) 282 (12) 76 (9) 15 Structural Stormwater Management Practices 439 (9) 252 (2) (3) 1300 (7) 3 Riparian Buffers 19 (13) 2 (14) 2150 (8) 0 (11) 13 Catch Basin Cleanouts 54 (11) 16 (11) 999 (10) 0 (11) 12 Marina Pumpouts 0 (17) 0 (17) 0 (15) 0 (11) 17 Septic System Education 1975 (2) 152 (5) 6076 (6) (1) 1 Land Reclamation 0 (17) 0 (17) 0 (15) 0 (11) 17 Impervious Cover Reduction 3 (15) 1 (16) 113 (13) 10 (10) 16 Stormwater Retrofits 530 (8) 188 (4) (2) 953 (8) 5 Illicit Connection Removal 156 (10) 58 (10) 1242 (9) (4) 8 CSO Repair/ Abatement 0 (17) 0 (17) 0 (15) 0 (11) 17 SSO Repair/ Abatement 15 (14) 2 (13) 97 (14) (5) 13 Septic System Inspection/Repair 1111 (4) 85 (8) 3418 (7) (2) 3 Septic System Upgrade 756 (7) 9 (12) 380 (11) (3) 8 Channel Protection 0 (16) 78 (9) (4) 0 (11) 11 Point Source Reduction Total Reduction Future Conditions Upcoming Projects Several projects are underway or in development that are designed to have a positive effect on water quality in the Clear/Clarks Creek Basin. The projects range from habitat improvements to flood control projects, but they will also improve water quality. Port of Tacoma Clear Creek Habitat Area. The Port of Tacoma is currently constructing Phase 2 of their Clear Creek Habitat Project. This project is designed to enhance and restore salmon habitat at the site and mitigate for habitat that was lost as part of implementing the Sitcum/Blair/Milwaukee Waterway Cleanup Project. The 11-acre site is located at the mouth of Clear Creek. Pierce County Public Works & Utilities
210 WATER QUALITY ANALYSIS Swan and Clarks Creek were channelized long ago in the s. It appears that the Port of Tacoma s newly created wetland incorporates much of the land that Clear and Swan Creeks once meandered through. Once isolated ponds are now connected to Clarks Creek by a weir and an expansive pond system. This system is fed by ground water and water from these ponds. In addition, the wetland is filled twice daily by tidally influenced waters that cause Puyallup River water to flow into Clarks Creek. A variety of trees big-leaf maple, dogwood, hazelnut, red alder, vine maple and western red cedar shade and cool the water for fish and offer nesting places for hundreds of birds. Ducks make their homes among wetland and riparian vegetation (Port of Tacoma: An Environmental Report April 2003). The Port constructed an outlet channel, tidal mudflat refuge bay, bridge, and sluice gate at the mouth of Clear Creek to ensure that water flows freely into the constructed pond/wetland complex. Now salmon have access to nearly ten miles of streams and creeks (Port of Tacoma: An Environmental Report April 2003). Two sluice gates are located where Clear Creek enters the Puyallup River that are shut when the Puyallup River floods. The gates prevent the river floodwater from flowing up Clear Creek during a large storm event. One gate is manual and operated by Drainage District #10, the other gate was replaced by the Port of Tacoma as part of the wetlands habitat project and is electronically controlled. Neighbors upstream of the project reported faster relief of high waters during significant storm events in the 1999 and 2000 seasons. The Port of Tacoma does not currently participate in any water quality monitoring; however, they do monitor the salmon that utilize the wetland. The Port also tracks the health of the vegetation and monitors the wetted perimeter of the wetland (Site visit, 10/16/2003). City of Puyallup Silver Creek Restoration. The City of Puyallup, in cooperation with the Western Washington Fair Association, is restoring Silver Creek. Silver Creek emerges from a spring on South Hill and flows in open ditches and pipelines to Meeker Ditch. The restoration project will replace undersized culverts and considerable length of pipeline to more natural stream channel on land acquired by the City. The site for the newly restored creek is currently the Silver lot at the Puyallup Fair, which is how the creek got its name. In addition to the new creek bed, a constructed wetland will be created next to the creek. The City of Puyallup expects this project to improve the quality of water flowing into Meeker Ditch, a major tributary of Clarks Creek Future Land Use The Pierce County Comprehensive Plan continues development in the Clear/Clarks Creek Basin. 41% of the Basin (considering the basin including the cities) is designated Rural ; 59% of the basin is designated Urban. Part of the area designated Rural has been subdivided to lots less than one-half acre in size that will probably be developed. These characteristics bear on the amount of impervious surfaces likely created during the life of this plan. The effective impervious area is expected to increase as the intensity of land use increases. In the Clear Creek drainage area, the impervious area will increase from 19% to 23%. The impervious area in Clarks Creek drainage area is forecast to increase from 25% to 35% and Pierce County Public Works & Utilities
211 WATER QUALITY ANALYSIS the Potholes drainage area is expected to increase from 27% to 45% impervious area. The development envisioned is likely to have substantial effects on the character of stormwater runoff and water quality in the creeks. 7.5 Programmatic Recommendations Programmatic recommendations are nonstructural actions for solving stormwater drainage problems. Generally they are broad in applicability, having basin-wide or County-wide benefit. Site development regulations are a type of programmatic action, enforcement of temporary erosion and sedimentation control requirements is another type. Programmatic actions suggest ways of solving stormwater drainage problems by modifying how people do things, when and where. Ideally, programmatic actions maximize public investment in structural facilities and floodplain acquisition. This section identifies the programmatic actions most likely to have a significant positive effect on water quality. The recommended actions derive from the Watershed Treatment Model and from knowledge of practices that have proven effective for other local governments, Washington State agencies, and private interests Water Quality Monitoring Plan Two types of monitoring are proposed. Both would enable tracking how well the implementation of recommendations in this Basin Plan have stabilized or improved water quality. The first involves tracking of the implementation of programmatic recommendations of this basin plan (i.e.; retrofits, land acquisitions, educational components). The second type of monitoring involves a quantitative analysis of instream water quality. A strategic water quality-monitoring plan would be designed to measure water quality and quantity of flow in a way that data can be used to indicate the success of recommended solutions/interventions. Typically, it takes 20 years of data to develop a meaningful understanding of the hydrologic variables of a stream system. A TMDL for fecal coliform bacteria has been developed for the Clarks Creek Subbasin. The Clarks Creek action plan sets up specific pollution reduction goals. For the Clarks Creek Subbasin streams, Swan Creek, and Clear Creek (stream reaches on the States 303 (d) list of impaired water bodies) a more advanced water quality model capable of probabilistic analysis should be used to develop a specific monitoring plan(s). A minimum monitoring plan should be developed to quantify existing baseline water quality and track pollutant loading reductions as the result of implementation of recommendations of this plan. As part of the initial analysis for the Basin Plan, three flow gauges and temperature monitoring stations were established on Clear Creek, Canyon Creek, and Swan Creek. In addition, Pierce County Water Programs and the USGS have been operating a flow monitoring station on Clarks Pierce County Public Works & Utilities
212 WATER QUALITY ANALYSIS Creek for a number of years. Operation of these flow and temperature stations should be continued indefinitely and be augmented by similar gauges on other streams in the basin planning area Adopt Updated Stormwater Management Standards In 2002, Ecology adopted a new Stormwater Management Manual for Western Washington (Ecology Manual). Terms of the County s Stormwater NPDES Permit require the County to control the quality of stormwater discharged to rivers, streams, marine waters, and groundwater. Programs to control runoff water quality must include minimum requirements and best management practices equivalent to those found in the Ecology Manual. To comply with the County s NPDES Permit, the County must analyze the Pierce County Stormwater Management and Site Development Manual, 1999 (County Manual) for consistency with the Ecology Manual, must revise the County Manual to achieve equivalency, and must formally adopt the revisions. Application of the revisions has potential to reduce the need for construction of public stormwater treatment facilities or reduce their size Invasive Species Management Program Pierce County spends approximately $40-60,000 per year to maintain vegetation in the lower reaches of Clarks Creek alone. An invasive species management program would provide a longer-term solution that is more effective at reducing problem vegetation than use of herbicides. The management program would involve the removal of invasive species and the planting of native vegetation in its place. The program would include monitoring the vegetation planted to ensure its survival and prevent the invasive plants species from returning. When native plants are established, they will provide shade for habitat, create stable stream banks, and out-compete invasive vegetation. Water quality benefits will include higher dissolved oxygen, balanced ph, and lower water temperatures. An Invasive Species Management Program would ultimately shift the costs of invasive vegetation removal to maintaining the healthy riparian vegetation that keeps the invasive species in check. Invasive vegetation removal, while important, is labor intensive, typically requires the use of herbicides, and it is a continuing expense unless long-range objectives are established to reduce or remedy the conditions on which invasive vegetation thrives Floodplain/Riparian Corridor Land Management The 1991 Pierce County Storm Drainage and Surface Water Management Plan (1991 Plan) recommended the acquisition of floodplain lands important as habitat, open space, recreation, or floodwaters storage or conveyance. Policies of the 1991 Plan and the County Comprehensive Plan state that non-structural alternatives are preferable to traditional structural solutions. In response to these directions, Water Programs began to acquire land as part of a strategy for flood control and for mitigating the adverse environmental effects of storm drainage practices. In some cases, acquisition consisted of purchasing development rights. In other cases, such as Pierce County Public Works & Utilities
213 WATER QUALITY ANALYSIS when federal grant funds were used, fee simple purchase was required to protect the public investments and adequately maintain the property. Riparian buffers within both stream systems in the Basin have been largely destroyed. Riparian cover exists in the canyon reaches of the streams, but otherwise the stream cover was replaced by agricultural fields, residential lawns and landscaping, roads, etc. Intact riparian areas buffer streams by filtering out sediment and other pollutants in runoff, limiting access to streams by waterfowl, moderating temperature fluctuations (providing shade), provide for floodwater storage, and generally protecting water quality. One of the principles of the Watershed Treatment Model says that every stream mile of riparian corridor with 50-foot deep buffers on both sides of a stream can reduce loading by 18 pounds of nitrogen, 1.1 pounds of phosphorus, and 471 pounds of sediment annually. Acquisition of riparian corridors through purchase or conservation easements should be a priority. Wetlands areas in the pothole area should also be protected and managed thru a combination of purchase and conservation easements. Doing so will preserve the water cleansing functions of wetlands and protect groundwater quality. Groundwater is used for human consumption and is an important source of cool base flow for the streams of the Clear/Clarks Creek Basin and other adjacent basin (Mid-Puyallup Basin and Clover Creek Basin) Stormwater Structure Retrofits Stormwater structure retrofits are structural Best Management Practices implemented after a development or stormwater facility has been constructed. Because of site constraints after development has occurred, retrofits are often smaller than treatment facilities in new developments. Developments built before the adoption of stormwater site development regulations in 1996 will typically be the most likely candidates for retrofit. Retrofits tend to be expensive to construct and to maintain. In the event that non-structural solutions do not bring about sufficient improvements in (or protection of) water quality, stormwater facility retrofits should be considered. The first step in developing a program for retrofits will be to conduct an inventory of existing stormwater structures and rank them for retrofit potential. To minimize need to retrofit additional stormwater facilities, design of new stormwater facilities should incorporate water quality components Street Sweeping Conduct a systems analysis of the County s street sweeping program in collaboration with the Pierce County Public Works and Utilities, Transportation Maintenance Division to identify costeffective ways of augmenting street sweeping in areas where stormwater quality is adversely affected by road runoff. Include an analysis of the benefit of funding certain street sweeping program expansions with storm drainage and surface water management funds. Street sweeping is an effective way of reducing the concentration value of total suspended solids, nitrogen, and phosphorus from road Pierce County Public Works & Utilities
214 WATER QUALITY ANALYSIS runoff. (See Table 7-3 and 7-4 for the load reduction and effectiveness rank in the Clear Creek and Clarks Creek basins.) The ability of street sweeping to reduce the concentration value of pollutants is primarily limited by the type of equipment used, the frequency of sweeping being performed, and the road type Education Programs Public education programs may help to reduce the concentrations of nutrients, sediments and bacteria in to the streams by making people aware of the consequences of the choices they make. They suggest new ways of doing things that contribute to nonpoint pollution and offer new ways of thinking about these activities. Public participation, with each person doing his/her part, is a crucial aspect of improving water quality, especially in reducing nonpoint pollution. Approximately 50% of the Basin is residential area, so educating homeowners and residents could have a significant effect on reducing nonpoint pollution-based water quality problems, such as nutrient loading and fecal coliform bacteria. Success of education programs depends on the media chosen for distributing the message and the intensity of effort. Some of the various media types in order of their effectiveness are: television, radio, newspapers, billboards, brochures/pamphlets, and public meetings. In a voluntary program, some fraction of people will be unwilling to change their behavior. However, the degree of participation is influenced by the intensity of the education effort. Intensity of effort is a function of the number of educational media employed, the variety of images or illustrations used to convey the message, and how often the message is repeated. Pet Waste Program. Pet waste can contribute bacteria, pathogens and nutrients to ground and surface water. Educational programs that address nonpolluting ways of disposing of pet waste can be an effective way of reducing these pollutants. The goal of a pet waste program is to change the behavior of pet owners so they properly dispose of their pets waste. The Watershed Treatment Model estimated potential load reductions for the Clarks Creek subbasin using two media types as follows: Media Type Nitrogen reduction (lbs/year) Phosphorus reduction (lbs/year) Sediment reduction (lbs/year) Fecal coliform reduction (billion colonies/year) Brochure ,764 Television Ad 1, ,822 Pierce County Public Works & Utilities
215 WATER QUALITY ANALYSIS Lawn Care Program. Excessive fertilizer application can contribute nutrients (nitrogen and phosphorus) to surface and ground water. Educational programs that address proper lawn care can help to reduce these pollutants in groundwater and streams. The goal of a lawn care program would be to eliminate all of the excess fertilizer applied to turf. Potential load reductions for the Clarks Creek Sub-basin according to the Watershed Treatment Model, using two media types are as follows: Media Type Nitrogen reduction (lbs/year) Phosphorus reduction (lbs/year) Sediment reduction (lbs/year) Fecal coliform reduction (billion colonies/year) Brochure 1, Television Ad 6, On-Site Sewer Systems Program. The Tacoma-Pierce County Health Department (TPCHD) has an existing education program for on-site sewer system maintenance that use workshops and printed material. TPCHD gives information on the proper use and care of on-site sewer systems to people when they apply for a new on-site sewer system permit or repair. Free classes are offered to interested people through the Washington On-Site Sewage Association (WOSSA) and are taught by WOSSA members. They are offered at two locations, Puyallup and Purdy. Workshops in the Key Peninsula area are reported to have good turnouts probably due to the inclusion of workshop announcements in Peninsula Light power bills. Improper on-site sewer system operation and maintenance can contribute bacteria, other pathogens, and nutrient pollution to receiving waters. Educational programs that address proper on-site sewer system operation can be an effective tool to reduce the discharge of these pollutants. The Watershed Treatment Model estimated the following potential load reductions for the Clarks Creek Basin using two media types as follows: Media Type Nitrogen reduction (lbs/year) Phosphorus reduction (lbs/year) Sediment reduction (lbs/year) Fecal coliform reduction (billion colonies/year) Brochure , ,467 Television Ad 1, ,075 3,792,339 Pierce County Public Works & Utilities
216 WATER QUALITY ANALYSIS Structural Stormwater Management Practices Structural Stormwater Management Practices refers to an agency s commitment to integrating water quality related design features into the design of stormwater facilities, public and private. It includes programs for regular inspection of public and private stormwater treatment related facilities. Stormwater treatment efficiencies decline without property maintenance. A thorough investigation of relevant factors, policy guidelines, and alternatives should be undertaken to evaluate the County s existing programs and recommend cost-effective solutions. 7.6 Site-Specific Water Quality Recommendations This section describes the site specific water quality problems in the Clear/Clarks Creek Basin. The section is ordered from west to east as follows: Roosevelt Ditch Drainage Area Clear Creek Basin Swan Creek Squally Creek Clear Creek Canyon Creek Clarks Creek Basin Rody Creek Diru Creek Woodland Creek Clears Creek Potholes Drainage Area Roosevelt Ditch Drainage Area Problem Description: RD-18 No water quality data exists for the Roosevelt Ditch drainage area. This precludes a water quality assessment. Although there are speculations about particular sites and sources of nonpoint pollution, no data exists to support or refute the hypotheses. Recommendation: Incorporate Roosevelt Ditch into the water quality monitoring plan. Sample the ditch to document baseline information on the water quality, including flow volumes. The data obtained can be evaluated to determine the degree to which water quality problems exist. Then alternative solutions to address water quality can be identified. Problem Description: RD-19 According to the Water Programs Maintenance Division, sediments accumulate in Roosevelt Ditch. Pierce County Public Works & Utilities
217 WATER QUALITY ANALYSIS Recommendation: A potential CIP project may alleviate erosion on Roosevelt Ditch. An alternative is to expand the natural detention storage area located next to Portland Avenue between 80 th Street E and the Shopping Center. Expanding the storage area by an additional 8 acre-feet would help prevent flooding and water quality concerns associated with high flows such as erosion Clear Creek Basin Swan Creek Subbasin Problem Descriptions: SW-18 and SW-19 Swan Creek is listed on the 1998 and (d) lists for fecal coliform bacteria. The compacted till soil and absence of pore spaces between soil particles prevent wastewater from percolating through the soil. Recommendation: Prepare a strategic monitoring plan for fecal coliform in Swan Creek. Further monitoring is necessary to determine when high levels of fecal matter are present in the stream and identify patterns in their occurrence. Maintenance of on-site sewer systems is very important to keep systems operating property. An educational program for homeowners on maintaining their on-site sewer systems is one part of the solution to the fecal contamination problem. Tacoma-Pierce County Health Department regulates on-site sewer systems and also offers educational programs. Failing on-site sewer systems part of the solution to the fecal problem. To further the goal of repairing on-site sewer systems, the Tacoma-Pierce County Health Department implemented an on-site sewer maintenance program County-wide. However, the cost of repairing or replacing an on-site sewer system can be a financial burden that dissuades homeowners from repairs. A program to assist homeowners with the cost of repair or replacement of failing on-site sewer systems should be investigated. Problem Description: SW-3, SW-22, SW-23, SW-24, SW-25, SW-26, SW-35 Sediment is a serious problem in Swan Creek below Pioneer Way East. Sediments increase turbidity, reduce aquatic organisms survival rates, and fill stream bottoms, increasing the chances of flooding and weed growth. The draft results of the Limiting Factors Analysis of the Ecosystem Diagnosis and Treatment (EDT) Model for Pierce County lists erosion as the factor most limiting salmonid habitat in Swan Creek. Evidence of erosion includes a severely incised channel downstream of 64 th Street East with ten-to-twelve-foot vertical stream banks and an undermined culvert inlet at 64 th Street East. Recommendation: Eliminate the sources of sediments as much as possible. (a) Enforce use of Best Management Practices to control erosion at public and private construction sites. (b) Reduce the volume, velocity, and duration of peak flows by storing stormwater in detention facilities as ponds or wetlands and metering discharges to Swan Creek. Eight (80)-acre feet of detention storage and the purchase of a wetland for preservation adjacent to Swan Creek will reduce peak flows as the sub-basin s land use changes. (c) Stabilize stream banks and restore riparian corridor vegetation through a combination of bio-stabilization and armoring techniques. Pierce County Public Works & Utilities
218 WATER QUALITY ANALYSIS Problem Description: SW-36 Excess nutrients are present in Swan Creek. Nutrients are naturally present in water; however, when nutrient levels increase, they stimulate growth of aquatic vegetation. Nitrogen and phosphorus levels are present in the groundwater, a major source of base flow to the streams in the Clear/Clarks Basin. Other nutrient sources include human and animal wastes, soil erosion and fertilizers. Recommendation: Alternatives discussed above to address fecal contamination and sedimentation would also lower potential nutrient sources. Further investigation of the sources of nitrogen and phosphorus in the ground water. Problem Description: SW-37 Dissolved oxygen (DO) and ph were measured below acceptable levels on a few occasions on Swan Creek. The occurrences were probably a result of the other problems listed above. ph levels tend to decrease when rapid aquatic vegetation growth occurs. Levels of DO tend to fall when there is an excess of organic materials in the stream system; as the organic materials decay, they consume oxygen, depleting the oxygen supply. Sources of organic materials include on-site sewer effluent, urban runoff, aquatic vegetation, and agriculture runoff. Recommendation: Addressing the sedimentation problem and the high nutrient loadings may prevent the ph from dropping to an acidic level below the states criterion. Dissolved oxygen levels will improve as nutrient levels drop and invasive aquatic vegetation is brought under control. The alternatives discussed above to reduce sediment and fecal coliform bacteria should also improve conditions and reduce DO and ph problems. Pierce County Public Works & Utilities
219 WATER QUALITY ANALYSIS Squally Creek Subbasin Problem Description: SQ-6 Invasive species are present in Squally Creek above Pioneer Way. Recommendation: Remove invasive the reed canary grass and nightshade and restore native vegetation along this reach of the stream. Implement an invasive species management program to keep the invasives in control until native riparian trees and plants are established. Problem Description: SQ-7 Squally Creek detention pond was designed for a 25-year storm so it does not have capacity for peak flows from larger events. The creek channel downstream of the detention pond is incising. Recommendation: Expand the pond to handle a 100-year flood and include certain water quality features such as providing shade to control water temperatures and features that limit the number of birds attracted to the pond. Problem Description: SQ-8 No water quality water quality data was found for Squally Creek. Recommendation: Incorporate Squally Creek into the water quality monitoring plan so there is data to assess whether the stream meets the State water quality standards and identify water quality problems Clear Creek Problem Description: CL-16 Clear Creek is on the state 303(d) list of impaired water bodies due to the presence of fecal coliform bacteria levels in excess of state standards. Fecal coliform bacteria are an indicator of pathogens. Decomposition of fecal waste can also lower dissolved oxygen levels in the water, which harms aquatic life. Recommendation: Incorporate Clear Creek into the monitoring plan to be tested regularly for fecal coliform. Determine the sources of fecal contamination. Incorporate Clear Creek into the water quality monitoring plan to be tested regularly for fecal coliform to determine if fecal contamination is a seasonal problem or if high values only occur after storm events. Perform microbial source tracking analysis to determine the sources of the fecal bacteria. If the main source is human waste, the solution should focus on the repair failing on-site septic systems. If the problem is pet waste, a program to encourage responsible pet owner behavior would be implemented. Pierce County Public Works & Utilities
220 WATER QUALITY ANALYSIS Problem Description: CL-17, 18, 19, 20, 21, 22, 33 Erosion over time is a natural process. However, the rate of down cutting has increased due to increased runoff in the basin, particularly peak storm flows. Many of the areas where down cutting has occurred are associated with undersized culverts. The high flows forced into an inadequately sized culvert increase the water velocity in the culvert. This powerful flow then causes erosion and down cutting below the culvert. Recommendation: Replace the undersized culverts to slow the rate of channel incision and streambank instability. Undersized culverts are located at 88 th Street East and at Gay Road East. To ease the high flows that contribute to down cutting, construct a detention pond/wetland to store stormwater. Rebuilding streams beds to have more sinuosity will also decrease the velocity of high flows. Canyon Creek Subbasin Problem Description: Water quality data is very limited for Canyon Creek. Recommendation: Incorporate Canyon Creek into a water quality monitoring plan. Use the data collected to determine if there are additional water quality concerns for Canyon Creek. Problem Description: CY-18, CY-19, CY-20, CY-21, CY-22, CY-23 Excessive down cutting occurs on Canyon Creek with sediment from the erosion accumulating in the Puyallup Valley. During storm events, peak flows scour around undersized culverts and create high velocity flows that increase incising of the channel at the culvert outlet. Recommendation: (1) Replace undersized culverts at 84 th Street East, 88 th Street East, 104 th Street East, 112 th Street East, and 116 th Street East to alleviate the scour around existing culverts. (2) Undertake the stream stabilization projects for Canyon Creek such as installing weirs and drop structures. Stabilization projects are needed downstream of 80 th Street East, downstream of 72 nd Street East, upstream of Canyon Road East, and downstream of Canyon Road East Clarks Creek Basin Rody Creek Problem Description: RY-19 Microbial Source Tracking for Rody Creek was undertaken as part of the TMDL study for Clarks Creek as described in Chapter Four. According to tracking results, the greatest contributors to fecal contamination are birds (29%), rodents (29%), canines (21%), and humans (13%). Recommendations: Decrease the primary sources of fecal material to lower the nutrient loading and fecal contamination in Rody Creek. Address bird and rodent contamination by planting native vegetation along the riparian corridor. Doing so deters waterfowl from over using the Pierce County Public Works & Utilities
221 WATER QUALITY ANALYSIS stream and should lower the concentration of fecal matter from bird populations. Lower the amount of fecal coliform bacteria from rodents by implementing a strong rodent-control program. Rodent control starts with public education, followed by community action in the form of litter and rubbish pick up. A public education programmatic measure should include the subjects of rodent control, pet waste disposal, and effective maintenance of on-site sewer systems. Add Rody Creek to the water quality-monitoring program for the basin. Problem Description: RY-14 Like the other streams in the Clear/Clarks Creek Basin, Rody Creek is experiencing erosion and down cutting. The erosion leads to sediment accumulation in low gradient reaches of the stream, especially downstream of Pioneer Way East. Recommendation: Construction of a detention pond will help to reduce down cutting on Rody Creek. Detention facilities are designed to decrease peak flows by providing storage of stormwater and gradually release the stormwater to minimize erosive energy of the water. Replace the undersized culverts and install streambank stabilization projects to reduce the down cutting. All three alternatives are listed under recommended capital improvement projects. Diru Creek Subbasin Problem Description: DU-9 Microbial Source Tracking for Diru Creek was undertaken as part of the TMDL study for the Clarks Creek TMDL for fecal contamination as described in Chapter Four. According to tracking results, the greatest contributors of fecal coliform bacteria in Diru Creek are rodents (38%), unknown (38%), and canines/dogs (12%). No reported human fecal contamination was reported on Diru Creek unlike other subbasins discussed in the chapter. Recommendation: Further investigation of the unknown factor in fecal coliform bacteria counts will be needed to identify the unknown sources and enable an effective response. Lower the amount of fecal coliform bacteria from rodents by implementing a strong rodent-control program. Rodent control starts with public education, followed by community action in the form of litter and rubbish pick up. The public education measures for this drainage area should include how to control rodents and dispose of pet waste. Problem Description: DU-10, DU-11 Diru Creek streambanks are eroding in a 100-foot long reach downstream of 72 nd Street East. Exposed vertical banks are eight feet high. The culvert that conveys Diru Creek under 72 nd Street East is perched three feet above the stream bank. The resulting sediment provides a medium for invasive riparian vegetation that occurs in a 2,200-foot reach from the confluence with Clarks Creek to Pioneer Way East. Recommendation: Undertake the streambank/channel stabilization project at 72 nd Street East as recommended in Chapter Eight. Problem Description: DU-12 Diru Creek flows intermittently upstream of 84 th Street East. Pierce County Public Works & Utilities
222 WATER QUALITY ANALYSIS Recommendation: Monitor the volume of flow in the reach above 84 th Street East over time to determine whether the intermittent flow is correlated with development in the basin and identify a rate of change. Woodland Creek Subbasin Problem Description: WO-30 According to the Microbial Source Tracking performed for Woodland Creek as part of the Clarks Creek fecal coliform study, the largest contributors of fecal material in Woodland Creek are birds (52%), canines (26%), humans and rodents (both 11%). Recommendations: Address bird and rodent contamination by replanting native vegetation and reestablishing the riparian corridor where it is missing. Doing so will deter waterfowl from over using the stream and lower the amount of fecal matter in the stream from birds. Lower the amount of fecal coliform bacteria from rodents by implementing a strong rodent-control program. Rodent control starts with public education, followed by community action in the form of litter and rubbish pick up. A public education programmatic measure should include the subjects of rodent control, pet waste disposal, and effective operation and maintenance of on-site sewer systems. Add Woodland Creek to the water quality-monitoring program for the basin so the extent of any contribution to the Clarks Creek fecal contamination problem is known. Problem Description: WO-23 Sedimentation is a problem on Woodland Creek upstream of Pioneer Way East and upstream of 80 th Street east. The sediment comes from channel erosion upstream of these locations. Sediment impairs water quality by providing a medium for invasive vegetation, clouding water as it is held in suspension before being deposited. When the invasive plants die, they consume oxygen needed for other aquatic life. Recommendation: Stream restoration between Pioneer Way East and Clarks Creek would improve the water quality of the stream by providing shade, stream meanders, planting of riparian vegetation, removing invasive vegetation, and widening the floodplain. Erosion control is the most effective means of reducing the amount of sediment that accumulates. Implement the CIP projects related to stream and channel stabilization. Problem Description: WO-24, WO-25, WO-26 Out of all the creeks in the Clear/Clarks basin, channel incising is most severe on Woodland Creek. The most severe erosion was found at 84 th Street East. These are sources of sediment that are a problem in the Puyallup Valley reaches of the creek. Recommendation: Projects to replace culverts and stabilize stream banks would help to ease this problem. Culvert replacements are needed from 93 rd Street East to 96 th Street East, at 72 nd Street East and 80 th Street East. Streambank stabilization such as porous weirs and drop structures at 84 th and 80 th Streets East would help to direct the energy of flowing water to the center of the stream rather than the eroding streambanks. Pierce County Public Works & Utilities
223 WATER QUALITY ANALYSIS Clarks Creek Problem Description: CK-12 Clarks Creek is listed on the State s 303(d) list for fecal coliform bacteria. Microbial Source Tracking results reported that 44% of the fecal material in a sample at 56 th Street East came from birds. DeCoursey Park is an attractive resting spot for migrating birds. Long reaches of Clarks Creek have lawns extending down to the stream bank or pastures extend up to the stream channel that attracts birds. Other sources of fecal material listed were canines (13%), unknown (13%), and felines (9%). Sewage, raw sewage, and humans combined were (12%). See Chapter Four, Figure Recommendation: The single most effective way of reducing the fecal contributions from birds is to restore a riparian corridor and plant native plants along the water s edge. Geese and other waterfowl do not land in an area where they cannot easily access the land or see possible predators. Help pet owners dispose of pet waste in a sanitary way through an education program that targets homeowners and places where people frequently walk their dogs. The City of Puyallup posts signs and distributes waste disposal bags at the parks in the City. Implement the public education programmatic measure. Tailor program offerings in the Clarks Creek Basin to emphasize stewardship of riparian areas, proper disposal of pet waste, and the care and feeding of on-site sewer systems. Problem Description: CK-21 Clarks Creek is also on the State 303(d) list for ph. Clarks Creek is overly acidic, a condition brought about by excess nutrients. Three major sources of nutrients have been postulated. (a) The first is the groundwater sources of base flow for Clarks Creek. (b) The second is the WDFW Puyallup Hatchery. (c) The third is the decay of aquatic vegetation. (a) Perennial flow in Clarks Creek starts where groundwater from Maplewood Springs joins the creek. The spring is artesian and rises from an aquifer that is typically high in nitrate-nitrite nitrogen (2.03ug/L NO 2+3 -N measured at Maplewood Springs from , (KCM, 1996)). Another large spring rises between the dam for the hatchery pond and the confluence of the WDFW hatchery outfall to Clarks Creek. At times, when the hatchery has essentially dewatered the spring, there is still a cubic feet per second flow at the outfall (Michael, personal communication, 2003). No sampling has occurred to determine the source or composition of this water, but it is presumed to be another spring. (b) The WDFW Puyallup Hatchery operates under a NPDES hatchery permit issued by the Washington State Department of Ecology. It has been identified as a source of nutrients to Clarks Creek (KCM 1993, 1996). It is located just below Maplewood Springs in the City of Puyallup. The hatchery site includes a constructed intake pond to provide the hatchery with water. The intake pond has acted as a sedimentation pond for flows coming from the upper drainage area (South Hill), with the consequence that it is full of sediment. Department of Fish and Wildlife representatives stated that the pond has only been cleaned out one time in recent years and that the permitting issues related to cleaning it out again or on a regular basis are prohibitive. This is potentially an area where the County could help by referring this site to the Pierce County Public Works & Utilities
224 WATER QUALITY ANALYSIS Washington Department of Ecology, which is responsible for ensuring compliance with the hatchery NPDES permit. Wastes from the rearing process are transported to settling ponds on the lower hatchery site, where the solids are quiescently settled out, and the water discharged back to the creek. These ponds were previously used as rearing ponds, and some incidental trout do get vacuumed out of the rearing area and make it to the settling ponds. Fish and Wildlife staff indicates that creating artificial wetlands in this area of the hatchery would probably be very beneficial in removing nutrients and polishing the water that is then released back into the creek. A current paper (Michael, 2003) details the success of a constructed wetland at the Issaquah Hatchery. Medications such as antibiotics, formalin, and potassium permanganate are used in hatchery operations. Because source water for the Puyallup hatchery originates at a spring with no anadromous fish, this facility probably uses less of these compounds than hatcheries that take rearing water from a stream. Most of the compounds could be attenuated by wetlands before reaching the creek. (c) The sediments passing through and nutrients from the fish hatchery coupled with long open reaches of the creek that are missing riparian vegetation ads to the growth of invasive aquatic vegetation. The decay of vegetation depletes the creek of dissolved oxygen and changes its ph Potholes Drainage Areas Problem Description: No water quality data exists for the Potholes drainage area. Water quality data will be instrumental in securing the necessary permits to construct the recommended pipeline from Hemlock Pond to the Puyallup River in the Mid-Puyallup Basin. Recommendation: Include Hemlock Pond in the water quality-monitoring program. Pierce County Public Works & Utilities
225 STREAM HABITAT AND RIPARIAN AREAS CHAPTER EIGHT Stream Habitat and Riparian Areas Analysis This chapter documents the habitat analysis and summarizes potential solutions to improve and restore habitat conditions in the future. The aquatic habitat analysis performed for the Clear/Clarks Creek Basin was primarily qualitative. Qualitative factors considered in the analysis included barriers to fish passage, increased peak stream flow rates and availability of perennial streamflows in the basin, streambank erosion and instability, and other conditions that adversely affect aquatic habitat conditions. The aquatic habitat analysis of the Clear/Clarks Creek Basin included an assessment of stream reaches using the Urban Stream Baseline Evaluation Method (USBEM) (R2 Resource Consultants, 1999). The USBEM contains a rating table for characterizing habitat into good, fair, and poor categories. These categories are used in the project prioritization process presented in Chapter Nine. Chapter 4 documented the extent of degraded riparian and aquatic habitat in the Clear/Clarks Creek Basin. Appendix E documents the habitat field investigation conducted for this study. There are a number of interrelated causes for loss of salmonid habitat. 8.1 Summary of Aquatic Habitat Field Investigation The USBEM in the Tri-County Urban Issues Study was used to classify salmon habitat quality in the Clear/Clarks Creek Basin. The analysis was a two-phase process consisting of a preclassification screening phase and a field observation phase. Phase I prescreening was performed as part of basin characterization as documented in Chapter Four. Phase II, field observation, provided a quantitative assessment of habitat characteristics including riparian condition, substrate composition, embeddedness (presence of fine sediments), bank condition, passage barriers, pool frequency, channel pattern and bedform, and large woody debris (LWD). In addition to field habitat assessment, local residents were interviewed for information on fish use, habitat alteration, land use, water flow fluctuation, and any other factor that might influence habitat condition. Selection of the appropriate recovery options for the species of concern used the results from the USBEM analysis. Table 8-1 summarizes the USBEM habitat evaluation for each planning unit (subbasin) in the Clear/Clarks Creek Basin. Appendix E documents the USBEM analysis. Pierce County Public Works & Utilities 8-1
226 STREAM HABITAT AND RIPARIAN AREAS Subbasin Study Reach a TABLE 8-1 USBEM Phase II Habitat Condition Assessment Subbasin Location USBEM Rating Swan Creek A SW-1 Confluence with Clear Creek to BNSF Railroad Poor Swan Creek B SW-1 BNSF Railroad to Pioneer Way Fair Swan Creek C SW-1 Pioneer Way to 41st Street E Fair Swan Creek D SW-2 41st Street E to 48th Street E Fair Swan Creek E SW-2 48th Street E to 1500' upstream of 48th Street E Good Swan Creek F SW-2 Approx. 1500' upstream of 48th Street E to 64th Street E Squally Creek A SQ-1 Pioneer Way to 48th Street E Poor Clear Creek A CL-1 River Road to 100' upstream of confluence with Swan Creek Clear Creek B CL-2 Gay Road to 300' downstream of BNSF Railroad Poor Clear Creek C CL-2 300' downstream of BNSF Railroad Poor Clear Creek D CL-2 BNSF Railroad to Pioneer Way Fair Clear Creek E1 CL ' upstream of Pioneer Way to 49th Street E Poor Clear Creek E2 CL-4 49th Street E to 60th Street E Poor Clear Creek F CL-5 CL-6 60th Street E to 765' upstream of 72nd Street E Canyon Creek A CY-1 Confluence with Clear Creek to 44th Street E Poor Canyon Creek B CY-1 44th Street E to 52nd Street E Poor Canyon Creek C CY-1 600' reach downstream of Pioneer Road Poor Canyon Creek D1 CY-2 Pioneer Road to first Canyon Road crossing Poor Canyon Creek D2 CY ' Reach upstream of first Canyon Road crossing Poor Canyon Creek D3 CY-2 650' reach downstream of second Canyon Road crossing Canyon Creek E CY-2 500' reach upstream of second Canyon Road crossing Canyon Creek F CY ' reach downstream of 72nd Street E Poor Canyon Creek G CY-3 72nd Street E to 80th Street E Poor Rody Creek A RY-1 Stewart Road to Pioneer Road Poor Diru Creek A DU-1 72nd Street E to 78th Street extended Fair Woodland Creek Woodland Creek A WO-1 Pioneer Way to 80th Street E Fair Poor Poor Poor Poor Poor B WO-2 150' reach upstream of 80th Street E Poor Pierce County Public Works & Utilities 8-2
227 STREAM HABITAT AND RIPARIAN AREAS Subbasin Woodland Creek Woodland Creek Study Reach a TABLE 8-1 USBEM Phase II Habitat Condition Assessment Subbasin Location USBEM Rating C WO-2 900' reach downstream of 84th Street E Poor D2 WO ' reach upstream of 84th Street E Poor Clarks Creek A CK-2 W end Tacoma Road to 7th Avenue E Poor Clarks Creek B CK-3 7th Avenue E to 15th Avenue E Fair Clarks Creek C CK-3 150' upstream of 15th Avenue E Fair a See Figure F-1 in Appendix E 8.2 Limiting Factors Limiting factors to fish production were characterized from the results of the USBEM Phase II analysis. Table 8-2 shows the limiting factors in relative order of importance for each of the creeks in the Clear/Clarks Creek Basin. The table shows that low base flow, channel size, and erosion are the most important limiting factors in all streams but Clarks Creek. This table also shows that the benthic invertebrate community and water temperature are generally the least important limiting factors. Section 8.3 presents a comprehensive discussion of the limiting factors is in the Basin. Pierce County Public Works & Utilities 8-3
228 STREAM HABITAT AND RIPARIAN AREAS ANALYSIS DRAFT TABLE 8-2 Limiting Factors a in the Clear/Clarks Creek Basin Limiting Factors Stream Most Limiting Least Limiting Swan Creek Erosion LWD Low Flow Pool Frequency Bank Condition Channel Size Substrate Composition Benthic Inv. Comm. Water Temp. Passage Barriers Riparian Condition Squally Creek Low Flow Channel Size Erosion Substrate Composition Pool Frequency LWD Bank Condition Riparian Condition Passage Barriers Benthic Inv. Comm. Water Temp. Clear Creek b Erosion Passage Barriers Low Flow LWD Substrate Composition Pool Frequency Bank Condition Channel Size Riparian Condition Water Temp. Canyon Creek Low Flow Channel Size Erosion LWD Pool Frequency Substrate Composition Bank Condition Benthic Inv. Comm. Passage Barriers Riparian Condition Water Temp. Rody Creek Low Flow Channel Size Erosion Pool Frequency LWD Substrate Composition Bank Condition Benthic Inv. Comm. Riparian Condition Passage Barriers Water Temp. Diru Creek Low Flow Channel Size Erosion Bank Condition Pool Frequency LWD Substrate Composition Benthic Inv. Comm. Riparian Condition Passage Barriers Water Temp. Woodland Creek a Low Flow Channel Size Erosion Bank Condition LWD Substrate Composition Pool Frequency Riparian Condition Passage Barriers Water Temp. Clarks Creek Pool Frequency LWD Bank Condition Riparian Condition Substrate Composition Benthic Inv. Comm. Passage Barriers Water Temp. Channel Size Low Flow Erosion a Limiting factors from USBEM analysis, see Appendix E b Only 10 limiting factors assessed. B-IBI sampling not performed in this reach so the condition of the benthic invertebrate community is not known. Pierce County Public Works & Utilities 8-4
229 STREAM HABITAT AND RIPARIAN AREAS ANALYSIS DRAFT 8.3 Existing Aquatic Habitat Problems Fish Passage Barriers Maintaining fish passage is particularly important for salmonids. During migration periods to and from the ocean, salmonids frequently encounter instream manmade blockages such as culverts and diversion weirs, or natural barriers, such as beaver dams or overly steepened channels (i.e., cascades). Culvert openings too high above the stream channel for fish to jump into, and culverts too long or positioned at a grade too steep for fish to ascend, can be barriers to fish migration. Fish passage barriers are present in all streams of the Clear/Clarks Creek Basin. All streams in the Basin have total blockages at street crossings at the upstream ends of their canyon reaches. Blockages are present at: 64th Street East for Swan Creek 58th Street East for Squally Creek 72nd Street East for Clear, Rody, and Diru Creeks 84th Street East for Woodland Creek 96th Street East for Clarks Creek Partial blockage at Pioneer Way East on Rody Creek. A dam just upstream of the WDFW hatchery on Clarks Creek at Maplewood Springs is a total barrier. The dam, which impounds water for use at the hatchery, is approximately ten feet high and does not have a fish ladder. A weir structure on Clear Creek just above Pioneer Way East, operated by Trout Lodge, forms a barrier to salmon migration. According to the WDFW area habitat biologist, the Trout Lodge hatchery has operated the weir under permit from the State since the 1930s. Fish passage barriers were identified during the field investigation and from the Pierce Conservation District (PCD) database. Field observation and the hydrologic analysis showed that most of the creeks run dry during the summer months. For this reason, the fish passage analysis for culverts was limited to the lower canyon and floodplain areas where year-round base flow is present. Culverts were assessed during the field investigation using the WDFW Level A Criteria (WDFW, 2000). Tables 4-23, 5-1 and 5-2 list the locations of barriers to fish passage in the Clear/Clarks Creek Basin. Location of the barriers to fish passage identified during Phase I are shown on Figures 5-1 and 5-2. A Level B analysis was performed using the culvert analysis model HY-8 on publicly owned culverts with barrier status of unknown but with known fish use. Table 8-3 presents the results of the Level B analysis. The table reports that the culverts at Clear Creek and Pioneer Way East, Clear Creek and Gay Road East, and Rody Creek at Pioneer Way East are not barriers to fish passage. However, the velocity of Woodland Creek through a culvert on the Washington State University (WSU) Experimental Farm is a barrier. Pierce County Public Works & Utilities 8-5
230 STREAM HABITAT AND RIPARIAN AREAS ANALYSIS DRAFT TABLE 8-3 Level B Fish Passage Barrier Analysis Problem ID a Location Design Discharge (cfs) Culvert Length (feet) Hydraulic Drop (feet) Depth of Flow (feet) Average Velocity (fps) Barrier Status CL-30 Clear Creek at Gay Road No CL-31 RY-20 WO-30 Clear Creek at Pioneer Way E Rody Creek at Pioneer Way E Woodland Creek - WSU Experimental Farm No No , Yes, Velocity a See Figures 5-1 and 5-2 b Existing and future conditions design discharge are approximately equal Source: CH2M HILL Habitat Analysis Low flow conditions in the summer prevent passage of fish in all streams low in their watersheds. Swan Creek was dry at a point about halfway between 64th Street East and Pioneer Way East when surveyed in July Squally, Diru, Woodland, and Rody Creeks are very small streams and prevent adult salmon passage at low flow. When chinook salmon return to the Puyallup Tribal Hatchery in September and October, Diru Creek is too small for the fish to get up to the hatchery. Even if no dam existed on Clarks Creek at Maplewood Springs, the flow above Maplewood Springs is very low during the dry season Altered Stream Flows Many of the habitat problems in the Clear/Clarks Creek Basin result from the altered hydrologic regime caused by the conversion of forested land to agricultural, residential and commercial uses. The relationship between urbanization in a watershed and the resulting impacts on stream flows is well documented. Before development, rain falls on forested areas, is retained in the layer of forest duff, and is slowly released to the stream system. The natural retention ability of the forest reduces peak stream flows and provides a base flow during the dry summer months. As development occurs, pervious areas are paved or hardened, and stormwater runs off into constructed drainage systems that quickly convey rainwater to a receiving stream or wetland. As a result, less rainwater is able to infiltrate and peak stream flows have increased significantly in the Clear/Clarks Creek system. Low Summer Base Flow During the summer months, intermittent low flow conditions exist in all streams low in the watersheds, as discussed above in terms of fish passage. In their mid-canyon reaches, Swan, Clear, Canyon, and Clarks Creek receive considerable groundwater and gain in flow as they proceed down into the Puyallup River Valley. Above these points, the streams are essentially dry during the late summer. Even if blocking culverts did not exist at 64th Street East, 72nd Pierce County Public Works & Utilities 8-6
231 STREAM HABITAT AND RIPARIAN AREAS ANALYSIS DRAFT Street East, 84th Street East, and 96th Street East, fish habitat would not be available due to an absence of perennial flow. Low flows in the canyons prevent the canyon reaches from providing high-quality spawning habitat. Due to the absence of historic flow data, it is not possible to quantify the effects of land development on base flow in the creeks. The hydrologic analysis in Chapter Six predicted that nearly all the canyon reaches of the creeks dry up during the late spring and summer months. Figure 8-1 illustrates the results from the analysis of Swan Creek. The figure shows the average monthly flow for a canyon and lowland reach in Swan Creek. The canyon reach is located above 67 th Street East and the lowland reach is located at Pioneer Way East. Figure 8-1 shows that perennial stream flow occurs in the lowland reach of Swan Creek year round. In comparison, stream flow occurs in the canyon reach only during the winter months and essentially disappears during the summer months. Figures 5-1 and 5-2 in Chapter Five show the approximate location in each stream where perennial flow starts. FIGURE 8-1 Average Monthly Flow at Swan Creek (from HSPF analysis) Average Monthly Flow (cfs) Swan Creek at Pioneer Way East Swan Creek at 67th Street East (extended) October November December January February March April May June July August September Month Increased Peak Discharge Rates Urbanization typically results in increase of peak stream flows, with the largest relative increase occurring for more frequent flow events. These increased peak flows tend to increase the depth and frequency of streambed scour (Booth, 1990). Land development removes trees, understory and groundcover plants, and top soil. It increases impervious surfaces. Consequently, peak stream flow rates increase, and erosive flows increase in their frequency and duration. The high velocity flows pick up and transport sediment to less steep stream reaches and pools where sediment settles, and buries sources of fish food. Pierce County Public Works & Utilities 8-7
232 STREAM HABITAT AND RIPARIAN AREAS ANALYSIS DRAFT Higher peak flows also negatively affect fish habitat by causing channel erosion and stream bank instability. Direct impacts to salmon can occur when bed scour depth during the egg incubation period exceeds the nest (redd) depth. Field observation of bank instability provides evidence that peak flow rates are increasing in the subbasins. The banks of the Swan Creek channel downstream of 64th Street East have eroded to nearly vertical, 12-foot high walls. This erosion pattern is typical of a lower gradient stream where increased flow rates create lateral erosive forces that cut into channel walls and cause the channel to widen into a rectangular shaped channel section with steeply sloped channel walls. The near-vertical walls indicate that the Swan Creek channel has not yet reached equilibrium (Booth, 1990). Vertical channel downcutting, or incision, usually occurs rapidly in response to increased peak flow rates in relatively higher gradient streams. In steep terrain, peak flows scour and incise stream channels, sometimes to the point of creating barriers to fish passage and creating landslides. The steep reach of Woodland Creek downstream of 84th Street East exhibits significant incision to accommodate increased peak flows resulting from urbanization Riparian Corridors Riparian corridors play an important role in supporting aquatic habitat conditions in a stream system. Streamside vegetation contributes large woody debris for pool habitat and complexity, shades streams to maintain cool temperatures, stabilizes streambanks and reduces fine sediment, supports wildlife, provides food and food-generating leaf litter, and provides floodplain storage of stormwater. Vegetated buffers also help reduce or eliminate impacts to streams from nearby land uses. The effectiveness of riparian buffers generally increases with buffer width and presence of streamside conifers. Generally, riparian corridors need to be as wide as the streamside trees are tall; maximum height of trees in the Basin is 150 feet, and resource agencies recommend 150-foot buffer width. Riparian function in the upper areas of all the watersheds is severely impaired. When the upper watersheds were cleared for pasture, riparian vegetation did not reestablish in either large or contiguous corridors. Cattle and other livestock probably cropped the sapling trees, except in areas where livestock were excluded. In addition, riparian vegetation was removed when ditch channels were dug for stormwater flow conveyance improvements to solve local flooding problems. The upper watersheds contain many ditch channels. Homeowners along the creeks have encroached on riparian buffers by clearing vegetation to the edge of the creek and planting lawns. The sparse, patchy, narrow, or absent riparian vegetation has a wide range of adverse effects on salmonid communities. The loss of trees and other streamside vegetation affects the recruitment of large woody debris and the frequency of pools in streams. Large woody debris and pools in streams are important to salmonid habitat. The general lack of streamside tree cover and shade also limits terrestrial insect and leaf litter inputs to the food chain. The canyon reaches of the tributaries generally have good riparian characteristics. The canyon reaches extend up to: 64th Street East for Swan Creek; 58th Street East for Squally Creek; 72nd Street East for Clear, Rody, and Diru Creeks; 84th Street East for Woodland Creek; and 96th Street East for Clarks Creek. Woodland Creek does not have much of a canyon reach or a Pierce County Public Works & Utilities 8-8
233 STREAM HABITAT AND RIPARIAN AREAS ANALYSIS DRAFT contiguous riparian area associated with it. Despite the generally good riparian buffer width in the canyon reaches of the streams, many of the desirable benefits of riparian growth are absent. Shade is generally good, but the trees are too young to contribute much LWD to the channels. Channel down cutting is another factor diminishing the benefit of riparian function in the canyon reaches. Any large woody debris that falls into the creeks is swept downstream by high peak flows. Streambank erosion contributes to this problem by creating smooth-walled channels that are unable to hold trees in place. Deciduous trees dominate the forest community in canyon reaches. In streamside areas, conifer trees typically provide a higher benefit to habitat than deciduous trees because conifers provide more durable, longer lasting wood when submerged in streams. Conifers are more resistant to rot compared to deciduous trees. Conifers LWD can last up to 50 to 80 years in wet conditions whereas deciduous LWD may last no more than 20 years. Some conifers, such as cedars, can last up to 100 years or more. Deciduous trees provide leaf litter, but it comes as one big dump in the fall. Conifers provide leaf litter year-round. Conifer trees also provide year-round shade, which is helpful in shading out undesirable or invasive understory vegetation, such as Himalayan blackberries, purple nightshade, and reed canary grass. The floodplain reaches of all the streams have been adversely affected by practices that have removed the native riparian cover. This has allowed invasive species such as Himalayan blackberry, elodea, and reed canary grass to encroach on the streams. Nearly all of the creeks in this area have been channelized (straightened and rerouted from their original courses). Stream channelization limits the complexity of the riparian community and eliminates fish refuge areas by removing meander bends and disconnecting the stream from the floodplain Instream Habitat The diversity and abundance of aquatic insects that live in or near the stream bottom is a good indicator of the overall ability of the stream to support healthy salmon populations. Factors, such as water quality, sedimentation and bed load movement, affect the benthic 1 community and salmon production in a similar manner. The Benthic Index of Biotic Integrity (B-IBI) was assessed for Swan, Squally, Clear, Canyon, Rody, Diru and Clarks Creeks. B-IBI is a measure of the degree to which the quality of stream habitat deviates from that expected at a relatively undisturbed site. It is based upon the numbers and diversity of species of benthic invertebrates obtained from samples taken from the stream substrate. Based on this assessment, the condition of the benthic community in the creeks was rated Fair for all but Swan Creek, which was rated Poor. Increasing urbanization has been correlated to a rapid decline in stream biological health (May, 1997). Total impervious area as low as 10% of the total basin area has been linked to degradation of the instream habitat. Figure 8-2 plots the B-IBI scores and the existing effective impervious area (EIA). The figure shows that streams in the Clear/Clarks Creek Basin generally follow expected relationships with the highest B-IBI scores occurring in the subbasins with the lowest EIA. Conversely, subbasins with the lowest scores contain the highest percentage EIA. 1 Benthic means organisms living in or on bottom substrates in aquatic habitats Pierce County Public Works & Utilities 8-9

234 STREAM HABITAT AND RIPARIAN AREAS ANALYSIS DRAFT FIGURE 8-2 B-IBI Scores and EIA for Clear/Clarks Creek Streams Source: Habitat investigation, see Section and Appendix E B-IBI Score Swan Creek Squally Creek Canyon Creek Clear Creek Rody Creek Diru Creek Clarks Creek Effective Impervious Area as a Percentage of Total Area in Subbasin Stream Bank Erosion & Instability Normal bank erosion processes are necessary for the maintenance of productive salmon habitat. Bank erosion introduces large woody debris for pool creation and sediment retention, and provides gravel used for spawning. However, erosion at high levels can be detrimental to a stream system by degrading fish habitat and water quality, increasing the frequency of overbank flooding, and inducing mass wasting (land slides). Fine sediments entering the stream negatively affect habitat by burying spawning gravels. Excessive scouring and downcutting can disturb salmon spawning nests and causes salmon eggs to wash out of spawning nests. Habitat field evaluation identified unstable and eroding streambanks in the canyon and floodplain reaches of nearly all streams within the Basin. Erosion problems in canyon reaches are generally characterized by unstable banks cut by high peak streamflow rates. Channel widening and downcutting (as described in the previous section) were observed throughout the stream systems. Channel widening due to sedimentation is the main erosion problem in the floodplain reaches. High stream flows in the canyons transport eroded sediments downstream into the floodplain reaches, where sediments settle out in low-gradient backwater reaches. Typically, a depositional channel will widen in order to re-establish the conveyance capacity of the stream. Pierce County Public Works & Utilities

235 STREAM HABITAT AND RIPARIAN AREAS ANALYSIS DRAFT Stream bank and stream bed erosion is a serious problem in all watersheds in the Clear/Clarks Creek Basin. For example, Swan Creek has sections where the channel has downcut as much as 12-feet with vertical banks. There was one area of serious slumping located on Swan Creek about 1,500 feet below 64th Street East. The tremendous hydraulic power of peak flows and the associated bedload movement of cobble and gravel are demonstrated by the condition of a recent bed stabilization project in the 0.5-milelong reach below 64th Street East. A series of log V weirs were installed in the mid-1990s. When observed in 2001, about half of these weirs had washed away (they were sequentially numbered and marked) and the other half were not functioning. Most of the remaining weirs were almost completely buried with gravel on both the upstream and downstream side of the weir. This reach was dry in July The significance of high peak flows and the associated erosion and bedload movement, is that pools cannot be maintained and spawning success can be greatly diminished. Salmonid eggs in spawning nests (redds) might be lost if the scour depth extends into the spawning depth. It is almost certain that this occurs, but the extent to which it happens is not known. LWD is washed downstream where it is piled up against road culverts and, thus, is not available to create and maintain pools. Lack of pools is a serious limiting factor in all watersheds. Excessive sands and fine particles, which are part of the till soil being eroded upstream, fill in the void spaces between spawning gravels and limit water irrigation over developing eggs. The loss of water movement around salmonid eggs can lead to death of the developing embryos. In Clear Creek, altered hydrology from impervious surfaces in the upper watershed has led to an erosion and bedload situation similar to that in Swan Creek, albeit less serious. In Clear Creek, the channel has down cut as much as 10-feet with vertical exposed banks below the 72nd Avenue East culvert. The most severe erosion observed in the Clear Creek Basin was below this culvert, with exposed banks continuous on both sides of the creek for 150-feet downstream of the culvert. A private homeowner, interviewed on 72nd Avenue East, described how his backyard fence has required rebuilding due to the slumping land below. Exposed banks and slides of shorter length were also observed between the 45th Street East cul-de-sac and Pioneer Way East on Clear Creek. In Canyon, Rody, and Woodland Creeks, channel down cutting is common. The most severe down cutting occurs in Woodland Creek, above and below the 84th Street East crossing. Along Woodland Creek, the exposed soil layers appear to have a higher clay content, and have subsequently resisted sloughing and slumping. However, down cutting in Woodland Creek was observed at depths of as much as eight feet, often in places with a channel width of only two or three feet. In Canyon and Rody Creeks, down cut banks were present, but were not as severe as those in Woodland Creek. Exposed banks of up to three-feet were encountered only occasionally. Pierce County Public Works & Utilities