SECTION III: WATERSHED TECHNICAL ANALYSIS
|
|
|
- Aleesha Hodge
- 5 years ago
- Views:
Transcription
1 Trout Creek Watershed Stormwater Management Plan SECTION III: WATERSHED TECHNICAL ANALYSIS A. Watershed Modeling An initial step this study of the Trout Creek watershed was the selection of a stormwater simulation model to be used in the analysis. To provide a reasonable estimate of existing flows within the watershed to serve as a baseline for the study of stormwater management and to effectively evaluate the hydrologic response of the watershed to various changes in stormwater management it was necessary to select a model which: Modeled design storms of various durations and frequencies to produce routed hydrographs which could be combined Was adaptable to the size of subwatersheds in this study Could evaluate specific physical characteristics of the rainfall-runoff process Did not require an excessive amount of input data yet yielded reliable results The model selected for use in this study was the U. S. Army Corps of Engineers, Hydrologic Engineering Center, Hydrologic Modeling System (HEC-HMS) for the following reasons: It had been developed at the Hydrologic Engineering Center specifically for the analysis of the timing of surface flow contributions to peak rates at various locations in a watershed Although originally developed as an urban runoff simulation model, data requirements make it easily adaptable to a rural situation Input parameters provide a flexible calibration process It has the ability to analyze reservoir or detention basin routing effects It is accepted by the Pennsylvania Department of Environmental Protection Although other models, such as TR-20, may provide essentially the same results as the HEC-HMS, HMS s ability to compare subwatershed contributions in a peak flow presentation table make it specifically attractive for this study. The HEC-HMS Model generates runoff flows for selected subareas along the drainage course and compares subarea contributions to the total runoff. The model generates runoff quantities for a specified design storm based upon the physical characteristics of the subarea, and routes the runoff flow through the drainage system using variables that represent the hydraulic characteristics of the stream. The amount of runoff generated from each subarea is a function of its slope, soil type or permeability, amount of development, and its vegetative cover. Composite runoff curve numbers were generated for the watershed by overlaying the land cover map with the subarea and hydrologic soil group maps. The generated curve numbers were then used for input into the computer model to simulate the amount of runoff generated for select return intervals. Map III-1 displays the subarea delineation for the Trout Creek watershed. The hydrologic model developed for this project includes the entire Trout Creek Watershed. However, the primary area of interest for this study was the portion of the Trout Creek watershed within Tredyffrin Township and the small portion of the watershed within Easttown Township. As the main focus of this study is in the Tredyffrin Township portion of the watershed, special attention and most of the effort to develop the model was focused on that portion of the hydrologic model. III-1

2
3 Trout Creek Watershed Stormwater Management Plan The area of the watershed situated outside of Tredyffrin Township was incorporated into the project s hydrologic model so that the effects of management strategies applied in the Tredyffrin Township portion of the watershed could be evaluated, if desired, beyond the Township s corporate limits. As this required little additional effort to complete, the extension of the model to include the entire watershed was considered worthwhile. B. Modeling Process After delineating the Trout Creek watershed in the GIS, and checking the delineation by overlaying it on the USG.S topographic map, the watershed was divided into subwatersheds for modeling purposes. The main considerations in the subdivision process were watershed topography; location of obstructions, problem areas, and tributary confluences; as well as the grouping of portions of the watershed with similar hydrologic characteristics located in close proximity to each other. The input parameters required to create the subarea elements in the HEC-HMS hydrologic model include: slope, Soil Conservation Service (SCS) or Natural Resources Conservation Service (NRCS) curve numbers, lag, longest flow paths, and subarea centroids. In addition to the subarea characteristics, parameters are included in the hydrologic model, which define channel characteristics of the Trout Creek and its tributaries, such as, channel length, slope, and Muskingum routing. Each of these parameters were generated with GIS using data collected for this study and then exported to the Trout Creek watershed HEC-HMS model. Points of interest area selected at important points in the watershed where quantification of the flow is of particular significance. The reason these points of interest are selected is to provide watershedwide runoff control through effective control of runoff from individual subareas. Thus, control of stormwater runoff in the entire watershed can be achieved through stormwater management in each subbasin. The modeling process addresses: Peak discharge values at various locations along the stream and its tributaries; Time to peak for the above discharges; Runoff contributions of individual subareas at selected downstream locations; and Overall watershed timing. C. Calibration In order to simulate storm flows for a watershed with confidence and reliability, the computer model requires calibration. The calibration process involves fine tuning the model to provide the most accurate representation of the real runoff and timing conditions of a watershed thus ensuring that the interaction of hydrographs from various subareas combine to achieve the target flows at the calibration points. Hydrographs are simply a plot of time versus flow in cubic feet per second. Calibration of a model involves the adjustment of input parameters (within acceptable value ranges) to reproduce the recorded or projected responses of a range of storm events. When actual storm event data is available (i.e. stream flow and rain data), this information can be input into the model to produce simulated hydrographs and compared to observed hydrographs to calibrate the model. To simulate a specific event, antecedent moisture conditions and rainfall distribution must be duplicated in the model input. Adjustments to other parameters are made to III-3
4 Trout Creek Watershed Stormwater Management Plan attempt to duplicate hydrograph shapes and peak flow rates at points in the watershed where flow measurements were recorded. The USGS manages many stream gages, which record flow over time, throughout the U.S. In order to utilize actual stream flow and rain data for calibration, sufficient data must be available. Rain gages must be in close proximity to the watershed so that actual rainfall conditions from these gages are representative of the actual rainfall that occurs over the watershed. Localized events, snowmelt, and unique conditions are typically not used for calibration due to their unique circumstances. Unfortunately, a USGS stream gage is not located within the Trout Creek watershed. However, a stream Gage was found within the adjoining Valley Creek watershed. It is located at the PA Turnpike Bridge near Valley Forge, PA and has a drainage area of approximately 21.0 square miles. The gage number and the period of record for the gage is indicated in Table III-1. TABLE III-1 USGS Stream Gage Closest to the Trout Creek Watershed USGS Gage No.: Location Period of Record Valley Creek at PA Turnpike Bridge near Valley Forge, PA current The observed hydrograph data from Valley Creek stream gage could not be used directly for the Trout Creek calibration. However, a statistical frequency analysis of the peak flows, (Log Pearson Type III) was performed on the Valley Creek gage data and transposed to the Trout Creek watershed. The results of this analysis after adjusting for differences between the drainage area for the Trout Creek watershed and the Valley Creek watershed are located in Table III-2. TABLE III-2 Trout Creek Flows Determined from Transposition of the Valley Creek Stream Gage Flows Drainage Area Peak Discharge (cfs) (sq. miles)) 10-Year 50-Year 100-Year 8.8 1,488 2,627 3,272 Since the ideal situation for calibration (stream flow data from the Trout Creek with at least ten years of flow data) was not attainable for the Trout Creek Watershed and the drainage area ratio between the Valley Creek stream gage and the Trout Creek watershed is somewhat large, another method of calibration was needed to use in conjunction with the transposition of stream gage data from the Valley Creek. Therefore, flow data contained in the Chester County Flood Insurance Study, dated March 17, 2002 was inspected for possible application in the calibration of the Trout Creek model. The FIS published by FEMA contains a Frequency-Discharge-Drainage Area Curve developed from regionalized frequency data based upon the statistical analysis of stream flow records from stream gages located in the area and operated by the USGS. A copy of the figure contained in the FIS is shown in Figure III-1. Although the curve extends up to 15 square miles the total drainage area of the Trout Creek watershed is 8.8 square miles. The reason the curve extends to a point larger than the size of the watershed is because the curves were developed from regionalized frequency curves based upon streamflow records from a group of gages located within the area. Therefore, even though the stream gages for surrounding watersheds may have had drainage areas significantly greater than the Trout Creek, the flow data from these gages was used to create FEMA s Frequency- III-4

5 Figure III-1 FEMA FIS Frequency-Discharge, Drainage Area Curve III-5
6 Discharge-Drainage Area Curve for the Trout Creek. A summary of the discharges obtained from the FEMA curve is shown in Table III-3. Table III-3 Summary of Flows from the FEMA FIS Curve Drainage Area (sq. miles) Peak Discharge (cfs) 10 -Year 50 -Year 100 -Year ,000 1, ,030 1,060 1, ,450 3,200 3, ,750 4,800 5,500 In addition to obtaining flows from the two aforementioned methods, the National Streamflow Statistics (NSS) program, developed by USGS, was accessed to obtain watershed characteristics for the Trout Creek watershed. These watershed characteristics were input into National Flood Frequency Program to obtain stream flows based upon the regression equations contained in USGS Water-Resources Investigations Report Stream flows calculated from the WRIP-4189 regression equations, with both rural and urban equations are shown in Table III-4. Drainage Area (sq. miles) Table III-4 Flows from NFF Program Peak Discharge (cfs) 10 -Year 50 -Year 100 -Year Rural 8.8 1,530 2,570 3,120 Urban 8.8 1,670 2,620 3,160 Even though the rural and urban regression equations use different parameters to calculate the flows, the variations in flows between rural regression equation and the urban regression equation are relatively small. The rural regression equations uses the parameters of drainage area, flood region, percent urbanization, percent forest, percent underlain by carbonate rock and area controlled by swamps and lakes, while the urban equation uses the parameters of drainage area, channel slope, 2- year-2-hour rainfall intensity, basin storage, basin development and percent impervious surface. As the difference in flows between the rural equation and urban equation are relatively small it is believed that the diverse nature of the watershed, with significant commercial development at the bottom of the watershed and less intense rural development in the headwaters, makes both the rural and urban regression equations acceptable for calculating the flows in the watershed. A side-by-side summary of the flows determined by all three methods is shown in Table III-5 along with a graphic representation of the results provided in Figure III-2. As can be seen, the flows vary somewhat from methodology to methodology, with the flow obtained from the FEMA Frequency- III-6
7 Table III-5 Comparison of Peak Flows Determined from Various Methods Peak Discharge (cfs) Valley Stream Gage FEMA NFF (Rural) NFF (Urban) HMS Model Transposition 10-Year 1,488 3,750 1,530 1,670 1, Year 2,627 4,800 2,570 2,620 2, Year 3,272 5,500 3,120 3,160 3,302 Discharge-Drainage area curve substantially different from the remainder of the flows. There are several reasons to be skeptical of the higher FEMA flows. First, the FEMA flows used data from several gages dispersed throughout the region instead of data specific to the Trout Creek watershed or northeast Chester County alone. Some of these gages may be located in areas without carbonate geology and therefore would have higher runoff than areas such as the Trout Creek watershed which contains a large area with carbonate geology. Second, the FEMA data is based on Water Resource Council Bulletin 15, which was published in Since the issuance of this document the Water Resource Council has superseded Water Resource Bulletin 15 with other technical guidelines for evaluating surface water hydrology. Third, the data used to produce the FEMA flow values are based on a shorter period of record than the Valley Creek transposition and the regression equations developed in the NFF program. Fourth, both the transposed Valley Creek gage data and the NFF program use data and characteristics specific to Trout Creek and northeast Chester County, which are based on the latest hydrologic technical methods, and furthermore use a larger data set than what was used to develop the FEMA flows. As the flows computed based upon the regression equation contained in WRIP-4189 are reasonably close to the flows determined by the frequency analysis and transposition of the Valley Creek stream gage data, these flows developed from the regression equations were used to complete the calibration of the Trout Creek hydrologic model. Several potential calibration parameters are available to calibrate the hydrologic model within HEC- HMS. These include initial abstraction, surface roughness, subbasin time of concentration, runoff curve number, hydrograph routing velocity, and travel time. Prior to completing the calibration process several trial runs were initially made to complete a sensitivity analysis to determine the hydrologic response of the watershed model to each of these parameters. From these runs, it was determined that the initial rainfall abstraction and subbasin travel time, were the most sensitive parameters available to calibrate the model. Therefore, the values representing these calibration parameters could be modified, as needed, within an acceptable range of values for subbasins with similar land cover, hydrologic soil groups and slopes, to arrive at flow values that are reasonably close to the values calculated by the regression equations and the gage analysis. III-7

8 Figure III-2 Graphical Comparison of Peak Flows Determined from Various Methods In addition to the outlet of the watershed, two other calibration points were selected to further calibrate upstream portion of the model located in Tredyffrin Township. These additional calibration points are located downstream of the confluence of the Main Stem of the Trout Creek and the tributary east of the Gateway Shopping Center (HEC-HMS ID J150) and on the Main Stem of the Trout Creek in the vicinity of Richards Road (HEC-HMS ID J210). Table III-6 Flows at Additional Calibration Points 10-Year 50-Year 100-Year Downstream of the Gateway Shopping Center (J150) NSS* 801 1,230 1,470 HEC_HMS 531 1,160 1,523 In the Vicinity of Richards Road (J210) NSS* 1,570 2,410 2,920 HEC-HMS 1,370 2,401 3,039 Outlet of Trout Creek to Schuylkill River (OutletWS) NSS* 1,670 2,620 3,160 HEC-HMS 1,499 2,627 3,302 *NSS under urbanized condition III-8
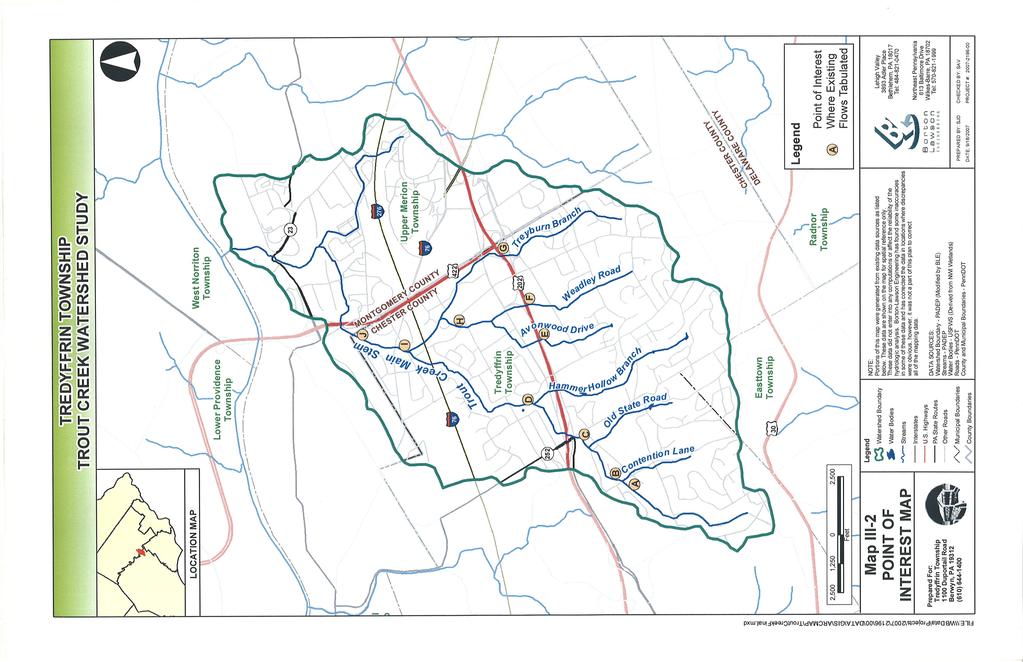
9 D. Model Results The benefit of the creating a watershed hydrologic model is that the flow from any single subarea or combination of subareas can easily be obtained for all storms and events in the model. Table III-7 contains flow data obtained from the hydrologic model for several key points dispersed throughout the Tredyffrin Township portion of the Trout Creek watershed. Generally the points of interest selected move from the western portion of the watershed to the eastern portion of the watershed, and then to the downstream sections of the watershed near the Township line. A Point of Interest Map shown in Map III-2 identifies the location of points of interest (P.O.I) shown in the table. The hydrologic model and the data it generates will be useful in evaluating stormwater management BMPs proposed for application in the watershed. III-9
10 Table III-7 Trout Creek Watershed Hydrologic Model - Existing Condition Flows P.O.I ID Location HMS ID Branch 2- Year 10- Year Flow (cfs) 25- Year 50- Year 100- Year A Old State Road W910 Main Stem B Confluence of Tributaries North of Contention Lane J140 Main Stem C D Upstream of Route 202 Crossing (Western Most Crossing of Main Stem) Confluence of Tributaries Downstream of Gateway Shopping Center J145 Main Stem J150 Main Stem E Route. 202 Crossing of the Avonwood Branch Userpoint2 Avonwood F Route 202 Crossing of the Weadley Branch WeadleyBR Weadley G H H Route 202 Crossing of Drummers Lane Tributary Intersection of Walker and Glenhardie Roads (Downstream of the Richter Property) Confluence of Tributaries Northeast of Old Eagle School Road and Walker Road Intersection Userpoint4 Drummers RichterProp Walker J188 Drummers I Richards Road Culvert J210 Main Stem J Township Line J215 Main Stem III-10
11