Project Delivery Process. Bruce Johnson, P.E. State Bridge Engineer Oregon Department of Transportation
|
|
|
- Ophelia Sharp
- 5 years ago
- Views:
Transcription

1 Project Delivery Process Bruce Johnson, P.E. State Bridge Engineer Oregon Department of Transportation February 1, 2010
2 Outline Introduction 1. Planning 2. Design (through DAP) Break 3. Design (DAP through PS&E) 4. Bid and Award 5. Construction Summary 2

3 Project Delivery Process
4 Duration of each phase Plan: 0-10 years Design: 3 months - 10 years Build: 6 months - 4 years Operate/Maintain: years Preservation projects, low duration is for pave-only
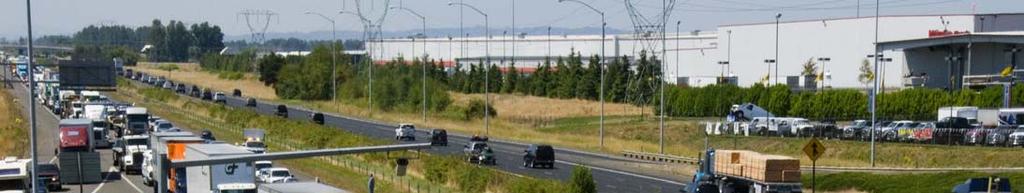
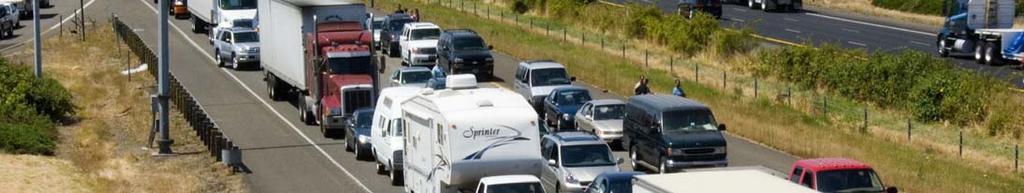
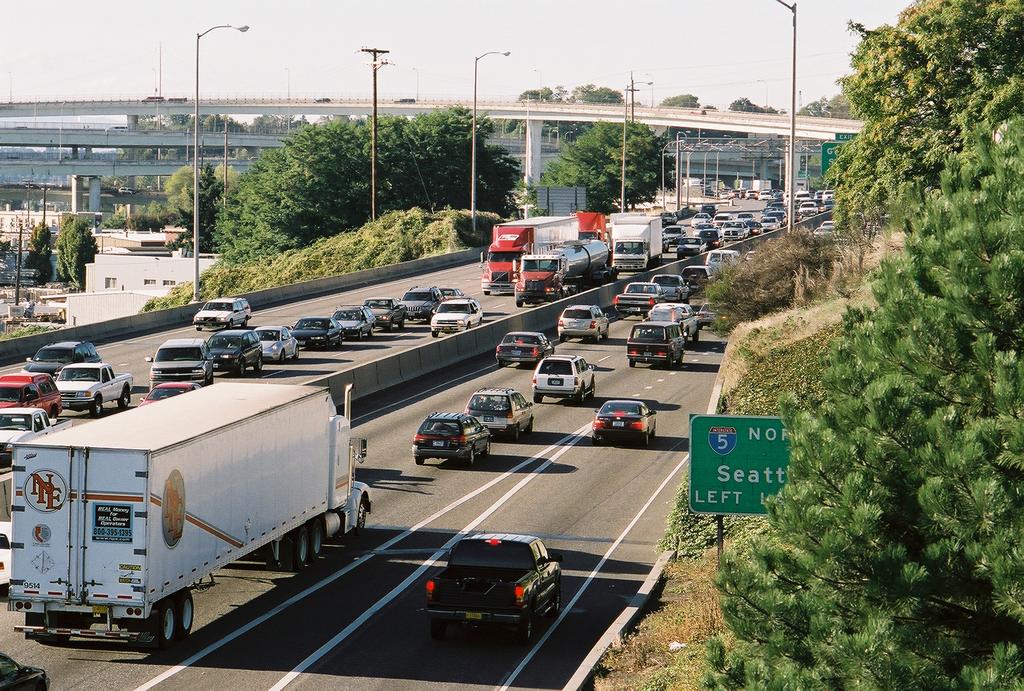
5 Other factors impacting duration Project location Projects in urban locations have more stakeholders (e.g. city government, neighborhoods) Require great care in design and in construction planning (get in, get it done, get out) Stakeholder involvement State & local elected officials, local & regional governments, Regional/District offices Nine state agencies, eighteen federal agencies, 9 federal recognized tribes Citizen groups and individual citizens, business organizations
6 Project Delivery Module 1 Planning and Program Development


7 Planning How projects are identified, scoped and approved Management systems IAMPs Refinement plans Stakeholder Involvement Duration 0-10 years

8 What is Transportation Planning? 1. Monitoring existing conditions; 2. Forecasting future growth by area and corridor; 3. Identifying current and future needs and analyzing various transportation improvement strategies to address those needs; 4. Developing plans of alternative solutions; 5. Estimating the impact of those solutions 6. Developing a financial plan.
9 How projects are identified, scoped and approved Transportation Planning Studies Management Systems Scoping STIP Approval Public Input Transportation Planning Scoping STIP Approval Management System

10 MPO and Local Transportation Planning Components Transportation System Plans Regional Transportation Plans Refinement Plans Transportation Facility Plans
11 Transportation System Plans (TSPs) Approval by Local Government States may assist Locals with funding and involvement in process Stakeholder Involvement Primarily at local level Risks Plans are not fiscally constrained. Projects not fully prioritized.
12 Regional Transportation Plans (RTPs) Official, mandated multimodal transportation plan for metropolitan areas over 50,000 in population Considerable autonomy State has one seat at the table Financially Constrained Project List All this work gets used in NEPA
13 TSPs & RTPs vs. Transportation Improvement Plans (TIPs) TSPs and RTPs typically cover a 20- year period TSPs identify gap between needs and anticipated revenue, but are not fiscally constrained RTPs identify gap between needs and anticipated revenue, but are fiscally constrained TIPs cover a four-year period TIPs must be constrained to anticipated revenue
14 Refinement Planning Complex Issues requiring more detail than system planning Resolve issues that are not fully addressed in TSPs Process allows greater detail of problem identification and solution recommendation Can build broader community support Work is used in NEPA
15 Transportation Facility Plans Establish management objectives, tools, and standards for the State facility Provide foundation for local plan amendments, Area Commission support, and STIP development
16 Transportation Facility Plans Establish specific project or solution direction and management strategies Interchange Area Management Plans (IAMP) Access Management Plans (AMP) Expressway Management Plan (EMP) Approved by both Local Government and State Support subsequent environmental documentation and project delivery
17 Transportation Planning Coordination Establish local jurisdiction and public support for transportation solutions and management actions Integrate local land use and transportation plans. Establish state and local plan consistency (TSP to STP and Statewide Modal Plans) Develop local plan policies and code changes to support state projects and facility management objectives
18 Management Systems Management Systems track the location and condition of transportation assets The primary management systems used in program development cover Bridges, Pavements and Safety Management systems are also used or are in development for operations (congestion), culverts, retaining walls, slides and other features
19 Project Prioritization Transportation Commission (TC) sets funding allocations TC sets program criteria and goals Planning and management systems list potential projects across state Projects from Management Systems primarily prioritized by regions with stakeholder input where appropriate Modernization projects prioritized by Area Commissions on Transportation According to STIP criteria Region teams scope projects
20 Project Scoping Performed by regions (in-house or outsourced) Completed each STIP update cycle by a multi-disciplinary team Develops rough project cost estimates Documents project plan in the project prospectus More projects are scoped than end up in the STIP Projects constrained to available funds regionally and statewide
21 Scoping Performance KPM #23 Projects vs Estimate 100% At or Below Estimate Target 80% 60% 40% 20% 0% At or Below Estimate 73% 48% 56% Target 80% 80% 80% 80%
22 Developing the STIP STIP is the document identifying high level scope, construction year and funding Draft STIP compiled for public review TC adjusts as necessary Air quality conformity Final Region review TC & FHWA/FTA approval Process occurs every two years
23 STIP Schedule Funding Allocations October 2009 Early Public Input Thru December 2009 Project Priorities December 2009 Scoping January May 2010 Draft STIP August 2010 Public Review Thru April 2011 STIP Approval June 2012
24 STIP and Financial Plan STIP is the program and scheduling document identifying scope and programmed amounts Financial Plan is the internal accounting journal for all projects each region manages its own plan. Financial Plan accounts for actual project obligations and authorizations such as increased ROW and bid prices.
25 Stakeholder Involvement Required throughout process Stakeholder Groups Can Include: Area Commission on Transportation Citizen Advisory Committees Technical Advisory Committees Oversight Teams Natural Resource Agencies Targeted Outreach Open House / Public Meetings
26 Stakeholder Involvement Other Techniques Stakeholder involvement is front loaded during planning, which adds time and can be costly, but results in projects that are better integrated into surrounding communities and have less chance of being challenged during design or formal environmental process.
27 Transportation Planning Cost The transportation long-range planning programs within the regions provide the planning work necessary to move projects into project delivery however sometimes planning functions are covered by project budget Average transportation long-range planning expenditures are $6.9 M per year over the past 6 years


28 Management System Cost Oregon Example Bridge $4.5 M* Pavement $0.5 M Safety $0.5 M All costs are average annual costs * Includes Bridge Inspection and Load Rating
29 STIP Scoping Cost Regions are responsible for scoping projects for the STIP Regions generally scope more projects than actually end up in the STIP Average cost for STIP scoping is $1.8M per year over the past 6 years
30 Costs Phase Modernization Bridge Preservation Safety/Ops Planning/Scoping 9.1% 5.2% 0.4% 3.0% Design RoW / Utility Relocation Bid & Award Construction Engineering Construction Total (%) 9.1% 5.2% 0.4% 3.0%
31 What is Success for Planning? Program development meets Commission criteria and goals Problem identification supported by community s vision Help establish priorities Help set reasonable performance expectations Reduce duplication and alternatives in NEPA process Planning decisions are relied upon in Project Delivery
32 Continuous Improvement Involve design office, area, district in system and project planning processes Involve planners in Project Delivery to ensure planning commitments are met Training Planning for non-planners Leadership teams integration Planning Business Line Team and Project Delivery Business Line Team Asset Management: Expand the use of management systems to assets other than bridges, pavements and safety
33 Continuous Improvement Future Refining STIP Criteria Linking Planning Environmental Process (LPEP)
34


35 Discussion
36 Project Delivery Module 2 Design (Kick-off through Design Acceptance Package (DAP)) Project Development
 NEPA DAP")

37 Design (Kick-off through Design Acceptance Milestone ) NEPA DAP Criteria Stakeholder Number & Types Involvement of Deliverables Preliminary Approvals Design
38 Project Delivery Project approved thru STIP Projects handoff to Area Managers and Project Development Team (PDT) for Project Development (environmental study, preliminary design, ROW acquisition, and final design) through PS&E
39 Starting a Project Design Assign Project Team Leader Identify Project Team Map out process for project development Review and confirm available information - Scoping Document - Project Prospectus - Refinement Plans - Draft project schedule -Project Funding
40 Key Factors driving duration of Project Development Project location Public & stakeholder involvement Work Type NEPA Right of Way (Impacts during 2 nd phase of project development)
41 Project Location Project Location Projects in urban locations have more stakeholders (e.g. city government, neighborhoods) Require great care in design and in construction planning (get in, get it done, get out)
42 Stakeholder Involvement Stakeholder Involvement State & local elected officials, local & regional governments, Areas/Districts, Economic Revitalization Teams Nine state agencies, eighteen federal agencies, nine federally recognized tribes Citizen Advisory Committees, stakeholder groups, business organizations
43 Work Type Modernization Bridge Preservation Safety and Operations
44 Primary work types count & volume # of projects by work type # of projects by work type Amount in Millions $76 Operations (73) Modernization (67) Operations (73) Modernization (67) $534 $522 Preservation (101) Bridge (106) Preservation (101) Bridge (106) Safety (63) Safety (63) $114 $394 Note: Pie slices which have been pulled out represent OTIA and Earmarks. Modernization Projects Bridge Projects Safety Projects Preservation Projects Operations Projects Note: Pie slices which have been pulled out represent OTIA and Earmarks.
45 Why is the work type important? Modernization and complex bridge projects take more time Greater complexity in design, more tasks to design A modernization project can typically take a year or more in design than a preservation project, all other things being equal.
46 What is NEPA? National Environmental Policy Act of 1969 (NEPA) Goals include avoiding, minimizing or mitigating the impact to socioeconomic, natural, and cultural resources by Ensuring consideration of environmental impacts prior to taking action Preventing or mitigating damage to the environment, Enhancing the health and welfare of people, Enriching understanding of natural resources important to the nation Iterative Process Full public disclosure
47 What is NEPA? NEPA requires a rigorous process, including public involvement and scientific analysis in order to reach an environmentally informed decision. NEPA requires full disclosure about major actions taken by Federal agencies, including alternatives to the actions, impacts, and possible mitigation.
48 NEPA Areas of Concern Socioeconomic (noise, visual, environmental justice) Title VI, Civil Rights Act 1964 Natural environment (flora, fauna, wetlands, endangered species, air quality, water quality) Section 404, Clean Water Act Cultural resources (archaeological, historic, parks) Section 4 (f) & 6(f), Land and Water Conservation Fund Act of 1965
49 NEPA Classes of Actions Class 1 Environmental Impact Statement (EIS) Record of Decision There will be an environmental impact Class 2 Categorical Exclusion (CatEx) No significant environmental impacts anticipated Class 3 Environmental Assessment (EA) Finding of No Significant Impact or elevate to an EIS Uncertain if there is an environmental impact
50 What Determines NEPA Classification? Environmental scoping to determine: Context and intensity of the proposed action and potential impacts Applicable environmental regulations and implications Potential controversy Overall complexity
51 Environmental Classification 66 1 Class 1 Environmental Impact Statement Class 2 Categorical Exclusion 15 Programmatic Exclusion Class 3 Environmental Assessment Undetermined
52 Why is Environmental Class important? Class 1 and Class 3 projects require a significant amount of study and many tasks before a preferred concept design can be selected and detailed design work can proceed. Class 1 (EIS) NEPA processes can add 3-5 years or more to project development, and Class 3 (EA) NEPA processes can add 2-3 years
53 Record of Decision (ROD) Class 1 EIS A Record of Decision (ROD) is the federal environmental decision document, issued by FHWA, which: Explains the reasons for the project decision, Summarizes any mitigation measures that will be incorporated in the project, and Documents any required section 4(f) approval Record of Decision completes the NEPA process for Class 1 projects
54 Categorical Exclusions (CatEx) Class 2 CatEx projects are exempt from the requirement to prepare an EA or an EIS, all other applicable environmental regulations must be complied with, and Documentation supporting the CatEx is required Impacts must be avoided Unavoidable impacts must be minimized Measures to mitigate unavoidable adverse impacts must be incorporated
55 Finding of No Significant Impact (FONSI) Class 3, EA Federal Environmental Review Decision Document Issued by FHWA Documents why the proposed action will not have significant Impacts Outlines reasons why EIS-level analysis is NOT required FONSI attached to revised EA Completes NEPA Process
56 NEPA Deliverables Can include: Technical reports including mitigation plans Project alternatives Traffic modeling Draft document and public hearing Recommended alternative Land Use actions/decisions Final environmental document FONSI or ROD MOA for mitigation agreements
57 EIS Timeline & Decision Points

58 OR Example - Collaborative Environmental & Transportation Agreement for Streamlining CETAS was signed by Oregon s state and federal transportation and environmental agencies in 2001 to support environmental stewardship and advance procedural improvements to streamline the environmental review process for ODOT s major transportation projects
59 PE Design Deliverables - PDT Field surveys, mapping Engineering reports (hydraulics, geotechnical) Pavement design Sign, signal,& illumination designs Preliminary Roadway design Access Mgmt. Strategy & Official Project Access List Preliminary R/W maps Interchange Area Management Plans* Intergovernmental Agreements Bridge TS&L

60 Design Acceptance Package (DAP) Major decision point. Project go/no go to final design Design footprint finalized for R/W, environmental actions All elements included Project team agrees to be bound by footprint Area Manager, Design Manager certify Start Permit Process
61 STIP Financial Plan Each region and Program manages its own STIP financial plan and is accountable for balancing its plan - Region Mod, Bridge, Preservation, Safety Financial Plan includes all project costs: PE, R/W, utilities, construction obligations, authorizations and changes in project costs
62 Streamlined Processes Time Reductions Project Team approach Prospectus Expanded Part III of the prospectus Scoping Documents Mitigation Banking Programmatic Permits Environmental Baseline Reports Improved Environmental Compliance
63 Continuous Improvement Initiatives Improve environmental scoping methods Annual reporting to regulatory agencies & FHWA (TAC2) Develop/Expand Mitigation Banking Programs (include other resources) Expand use of performance standards Develop new programmatic agreements with regulatory agencies
64 Continuous Improvement Initiatives Batch projects by similar type: Bridge replacements Culvert replacements Interchanges (Rural Category & Urban Category) Preservation
65 Process Challenges Right sizing public & stakeholder involvement Resource challenges (design, drafting, technical specialties, environmental) FHWA regulatory oversight role inconsistencies
66 Process Challenges CAT-EX Environmental Sign-off FHWA requires no final design or ROW purchase with federal dollars until permits are in-hand, all environmental work complete States can cover ROW purchase with state funds with state funds being used as credited for state match Will add up to one year to project development for some Class 2 projects
67 Discussion / Break