Drought Report. August 2017
|
|
|
- John Farmer
- 5 years ago
- Views:
Transcription


1 Drought Report August 2017 January April 2017
2
3 Table of Contents Table of Contents LIST OF FIGURES iii LIST OF TABLES iii LIST OF ACRONYMS iv 1. INTRODUCTION About BAWSCA Report Contents DROUGHT ACTIONS AND TIMELINE State Drought Actions Proclamation of a State of Emergency (January 2014) Proclamation of a Continued State of Emergency (April 2014) SWRCB Emergency Water Conservation Regulation (July 2014) SWRCB Emergency Water Conservation Regulation (March 2015) Executive Order B (April 2015) SWRCB Emergency Water Conservation Regulation (May 2015) Executive Order B (November 2015) SWRCB Emergency Water Conservation Regulation (February 2016) Executive Order B (May 2016) SWRCB Emergency Water Conservation Regulation (May 2016) SWRCB Emergency Water Conservation Regulation (February 2017) Executive Order B SWRCB Rescinds Portion of Emergency Water Conservation Regulation Making Conservation a California Way of Life Long-Term Conservation Framework SFPUC Drought Actions SFPUC Request for Conservation Lower Cherry Aqueduct Emergency Rehabilitation Project SCVWD Request for Conservation BAWSCA DROUGHT RESPONSE ACTIONS Demand Management Actions Communication and Outreach Regional Water Conservation Programs BAWSCA Water Supply Actions BAWSCA Pilot Water Transfer Potable Reuse Projects Groundwater Reliability Policy and Technical Support SFPUC Voluntary 10% Reduction Agency Support State Drought Regulation Support Preparation for SFPUC Mandatory Water Use Reductions DROUGHT RESPONSE BY MEMBER AGENCIES Drought Response Actions Utilized by Member Agencies Relative Perceived Effectiveness of Drought Response Action Member Agency Feedback on BAWSCA Drought Support FISCAL CONSIDERATIONS BAWSCA Fiscal Impacts SFPUC Fiscal Impacts Minimum Purchase Requirements Wholesale Water Rate Impacts Member Agency Fiscal Impacts 5-4 i
4 6. WATER QUALITY IMPACTS Increased Nitrification Elevated Levels of Disinfection Byproducts Taste and Odor Issues WATER USE REDUCTIONS San Francisco Regional Water System Water Use Reductions Total Potable Water Use Reductions Total Cumulative Water Use Reductions Compliance with SWRCB Water Conservation Standards Residential Per Capita Water Use Outdoor Water Use Reductions PREPARING FOR THE NEXT DROUGHT Lessons Learned Drought Preparedness Actions Tier 1 and Tier 2 Plan Revisions Drought Response Studies Regional Water System and Supply Modeling Tool Making Water Conservation a California Way of Life 8-3 APPENDICES A. Major Drought-Related Governor Brown Executive Orders A-1 B. State Water Resources Control Board Drought Regulations B-1 C. SFPUC Request for 10 Percent Conservation January 2014 C-1 D. SFPUC Minimum Purchase Waivers D-1 E. SFPUC April 2017 Final Water Supply Availability Estimate E-1 F. Regional Drought Messaging Campaign Artwork F-1 G. Regional Drought Messaging Materials Graphics G-1 H. Technical Memorandum: BAWSCA-EBMUD Pilot Water Transfer Phase II Pilot Plan H-1 I. SFPUC Deliveries and Reduction Targets (January 2014 to April 2017) I-1 J. SWRCB Water Supplier Reporting Dataset for BAWSCA Agencies J-1 K. ReNUWIt Technical Memorandums K-1 Table of Contents 8/9/2017 ii
5 List of Figures Figure 1.1 California Drought Conditions, January 28, Figure 2.1. Drought Timeline Overview 2-1 Figure 2.2. Timeline of State and Local Drought Actions 2-10 Figure 2.3 United States Drought Monitor California Drought Intensity, January 2014 to January Figure 3.1. SFPUC-BAWSCA Campaign Artwork 3-2 Figure 3.2. Sample Restaurant Table Card from BAWSCA Program 3-3 Figure 3.3. Regional Watering Schedule Messaging 3-4 Figure 5.1. SF RWS Purchases during Drought for Agencies with Minimum Purchase Requirements 5-3 Figure 7.1. SF RWS Total System Deliveries on Weekly Basis 7-2 Figure 7.2: SF RWS Target and Actual Target Water Savings for Voluntary Reduction Period 7-2 Figure 7.3: 2014 Weekly SF RWS Target and Actual Deliveries 7-3 Figure 7.4: 2015 Weekly SF RWS Target and Actual Deliveries 7-3 Figure 7.5: 2016 Weekly SF RWS Target and Actual Deliveries 7-4 Figure 7.6: 2017 Weekly SF RWS Target and Actual Deliveries 7-4 Figure 7.7: 2014 SF RWS Target and Actual Cumulative Water Savings 7-5 Figure 7.8: 2015 SF RWS Target and Actual Cumulative Water Savings 7-5 Figure 7.9: 2016 SF RWS Target and Actual Cumulative Water Savings 7-6 Figure 7.10: 2017 SF RWS Target and Actual Cumulative Water Savings 7-6 Figure 7.11: BAWSCA Member Agency Water Use Reductions, June 2014 to April Figure 7.12: BAWSCA Member Agency Conservation Standards and Total Water Use Reductions 7-8 Figure 7.13 BAWSCA Member Agency Per Capita Water Use, June 2015 to May Figure 7.14: Seasonal Water Use Variability and Cumulative Water Savings 7-10 Figure 7.15: Water Use Reduction Timeline 7-11 List of Tables Table 2.1. SWRCB Conservation Standards for BAWSCA Agencies 2-3 Table 2.2. Adjusted SWRCB Conservation Standards for BAWSCA Agencies 2-5 Table 2.3. Timeline of State Drought Actions 2-8 Table 2.4. Timeline of Local Drought Actions 2-9 Table 4.1. Drought Response Implementation by Member Agency 4-3 Table 4.2. Relative Perceived Effectiveness of Drought Response Actions. 4-6 Table 5.1. Fiscal Year and FY Minimum Purchase Requirements 5-2 Table 5.2. SF RWS Purchases during Drought for Agencies with Minimum Purchase Requirements 5-3 Table 5.3. Wholesale Water Rate Changes during Drought (FY to FY ) 5-4 Table 5.4. Wholesale Water Rate Changes during Drought (FY to FY ) 5-4 Table of Contents iii
6 List of Acronyms ACWD ACWA BAWSCA CWS CWD DWR EBMUD Eto EO GPCD GSA GVMID MAWA MOU mg mgd MWELO PREP R GPCD SFPUC SF RWS SCVWD SVCW SWRCB Alameda County Water District Association of California Water Agencies Bay Area Water Supply and Conservation Agency California Water Service County Water District Department of Water Resources East Bay Municipal Utilities District evapotranspiration Executive Order gallons per capita per day groundwater sustainability agency Guadalupe Valley Municipal Improvement District maximum applied water allowance Memorandum of Understanding million gallons million gallons per day Model Water Efficient Landscape Ordinance Potable Reuse Exploratory Plan residential gallons per capita per day San Francisco Public Utilities Commission San Francisco Regional Water System Santa Clara Valley Water District Silicon Valley Clean Water State Water Resources Control Board List of Acronyms SGMA WD WELO WSA Sustainable Groundwater Management Act Water District Water Efficient Landscape Ordinance Water Supply Agreement iv
7 Introduction
8

9 Introduction On January 17, 2014, following months of continued low precipitation, reduced snow pack levels, and diminishing water supplies in California s major rivers and reservoirs, Governor Edmund G. Brown, Jr. issued an proclamation declaring a Drought State of Emergency. Over the next three years, responding to the drought represented a substantial effort for the Bay Area Water Supply and Conservation Agency (BAWSCA) and its member agencies, as well as for state agencies and water suppliers throughout California. The purpose of the BAWSCA Drought Report (Report) is to document the drought response actions taken by BAWSCA, BAWSCA member agencies, and the State, and critical knowledge gained through these actions, during the 2014 to 2017 drought period. The report is intended to serve as a reference document for future drought response and planning efforts. FIGURE 1.1: CALIFORNIA DROUGHT CONDITIONS, JANUARY 28, About BAWSCA BAWSCA is a special district that provides regional water supply planning, water resource development, and conservation program services to enhance the reliability of the 16 cities, 8 water districts, and 2 private water providers that provide water to over 1.78 million people and 41,000 commercial, industrial and institutional accounts in Alameda, Santa Clara and San Mateo Counties. BAWSCA was enabled by a special act of the California Legislature and formed by its member agencies to protect the health, safety, and economic well-being of the people, businesses, and community organizations within its service area. BAWSCA s water management objective is to ensure a reliable supply of high quality water at a fair price. Additionally, BAWSCA is the only entity having authority under state law to directly represent the interests of its member agencies with San Francisco and its agent, the San Francisco Public Utilities Commission (SFPUC), in matters related to the San Francisco Regional Water System (SF RWS). BAWSCA provides the ability for the customers of the SF RWS to work with San Francisco on an equal basis to ensure that the agencies and their customers pay only their fair and correct share of SF RWS costs and to collectively and efficiently meet local water supply responsibilities. 1.2 Report Contents The Report includes: Introduction A timeline of the major drought actions by the State, SFPUC, and Santa Clara Valley Water District (SCVWD) (Section 2) BAWSCA drought response actions, including demand management actions, water supply actions, and regulatory and policy support provided (Section 3) 1-1
10 BAWSCA member agencies local drought response actions and member agency feedback on BAWSCA drought response activities (Section 4) Fiscal considerations, including fiscal impacts for BAWSCA, the SF RWS, and individual member agencies (Section 5) Water quality issues observed during the drought and responses taken (Section 6) Water use reductions achieved for the SF RWS and individual BAWSCA member agencies (Section 7) Lessons learned, as well as ongoing and potential future activities related to drought response (Section 8) Introduction 8/9/
11 Drought Actions and Timeline
12

13 Drought Actions and Timeline Between January 2014 and April 2017, Governor Brown and the State agencies implemented a series of actions to reduce water use throughout the State in response to drought conditions, many of which had significant implications for water suppliers. During this same period, the SFPUC and the SCVWD also issued calls for water use reductions in response to local water supply conditions. This section documents the State drought activities aimed at reducing water use, the regional call for conservation by SFPUC, and the calls for water use reductions by the SCVWD, which shares eight common customers with SFPUC. Drought response actions between January 2014, when the Governor declared a drought emergency, and April 2017, when the Governor declared an end to the drought emergency, are incorporated. State drought response actions not of direct relevance to BAWSCA, in particular those related to agricultural water use, are not included. Figure 2.1 Drought Timeline Overview 2.1 State Drought Actions Proclamation of a State of Emergency (January 2014) With California facing water storage shortfalls and diminishing water supplies in the state s major rivers and reservoirs, Governor Brown issued a proclamation of a State of Emergency and directed state officials to take all necessary actions to prepare for drought (Appendix A). Drought Actions and Timeline 8/9/ Proclamation of Continued State of Emergency (April 2014) On April 25, 2014, Governor Brown issued a proclamation of continued State of Emergency directing the SWRCB and DWR to expedite approvals of voluntary water transfers to assist areas of need. The proclamation called on Californians to take specific actions to avoid wasting water, including limiting lawn watering and car washing, limiting use of potable water for irrigation, asking hotels and restaurants to serve water only upon request, and preventing homeowners associations from fining residents that limit their lawn watering and take other conservation measures SWRCB Emergency Water Conservation Regulation (July 2014) On July 1, 2014, the SWRCB adopted an emergency drought regulation as a result of emergency drought conditions, the need for prompt action, and limitations in the existing enforcement process. The emergency regulation, which took effect on July 29, 2014, prohibited the specific water waste activities which were identified in the Governor s April 2014 proclamation, including: 2-1
14 The application of potable water to outdoor landscapes in a manner that causes runoff The use of a hose to wash a motor vehicle, unless the hose is equipped with a shut-off valve The application of potable water to driveways and sidewalks The use of potable water in a fountain or decorative water feature unless part of a recirculating system The emergency regulation also included the following mandatory actions for urban water suppliers: Implementation of the stage of an urban water supplier s water shortage contingency plan that imposes mandatory restrictions on outdoor irrigation, or limitation of outdoor irrigation of ornamental landscape to no more than two days per week Submittal of a monthly report on water use to the SWRCB The regulation required distributors of a public water supply that are not urban water suppliers to either limit outdoor irrigation of ornamental landscapes or turf to two days per week or to implement another mandatory conservation measure intended to achieve a comparable reduction in water use SWRCB Emergency Water Conservation Regulation (March 2015) On March 17, 2015, the SWRCB adopted a revised emergency drought regulation which continued the prohibitions on potable water use adopted in 2014 and added additional prohibitions. The additional water use restrictions included: Requiring restaurants and other food service establishments to serve water to customers on request only Requiring hotels and motels to provide guests with the option of not having towels and linens laundered daily and to prominently display notice of this option The revised regulation required urban water suppliers to limit the number of days per week that customers could irrigate outdoors and to specify this limit in their drought contingency plans. Urban water suppliers were also required to notify customers when they became aware of leaks within the customer s control. For distributors of a public water supply that are not urban water suppliers, the expanded regulation required that if they chose to implement alternate mandatory measures, in lieu of limiting outdoor irrigation to twice a week, those measures should be designed to achieve a 20 percent reduction in water consumption Executive Order B (April 2015) On April 1, 2015, Governor Brown issued B-29-15, which directed the SWRCB to impose restrictions to achieve a statewide 25 percent reduction in potable water usage through February 28, 2016, as compared to the amount used in EO B called for implementation of additional water use restrictions and enforcement activities by the SWRCB, including: Requiring commercial, industrial, and institutional properties to immediately implement water efficiency measures to reduce potable water usage in an amount consistent with the statewide water reduction targets Prohibiting irrigation with potable water of ornamental turf on public street medians Prohibiting irrigation with potable water outside of newly constructed homes and buildings, except via drip or microspray systems Directing urban water suppliers to develop rate structures and other pricing mechanisms to maximum water conservation Drought Actions and Timeline 8/9/
15 Requiring urban water suppliers to complete monthly reporting on water usage on a permanent basis Requiring frequent reporting of water diversion and use by water right holders In addition, EO B called for a range of actions from State agencies to assist with statewide water conservation, including: Implementation of a statewide lawn replacement program to replace 50 million square feet of turf with drought tolerant landscapes Implementation of a statewide appliance rebate program Update of the State Model Water Efficient Landscape Ordinance to increase water efficiency standards. Implementation of emergency regulations by the California Energy Commission establishing standards that improve efficiency of water appliances Implementation of Water Energy Technology program to deploy innovative water management technologies SWRCB Emergency Water Conservation Regulation (May 2015) On May 5, 2015, the SWRCB adopted a revised emergency water conservation regulation to implement specific provisions from EO B-29-15, including the mandatory 25 percent statewide reduction in potable urban water use between June 2015 and February The regulation also maintained prohibitions on specific water waste activities as well as monthly reporting requirements. This revised regulation took effect on June 1, To reach the statewide 25 percent reduction mandate, the emergency regulation assigned each urban water supplier a conservation standard that ranged between 8 percent and 36 percent based on the supplier s residential gallons per capita per day (R-GPCD) for the months of July to September Water suppliers whose source of supply did not include groundwater or water imported from outside their hydrologic region, and that had a minimum of four years of reserved water supply available, could apply to the SWRCB for a reduction of their conservation standards to 4 percent. Table 2.1 shows the conservation standard that was assigned to each BAWSCA member agency. The weighted average conservation standard for BAWSCA agencies overall was 15 percent. Drought Actions and Timeline 8/9/2017 Table 2.1 SWRCB Conservation Standards for BAWSCA Agencies Supplier Name Conservation Standard Supplier Name Conservation Standard Alameda CWD 16% Millbrae 16% Burlingame 16% Millbrae 16% CWS - Bear Gulch 36% Milpitas 12% CWS - Mid Peninsula 16% Mountain View 16% CWS - SSF 8% North Coast CWD 8% Coastside CWD 8% Palo Alto 24% Daly City 8% Redwood City 8% East Palo Alto 8% San Bruno 8% 2-3
16 Estero MID 12% San Jose 20% Hayward 8% Santa Clara 16% Hillsborough 36% Sunnyvale 16% Menlo Park 16% Westborough WD 8% Mid-Peninsula WD 20% Three BAWSCA member agencies (Brisbane/GVMID, Purissima Hills WD, and Stanford University) do not meet the urban water supplier size threshold and therefore did not have SWRCB assigned conservation standards. These agencies had the option to either reduce potable water use by 25 percent or to limit potable irrigation to two days per week Executive Order B (November 2015) On November 13, 2015, Governor Brown issued EO B-36-15, directing the SWRCB to extend water use restrictions to achieve a statewide reduction in potable water use through October 2016, should drought conditions continue. The EO also specified that the SWRCB should consider modifying the existing restrictions to address uses of potable and non-potable water and to incorporate insights gained from existing restrictions SWRCB Emergency Water Conservation Regulation (February 2016) As directed under EO B-36-15, the SWRCB extended the emergency conservation regulation in February 2016 based on drought conditions observed through January The new regulation provided some adjustments to conservation standards assigned to each water supplier for factors such as local climate, growth, and investment in drought-resilient supplies. None of the BAWSCA agencies received adjustments to their conservation standards. Given that a significant portion of the state s rainfall and snowpack occurs in February and March, the SWRCB directed staff to monitor and evaluate available data on precipitation, snowpack, reservoir storage levels. If conditions warranted, staff was directed to bring a proposal before the SWRCB to adjust or eliminate the emergency regulation in May Executive Order B (May 2016) On May 9, 2016, Governor Brown issued EO B directing State agencies to establish a long-term framework for water conservation and drought planning. EO B included four primary objectives: (1) use water more wisely, (2) eliminate water waste, (3) strengthen local drought resilience, and (4) improve agricultural water use efficiency and drought planning. In addition to the long-term conservation objectives, EO B also called for adjustments to the SWRCB emergency water conservation regulation to account for climate and local investments in drought-resilient water supplies in determining an urban water supplier s water reduction target SWRCB Emergency Water Conservation Regulation (May 2016) On May 18, 2016, the SWRCB adopted a revised emergency water conservation regulation. Consistent with the directives in EO B-37-16, the revision extended the emergency water conservation regulations through January 2017 and allowed for adjustment to urban water suppliers conservation standard based upon local water supply Drought Actions and Timeline 8/9/
17 conditions. The regulation maintained prohibitions on specific water waste activities as well as monthly reporting requirements. The revised regulation took effect on June 1, To determine each water supplier s conservation standard, each supplier had the option to complete a selfcertification of water supply reliability, or stress test, showing the water supplier s available water supplies should drought conditions continue for three additional years. A water supplier s new assigned conservation standard was equal to the percentage by which the supplier s total potable water supply was insufficient to meet total potable water demand in the third year. If an agency opted not to complete this self-certification, its conservation standard as assigned in prior version of the regulation would remain in effect. Each urban water supplier within BAWSCA opted to complete the self-certification, which resulted in the removal of mandatory conservation standards for all but three BAWSCA agencies, as shown in Table 2.2. Table 2.2 Adjusted SWRCB Conservation Standards for BAWSCA Agencies Supplier Name Conservation Standard CWS - Bear Gulch 2% Daly City 4% Sunnyvale 5% Agencies that are not urban water suppliers had the continued option to either reduce potable water use by 25 percent or to limit potable irrigation to two days per week SWRCB Emergency Water Conservation Regulation (February 2017) On February 8, 2017, the SWRCB extended the emergency conservation regulation for 270 days. Given hydrologic conditions, the SWRCB modified the regulation to add language directing the Executive Director to consider promptly modifying or repealing the regulation if the Governor lifted the declaration of a drought state of emergency. The revised regulation also required the SWRCB to meet in May 2017 to consider repealing the regulation based on hydrologic conditions if the regulation remained in effect on May 1, Drought Actions and Timeline 8/9/ Executive Order B On April 7, 2017, Governor Brown issued EO B (Appendix A), which ended the drought state of emergency in most of California, while maintaining water reporting requirements and prohibitions on wasteful practices, such as watering during or right after rainfall. EO B lifted the drought emergency in all California counties except Fresno, Kings, Tulare and Tuolumne, where emergency drinking water projects will continue to help address diminished groundwater supplies. EO B built on long-term conservation actions taken in EO B-37-16, which remain in effect, including the continuation of SWRCB urban water use reporting requirements and prohibitions on wasteful practices such as watering during or after rainfall, hosing off sidewalks and irrigating ornamental turf on public street medians SWRCB Rescinds Portion of Emergency Water Conservation Regulation On April 26, 2017, the Executive Director for the SWRCB rescinded the water supply stress test requirements and remaining mandatory conservation standards for urban water suppliers, as well as the requirements for small water 2-5
18 suppliers. This action was in response to EO B ending the drought state of emergency and transitioning to a permanent framework for making water conservation a way of life. Prohibitions against wasteful water use practices and requirements for monthly water reporting remained in place Making Conservation a California Way of Life Long-Term Conservation Framework On April 7, 2017, concurrent with EO B-40-17, the State agencies released the Making Water Conservation A California Way of Life, Implementing Executive Order B final framework report. This report addresses the long-term water use efficiency requirements called for in EO B and provides information to the Legislature and other interested parties on the State agencies proposed framework for efficient water use and proposed implementation timeline. The report proposes a suite of actions that can be implemented using existing authorities, as well as additional actions and authorities that require legislative action to expand statutory authorities. 2.2 SFPUC Drought Actions SFPUC s drought response actions with regard to the wholesale customers included both actions to reduce water demands, such as requesting voluntary reductions in water use, and actions to improve water supply availability, specifically the emergency rehabilitation of Lower Cherry Aqueduct. These actions are described below SFPUC Request for Conservation On January 31, 2014, SFPUC formally issued a request for customers of the San Francisco Regional Water System (SF RWS) to voluntarily curtail water use by 10 percent. This request was intended to avert mandatory cutbacks and other water restrictions should drought conditions persist. The SFPUC news release regarding this request can be found in Appendix C. Following the request for 10 percent reduction, SFPUC issued a one-time waiver of the minimum purchase requirements of Mountain View, Sunnyvale, Milpitas, and Alameda County Water District (ACWD) for up to 10 percent of their minimum purchase requirements (Appendix D). This waiver was extended, with modifications, through FY Additional information on minimum purchase requirements during the drought can be found in Section The SFPUC request for a 10 percent reduction in water use was extended through FY On February 1, 2017, SFPUC issued its initial water supply availability estimate for water year 2017, which indicated that SFPUC did not anticipate needing to request demand reductions for the retail and wholesale service areas. The final water supply availability estimate released on April 4, 2017 (Appendix E) confirmed that there was no longer a need for voluntary reductions in water use, as the water available to SFPUC had well exceeded what was needed to fill the entire water system by July 1, The SFPUC continued support for the ongoing wise use of water and overall water conservation Lower Cherry Aqueduct Emergency Rehabilitation Project The Lower Cherry Aqueduct system conveys water supply from Cherry Creek that can supplement the primary Hetch Hetchy Reservoir system during a drought year. At the onset of the drought in 2014, the Lower Cherry Aqueduct system was unable to reliably convey this supplemental water due to aging infrastructure and damage caused by the Rim Fire in August On March 11, 2014, the San Francisco Board of Supervisors adopted a resolution supporting emergency drought relief and the restoration of Lower Cherry Aqueduct to augment water supplies during the drought. Drought Actions and Timeline 8/9/
19 Phase 1 of the Lower Cherry Aqueduct rehabilitation, which involved emergency repairs to bring the aqueduct back into service, was completed in October 2014 at a total cost of $9 million. Completion of this project enabled SFPUC to access up to 200,000 acre-feet of water stored in Cherry Lake. Phase 2 additional improvements are planned for construction in 2018 at an estimated cost of $4M. SFPUC was also awarded $3 million in Proposition 84 Integrated Regional Water Management grant funding from DWR to partially offset the total project cost. 2.3 SCVWD Request for Water Use Reductions On January 28, 2014, the SCVWD set a preliminary 2014 water reduction target of 10 percent of 2013 water use in Santa Clara County. The target was based on the district s adopted water shortage contingency plan, which calls for the district s board to consider a reduction in water use of up to 10 percent when the county s groundwater supplies are projected to drop below 300,000 acre-feet by the end of the calendar year. On February 24, 2014, in consideration of a worsening water supply outlook for Santa Clara County, the SCVWD increased its call for water use reductions to 20 percent and called upon water retailers within the county to implement mandatory measures as needed to achieve this reduction target. The primary driver for this increased water use reduction request was the worsening of end of year groundwater storage projections as a result of the reduced allocations of imported water from the State and federal water projects. The State Water Project s preliminary allocation was reduced to zero on January 31, , potentially impacting the district s ability to transfer water, and the Central Valley Project allocation was also at zero 2. On November 25, 2014, the SCVWD extended the call for a 20 percent countywide reduction in water use until June 30, Due to worsening drought conditions and water supply projections, the SCVWD increased its countywide water use reduction target to 30 percent on March 24, As part of this action, SCVWD also called upon local water providers to restrict irrigation of outdoor landscapes with potable water to two days per week and to implement whatever mandatory measures were necessary to reach the 30 percent reduction target in their respective service areas. This action was driven severity of drought and worsening water supply projections, including projected end of year groundwater storage to be in the Critical stage of the Water Shortage Contingency Plan. On November 25, 2015, the SCVWD extended this call for conservation through June 30, Drought Actions and Timeline 8/9/2017 On June 14, 2016, in light of improved water supply conditions, SCVWD revised call for water use reductions to 20 percent and recommended an increase in allowable days for outdoor irrigation to three days per week. SCVWD extended this call for 20 percent reductions on January 31, 2017, but eliminated the call for local water providers to implement mandatory conservation measures. On June 13, 2017, SCVWD again extended its call for a 20 percent reduction in water use. 1 The 2014 State Water Project allocation was increased back to 5 percent on April 18, The 2014 final CVP allocations was 50 percent for municipal and industrial uses and zero for irrigation for a total of 65,000 acre-feet 2-7
20 Table 2.3: Timeline of State Drought Actions Date State Drought Action January 17, 2014 April 25, 2014 July 29, 2014 March 17, 2015 April 1, 2015 June 1, 2015 November 13, 2015 March 1, 2016 May 9, 2016 June 1, 2016 February 8, 2017 April 7, 2017 April 26, 2017 Governor Brown proclaims a drought State of Emergency and directs State officials to take the necessary actions to prepare for drought conditions. Governor Brown proclaims Continued State of Emergency due to drought conditions and requests reduction of specific water using activities. SWRCB conservation regulation prohibiting specific water wasting activities statewide takes effect. SWRCB adopts revised conservation regulation addition additional prohibitions on potable water use. Governor Brown issues EO B calling on State Board to impose restrictions to achieve a statewide 25% reduction in potable urban water usage. SWRCB conservation regulation mandating water conservation standard (percent reductions) for urban water suppliers takes effect. Governor Brown issues EO B-36-15, directing the SWRCB to extend water use restrictions if drought conditions continue. SWRCB conservation regulation reducing water conservation standards for select water suppliers based on climate variability takes effect. Governor Brown issues EO B calling for adjustments to emergency regulation and the development of long-term water use targets. SWRCB regulation with new drought conservation standards based on water supplier self-certification and "stress test" of supply reliability takes effect. SWRCB extends emergency conservation regulation, including water waste prohibitions and water supplier self-certification requirements. Governor Brown issues EO B-40-17, terminating the Drought State of Emergency, and Making Conservation a California Way of Life Final Report. SWRCB rescinds stress test requirements and all mandatory water conservation standards. Drought Actions and Timeline 8/9/
21 Table 2.4: Timeline of Local Drought Actions Date Local Drought Action January 28, 2014 January 28, 2014 February 25, 2014 March 7, 2014 SCVWD Board of Directors sets a preliminary 2014 water use reduction target of 10 percent of 2013 countywide water use. SFPUC calls for 10 percent voluntary reduction in water use. SCVWD increases countywide reduction target to 20 percent and recommends that retail agencies and municipalities implement mandatory measures. SFPUC issues waiver of minimum purchase requirements. July 2, 2014 SFPUC extends waiver of minimum purchase requirements through FY October 2014 SFPUC completes Lower Cherry Aqueduct emergency rehabilitation. November 25, 2014 SCVWD extends call for 20 percent water use reductions through June March 24, 2015 SCVWD calls for 30 percent water use reductions and recommends that retailers implement mandatory measures and two day per week irrigation schedule. April 15, 2015 SFPUC extends waiver of minimum purchase requirements through FY November 24, 2015 SCVWD extends call for 30 percent water use reductions through June June 14, 2016 SCVWD revises call for water use reductions to 20 percent and recommends increase in allowable days for outdoor irrigation to three days per week. June 23, 2016 SFPUC extends waiver of minimum purchase requirements through FY January 28, 2017 SCVWD calls for 20 percent water use reduction, continued water waste prohibitions, and three day per week irrigation limits. February 1, 2017 SFPUC releases initial water supply availability estimate for water year 2017 indicating no anticipated demand reduction request. April 4, 2017 SFPUC releases final water supply availability estimate for water year 2017 indicating no further need for voluntary reductions in water use. June 13, 2017 SCVWD extends call for 20 percent water use reduction. Drought Actions and Timeline 8/9/

22 Figure 2.2 U.S. Drought Monitor, California, January 2014 through January 2017 Source: Drought Actions and Timeline 8/9/


23 2-11 Figure 2.3: Timeline of State and Local Drought Actions
24
25 BAWSCA Drought Response Actions
26
27 BAWSCA Drought Response Actions This section documents the actions taken by BAWSCA in response to the drought. These actions fall into three categories: 1) demand management actions to reduce water use, including public information and water conservation programs; 2) water supply actions; and 3) regulatory and policy support. 3.1 Demand Management Actions During the drought, BAWSCA s demand management actions included both drought-specific communication and outreach programs, aimed at educating the public about the water supply conditions and the need for reductions in water use, and long-term water conservation programs, through BAWSCA s Regional Water Conservation Program, to support customers in reducing their use Communication and Outreach BAWSCA s communication and outreach activities were intended to increase public awareness of the drought and to educate the public on ways to reduce water use. These activities were designed to supplement the public education programs and conservation program marketing that BAWSCA and its member agencies implement on an ongoing basis in order to achieve immediate water use reductions. BAWSCA s communication and outreach activities, each of which is described below, included: Regional Drought Messaging Campaign with SFPUC Regional Drought Messaging Materials Drought Messaging Materials Bulk Purchase Program Expanded Community Outreach Water Conservation 101 Workshops BAWSCA Website Redesign and Updates Regional Outdoor Watering Schedule Regional Drought Messaging Campaign To assist its member agencies in achieving the targeted water use reductions, BAWSCA coordinated with SFPUC to implement a public information campaign in 2014 and The Regional Drought Campaign encouraged customers to take specific actions to reduce their water use, such as taking shorter showers, fixing leaks, and reducing watering. BAWSCA Drought Response Actions The Regional Drought Campaign artwork and video public service announcement were developed in-house by SFPUC staff. A media buyer, contracted by SFPUC, secured the ad space and coordinated the campaign implementation. BAWSCA collaborated with SFPUC on the campaign themes, messaging, and timing. This approach enabled BAWSCA and the member agencies to leverage the expertise of SFPUC s communications team and to facilitate consistent messaging regionally. A broader regional media buy, in partnership with other major Bay Area water agencies, was considered in early However, it was determined that this approach would not be feasible due to the differences in water supply conditions and associated messaging across the Bay Area water agencies. Hence, BAWSCA and SFPUC made the decision to move forward with a Regional Drought Messaging Campaign for only the SF RWS service area. 3-1

28 Through discussions with ACWD staff as well as staff of the common customers with SCVWD, it was determined that ACWD and SCVWD were independently implementing messaging campaigns in their respective services areas to support their calls for 20 percent reduction in water use. To avoid potentially conflicting messaging, the SFPUC/BAWSCA Regional Messaging Campaign was targeted to the City and County of San Francisco, San Mateo County, and the City of Hayward. In addition, campaign materials were developed to focus on specific actions customers could take to reduce water use, rather than on reduction percentages, to prevent customer confusion. The 2014 Regional Drought Campaign ran from July through November. The campaign included billboard advertisements, online video through YouTube and Google ads, movie theater public service announcements, and BART station advertisements. The campaign was largely considered to be successful at increasing customer awareness and heightening interest in conservation. For example, during the campaign period, BAWSCA received 300,000 YouTube views of its conservation message and doubled its website traffic. The 2015 regional drought messaging campaign launched on June 15 th and continued through the summer. The purpose of the campaign was to provide a strong visual and attention-grabbing marketing to support and reinforce continued water conservation in the BAWSCA service area. Campaign themes included reduction to outdoor irrigation, turf removal, leak repair, and behavioral changes. The campaign composition included outdoor billboards, newspaper ads, television advertisements, and YouTube. FIGURE 3.1 SFPUC-BAWSCA CAMPAIGN ARTWORK The total cost to the BAWSCA agencies for the 2014 and 2015 media campaigns was $212,524, collected throught he Wholesale Revenue Requirement. In addition to the regional media buys implemented through SFPUC, all drought campaign materials were made available to the BAWSCA member agencies for use in their individual outreach efforts. The primary artwork for the 2014 and 2015 drought campaigns can be found in Appendix F Regional Drought Messaging Materials While the Regional Drought Messaging Campaign was still in development, BAWSCA received requests from several member agencies for drought messaging materials that could be used to notify customers about the water supply situation and encourage efficient use of water as soon as possible. To support this need, BAWSCA developed a suite of electronic images that could be customized as needed and used by individual agencies in their customer outreach. The materials were primarily adapted from the Sonoma County Water Agency drought messaging campaign with their approval. BAWSCA initially distributed the electronic images to the member agencies in March 2014 and provided support for agencies in modifying the materials for local use through BAWSCA also coordinated customization of the Regional Drought Messaging Campaign images for local use once those materials were made available by SFPUC. Fifty-six percent of the BAWSCA member agencies reported use of the regional drought messaging materials. Sample graphics from the regional messaging materials can be found in Appendix G. BAWSCA Drought Response Actions 8/9/

29 Drought Messaging Materials Bulk Purchase Program In addition to developing electronic messaging materials, BAWSCA implemented a bulk purchase program through which member agencies could order outreach materials, customized for each individual agency, to educate their customers about the drought. The bulk purchase program included the following items: Door hangers for customer notifications Bumper stickers Water on Request restaurant table cards Lawn signs The bulk purchase program was launched in April 2014 and continued through Twenty-eight percent of the BAWSCA member agencies reported participating in the bulk purchase program Expanded Community Outreach In FY , BAWSCA partnered with San Mateo County Energy FIGURE 3.2 SAMPLE RESTAURANT TABLE CARD FROM BAWSCA PROGRAM Watch (SMCEW) to co-fund a fellowship position for water conservation community outreach. The goal of the partnership was to inform the public about several regional water conservation initiatives and programs, including the Lawn Be Gone! Program, High Efficiency Toilet Rebate Program, Rain Barrel Rebate Program, and Landscape Education Program. In addition to contacting community organizations and tabling at local events, the fellow visited hardware, home improvement, gardening, and landscaping retail store to provide information about the programs and to distribute marketing materials. The fellowship was a 10-month position through the Americorps CivicSpark Program, which is managed by the Local Government Commission. The total cost to BAWSCA was $11,200, a portion of which was allocated to the subscription conservation programs Water Conservation 101 Workshops In response to requests from the public, BAWSCA launched a Water Conservation 101 public education program in May The purpose of the program was to provide the general public with valuable information on water supply conditions and ways to reduce water use. Topics covered in each class included: BAWSCA Drought Response Actions Water sources and water supply conditions State and local drought impacts and water use restrictions Biggest water uses within the home Ways to reduce indoor and outdoor water use Leak detection How to report water waste BAWSCA and member agency water conservation programs and rebates This public education program provided two-hour classes, taught by BAWSCA staff or a contracted instructor in conjunction with member agency staff, and were offered free of charge to the public. Similar to BAWSCA s Landscape Education Program, BAWSCA member agencies interested in hosting a class provided the class location 3-3
30 and staff support, while BAWSCA provided the instructor and registration. Classes were available on request for BAWSCA member agencies and were also provided to other public entities, such as local libraries, upon request. In FY , BAWSCA held 21 classes in partnership with 11 member agencies, with an average of attendees per class. This program may be offered during future drought periods but will not be continued on an annual basis BAWSCA Website Redesign and Updates In 2014, the BAWSCA website experienced increased traffic as members of the public, as well as BAWSCA member agencies and elected officials, sought information on the drought situation and water conservation. BAWSCA s website, which had been established in 2003 and had not been significantly updated since, had been designed to provide general information about BAWSCA to the public and others and was not sufficiently equipped to provide emerging information about drought and water conservation activities. Redevelopment of the BAWSCA website was initiated in July 2015 and the new website launched on February 22, The new website includes a separate water conservation portal, which is specifically designed for water customers seeking information about water conservation. The website includes a variety of infographics to make key water supply and water use data more accessible, as well as a drought section that was updated regularly with current information on SFPUC and State water use reduction requests and water savings achieved Regional Outdoor Watering Schedule In April 2015, BAWSCA member agencies expressed significant interest in adopting a consistent watering schedule throughout the BAWSCA service area in response to State requirements and local water use reduction targets. The goal of the consistent schedule was to simplify customer communication and enable regional public information on watering restrictions. The concept of a regional watering schedule was initially proposed in Santa Clara County. The regional schedule for the BAWSCA agencies was consistent with the Santa Clara County schedule. Sixty-eight percent of BAWSCA member agencies adopted the regional irrigation schedule (see Table 4.1). For agencies that implemented the regional irrigation schedule, irrigation was limited to two specific days per week. Properties with odd number addresses were allowed to irrigate on Mondays and Thursdays, and properties with even addresses were allowed to irrigate on Tuesdays and Fridays. Irrigation was limited to 15 minutes per day per irrigation station. Agencies were encouraged to incorporate language that provided the flexibility to adjust the irrigation schedule in the future without Board or Council action. In addition, many agencies incorporated exceptions to the irrigation schedule into their ordinances, such as: FIGURE 3.3 REGIONAL WATERING SCHEDULE MESSAGING Alternative compliance option of monthly water budgets for large landscape sites, enabling these accounts to irrigate on a different schedule provided that they stayed within their allotted water budgets BAWSCA Drought Response Actions 8/9/
31 Exceptions to irrigation stations that exclusively use very low-flow, drip-type systems Exemptions for public safety on sites where maintaining landscape health is critical, such as sports fields Regional Water Conservation Programs BAWSCA s Regional Water Conservation Program is made up of several different programs and initiatives designed to support and augment member agency and customer efforts to use water more efficiently. The Regional Water Conservation Program includes both core programs, implemented throughout the BAWSCA service area, and subscription programs, each of which is implemented within and funded by the specific BAWSCA member agencies that elect to participate. To support drought response, BAWSCA accelerated implementation of new initiatives, expanded outreach activities, and worked with member agencies to increase rebate amounts and expand programs to new areas Model Water Efficient Landscape Ordinance Update Governor Brown s Drought Executive Order of April 1, 2015 (EO B-29-15) directed DWR to update the State s Model Water Efficient Landscape Ordinance (MWELO) through expedited regulation in order to address the current four year drought and build resiliency for future droughts. The California Water Commission approved the revised MWELO on July 15, This new ordinance required all land-use agencies, such as cities and counties, to adopt a water-efficient landscape ordinance that, at minimum, meets the requirements of the CA MWELO prepared by DWR. DWR s model ordinance took effect in those cities and counties that failed to adopt their own. Cities acting on their own were required to adopt their updated WELO by December 1, However, agencies adopting a regional ordinance had a deadline of February 1, To support member agencies in complying with this requirement, BAWSCA coordinated the development of a template regional model ordinance for member agencies to use as guidance in updating their local codes. The new BAWSCA regional model ordinance updated the previous BAWSCA regional model ordinance, which was developed in The major changes in the DWR and BAWSCA ordinances included: BAWSCA Drought Response Actions Reduction of the size threshold subject to the WELO ordinance from 2,500 square feet of landscaping to 500 square feet of landscaping for both commercial and residential property. Lowering of the maximum applied water allowance (MAWA) from 70% of the reference evapotranspiration (ETo) to 55% for residential landscape projects, and to 45% of ETo for non-residential projects, effectively reducing the landscape area that can be planted with high water use plants such as cool season turf Enabling irrigation efficiency to be entered for each area of the landscape, rather than only site-wide Increased State reporting requirements. Changes to the landscape and irrigation design plans Incorporation of option to irrigate with greywater Water Wise Gardening Website Update (Watering Calculator) To support outdoor water use reductions, BAWSCA updated its Water Wise Gardening website to include a new feature, the Watering Calculator. The Watering Calculator creates a monthly water schedule for website visitors customized to the individual landscape, based upon: Location Plant type 3-5
32 Irrigation system Shade and slope characteristics As part of the update, the website appearance was also updated and the website address was changed to The enhanced Water Wise Gardening website was launched in February In summer 2015, the Watering Calculator was also updated to include irrigation restrictions for each BAWSCA member agency that were implemented during the drought Home Water Report Program Implementation Prior to the drought, several BAWSCA agencies expressed interest in the implementation of a Home Water Reports Program as a potential new subscription program under the Regional Water Conservation Program. In FY , to support drought response, BAWSCA accelerated the implementation of this new program and contracted with WaterSmart Software to implement this program. The Home Water Reports Program develops and delivers individual household reports that use data analytics and behavioral science techniques to provide customized water consumption information, messaging, and water saving recommendations. The object of the Program is to motivate customers to improve water use efficiency through changes in behavior or adoption of more water efficient technology by increasing customer awareness of household water usage when compared to peers. Three agencies participated in the Home Water Use Reports Program in FY During that time WaterSmart Software sent bi-monthly reports to approximately 50,350 residential accounts enrolled in the program. The program resulted in water use reductions of between 3 and 5 percent within participating households, above and beyond the drought water savings achieved by households that did not receive the reports. BAWSCA is continuing this program through FY at a minimum, and four agencies are currently participating Increased Lawn Be Gone! Rebate Amounts The BAWSCA Lawn Be Gone! Program, launched in FY , provides rebates to customers of participating agencies for replacing their lawns with water-efficient landscaping. Prior to the drought, BAWSCA member agencies offered rebates of $0.75 per square foot of lawn replaced, with a maximum rebate amount of $1,000 for residential single-family sites and $5,000 for multi-family residential and non-residential sites. Program participation had been limited prior to the drought, with an average of 16 rebates per year issued for the first three years of the program. To encourage increased participation in the Lawn Be Gone! Program in order to reduce outdoor water use during the drought, BAWSCA and participating member agencies made the following changes to the Lawn Be Gone! Program: Increased rebate amounts to $1 to $4 per square foot of lawn replaced, depending on the participating agency Removed the maximum rebate cap In FY , to support the need for immediate water use reductions to meet State requirements, the Lawn Be Gone! Program did not permit plant installations during the dry season (July 1 st to October 15 th ). During this period, notices to proceed specified that planting could only be completed after October 15 th, and customers were given 4 months from the notice to proceed date to complete their projects. Customers were encouraged to submit their applications before or during the dry season and to stop watering their lawns once they receive notice to proceed from their water agency. BAWSCA Drought Response Actions 8/9/
33 As a result of the increased rebate amounts, additional marketing, and heightened interest in water conservation, Lawn Be Gone! participation increased by 588% from FY to FY A total of 100 rebates were issued in FY , and 93 rebates were issued in FY Grant Funding for Water Conservation Programs In November 2014, BAWSCA was awarded $535,000 in grant funding from the Proposition 84 Integrated Regional Water Management 2014 Drought Grant Solicitation, as part of the San Francisco Bay Area Region s application. These funds partially reimbursed activities for BAWSCA conservation rebate programs including Lawn Be Gone! Rebates, High Efficiency Toilet Rebates, and Washing Machine Rebates. These funds are being distributed to BAWSCA member agencies that participate in the eligible rebate programs to offset the program costs. 3.2 BAWSCA Water Supply Actions Prior to the drought, BAWSCA was pursuing the Long-Term Reliable Water Supply Strategy (Strategy) to both identify the water supply need of the BAWSCA member agencies in the future and identify water supply actions to meet that need. The Long-Term Reliable Water Supply Strategy Phase II Final Report (Strategy Report), published in February 2015, represents a nearly five year effort by BAWSCA and its member agencies to identify appropriate water management actions that provide long-term water supply reliability for the region (BAWSCA, 2015). For the Strategy Report, BAWSCA performed a comprehensive assessment of the regional water supply needs through the year 2040, evaluated potential water supply projects that could be implemented to meet these needs, and identified a suite of actions to achieve increased regional reliability. As a result of the drought, adjustments were made to some of BAWSCA ongoing Strategy implementation actions to address emerging regulatory requirements and changing circumstances for BAWSCA s project partners. In addition, action toward implementation of potable reuse projects was accelerated due to heightened interest from potential project partners BAWSCA Pilot Water Transfer The Long-Term Reliable Water Supply Strategy Phase IIA Report (Strategy Phase IIA Report) (BAWSCA, 2012) identified water transfers from sources (sellers) outside the BAWSCA service area as a promising option to address the dry year reliability needs of the BAWSCA member agencies. The initial analysis done in the Strategy Phase IIA Report estimated that the costs of pilot water transfer are lower compared to other alternative supplies, resulting from the fact that a water transfer utilizes existing infrastructure and is a supply that could be obtained only in dry years. A key recommendation presented in the Strategy Phase IIA Report was that BAWSCA develop a plan for a pilot water transfer with either the East Bay Municipal Utility District (EBMUD) or the SCVWD. BAWSCA Drought Response Actions Work to implement a pilot water transfer was underway before the drought; however, the drought necessitated significant changes to the course of work and provided valuable insights on the implementation of a pilot water transfer during times of shortage. Key actions and conclusions for pilot water transfer efforts with EBMUD and SCVWD are described below EBMUD Pilot Water Transfer In 2013, BAWSCA and EBMUD completed the BAWSCA EBMUD Short-Term Pilot Water Transfer Plan (Pilot Plan; EBMUD and BAWSCA, 2013), which evaluated the feasibility of partnering as buyers on long-term water transfer projects to improve future water supply reliability for the respective agencies. The Pilot Plan identified five key agreements necessary to conduct the Pilot Water Transfer. 3-7
34 BAWSCA and EBMUD signed a second Memorandum of Understanding (MOU) in January 2014 to implement the second phase of work on a pilot water transfer plan ( Memorandum of Understanding between East Bay Municipal Utility District and the Bay Area Water Supply and Conservation Agency for the Development of the Second Phase of a Short-Term Pilot Water Transfer Plan ). This second phase of work on the pilot water transfer plan (Phase II) included drafting, revising and finalizing necessary agreements between BAWSCA, Yuba County Water Agency (YCWA), EBMUD, Hayward, and the SFPUC; preparing draft environmental compliance documentation; and ongoing coordination between BAWSCA and each of the other agencies involved in a potential pilot water transfer. The Pilot Plan anticipated that finalizing a water purchase agreement and the BAWSCA-EBMUD wheeling agreement and preparing documentation necessary for environmental review and regulatory agency approvals would be pursued in a drought year, when it was anticipated that EBMUD would operate the Freeport Regional Water Project (EBMUD and BAWSCA 2013). Instead, right after the start of Phase II, it became clear that drought conditions were worsening such that EBMUD would be initiating the use of the FRWP immediately. As such, all of the documentation needed to implement the pilot transfer needed to be pursued concurrently. The drought changed the course of work during Phase II: it motivated progress towards completing agreements and environmental compliance, but also highlighted some further challenges for water transfer implementation. BAWSCA learned a considerable amount about the implementation of water transfers during the Phase II process, described in more detail in the Technical Memorandum: BAWSCA-EBMUD Pilot Water Transfer Phase II Pilot Plan (Appendix H). BAWSCA and EBMUD contemplated implementing the pilot water transfer in the spring of 2014, but the timeframe for completing all of the agreements, gaining all of the regulatory approvals, and fulfilling all environmental compliance obligations was too short. Beginning in April 2015, EBMUD operated the Freeport Regional Water Project to deliver supplemental supplies to the EBMUD service area, but did not have any additional capacity to wheel water for BAWSCA for the rest of the calendar year due to its own water supply conditions. BAWSCA is potentially looking to implement the transfer during the planned Hetch Hetchy shutdown in late 2018 for Mountain Tunnel repairs and is currently working with project partners to finalize implementation agreements SCVWD Pilot Water Transfer Consistent with the Strategy, BAWSCA has also been in discussions with the SCVWD on pursuing a pilot water transfer. In July 2014, BAWSCA and SCVWD finalized the Memorandum of Understanding Agreement A3754M between the Santa Clara Valley Water District and the Bay Area Water Supply and Conservation Agency, which lays out the tasks, roles, and responsibilities for the development of a short-term pilot water transfer plan. This plan would provide vital information on partnering for future long-term and/or dry year transfers. Staffing issues at SCVWD prevented the work outlined in the MOU between BAWSCA and SCVWD from proceeding. However, BAWSCA has been checking in regularly with SCVWD staff and both parties agree that pursuing a pilot water transfer would be beneficial to the agencies Potable Reuse Projects BAWSCA s Strategy recommended continued monitoring of indirect and direct potable reuse opportunities as public perception, regulatory considerations, and technical hurdles were addressed. With heightened interest in alternative water supplies driven by the drought, potable reuse projects have begun to receive greater consideration in the Bay Area. During the drought, BAWSCA began exploring opportunities for potential potable reuse projects and, as a result, entered into two agreements to evaluate potential potable reuse projects, each of which is described below. BAWSCA Drought Response Actions 8/9/
35 Silicon Valley Clean Water Potable Reuse Exploratory Plan In early 2015, BAWSCA began discussions on potable reuse opportunities with Silicon Valley Clean Water (SVCW), a water resource recovery facility for Belmont, San Carlos, Redwood City, and West Bay Sanitary District. SVCW currently provides approximately 2 mgd of tertiary treated recycled water to Redwood City for non-potable reuse purposes. SVCW s interest in potable reuse was driven by anticipated new effluent regulations from the San Francisco Regional Water Quality Control Board to reduce the concentration of nutrients in its effluent. To address these new regulations, SVCW identified recycled water as an option to reduce effluent nutrient concentrations, reduce costs to treat, and help reduce nutrients to the Bay. In November 2016, BAWSCA entered into an MOU with Cal Water, SFPUC, and SVCW to study the potential opportunities for potable reuse and develop a Potable Reuse Exploratory Plan (PREP). The PREP will explore the benefits, challenges, and feasibility of potable reuse to address water supply reliability concerns and drought preparedness. The not-to-exceed cost for the PREP feasibility study is $56,000, of which $31,000 will be paid by SFPUC and shared with the BAWSCA member agencies via the Wholesale Revenue Requirement. The PREP is anticipated to be complete in summer SCVWD Expedited Purified Water Program SCVWD s Expedited Purified Water Program (Program) is currently evaluating the potential to develop up to 45,000 acre-feet per year (40 mgd) of purified water capacity by 2025 to augment water supply in Santa Clara County via indirect and potential direct potable reuse. The Program is part of SCVWD s strategy to respond to the drought, which prompted increasing urgency for SCVWD to expedite the Program to mitigate the risk of land subsidence and salt water intrusion. As part of its Program, SCVWD may develop capacity to produce additional water supplies that could be available to the BAWSCA member agencies common to the SCVWD. The project has the potential to provide between 5 and 15 mgd of new water supply to SFPUC and the BAWSCA member agencies, while providing SCVWD with the financial benefit resulting from increased use of their purified water facilities. BAWSCA Drought Response Actions An MOU between BAWSCA, SCVWD, and SFPUC for completion of a Feasibility Study was executed in This Feasibility Study includes two distinct phases: 1) prepare an initial screening with sufficient information for BAWSCA, SCVWD, and SFPUC to determine whether to proceed with continued analysis of a water supply project to supply between 5-15 MGD in excess of SCVWD s needs, which can be made available to SFPUC/BAWSCA customers within Santa Clara County; and 2) if the initial screening demonstrates that a project(s) is viable, prepare a technical memorandum specifying in detail an arrangement in which the SFPUC/BAWSCA can commit financial and other resources to the SCVWD in exchange for the right to receive water supplies from SCVWD s Program. The estimated cost of the Feasibility Study is $59,000, which will be split between SCVWD and SFPUC, with the BAWSCA agencies share of the study collected through the Wholesale Revenue Requirement. Completion of the Feasibility Study is anticipated in FY Groundwater Reliability In 2014, California enacted the Sustainable Groundwater Management Act (SGMA), which provides a framework for sustainable management of groundwater supplies by local authorities, with a limited role for State intervention if necessary to protect the resource. The act requires the formation of local groundwater sustainability agencies (GSAs) that must assess conditions in their local water basins and adopt locally-based management plans. While a State 3-9
36 framework on groundwater management has historically been unable to gain traction in the legislature, the SGMA legislation gained the necessary momentum amid growing concerns about the drought, in particular increased well drilling during the drought and declining water levels underground. The implementation of SGMA raised questions regarding groundwater management requirements and possibilities. BAWSCA s actions to support its member agencies interests in groundwater reliability are described below Groundwater Reliability Partnership In 2015, BAWSCA led the formation of a Groundwater Reliability Partnership for the San Mateo Plain Subbasin (Partnership) to provide a forum for groundwater users and other stakeholders to share information and work toward an agreed upon set of goals. The San Mateo Plain Subbasin (Basin) underlies the cities of East Palo Alto, Menlo Park, Redwood City, San Carlos, Belmont, San Mateo, Foster City, Burlingame, and the Town of Hillsborough. As the Basin is overlain primarily by BAWSCA member agencies that utilize the Basin supplies to varying degrees, BAWSCA has a direct interest in ensuring the reliability of the Basin. BAWSCA has taken a lead role in promoting sustainable use of groundwater resources in its service area by establishing the Partnership. BAWSCA s direct interests in this effort relate to BAWSCA s investigation and potential development of a brackish groundwater project as part of the Strategy. BAWSCA s member agencies in all three counties have an interest in the Basin due to the interrelationship with all neighboring groundwater basins (e.g. the Niles Cone sub-basin in the East Bay and the Santa Clara sub-basin in Santa Clara County). Since 2015, BAWSCA has held periodic meetings for the Partnership to foster stakeholder engagement. The goals of the Partnership are increasing understanding of the hydrology and geology of the Basin, serving as a forum for sharing information among all stakeholders, and continued sustainable use of the Basin to maintain groundwater quality and quantity and protect beneficial uses. Meeting topics have included updates on the implementation of California s 2014 groundwater legislation, the Sustainable Groundwater Management Act (SGMA), as well as local efforts in the Basin and adjacent basins. BAWSCA also hired a consultant to support BAWSCA s efforts related to groundwater and the Partnership County of San Mateo Groundwater Assessment Plan In 2015, San Mateo County initiated a groundwater basin assessment of the San Mateo Plain Subbasin to assess the groundwater resources and current condition of the Basin and identify potential groundwater management strategies. The project is funded by Measure A, a countywide half-cent general sales tax passed by voters in BAWSCA supports efforts to gather more data about the subbasin and has worked cooperatively with the County on this effort by: Providing the County with BAWSCA s Strategy Groundwater Model Reviewing and providing feedback on the Groundwater Assessment Plan and technical deliverables Participating in the County s workshops Facilitating periodic updates for BAWSCA member agencies on the County s efforts 3.3 Policy and Technical Support Considerable policies and regulations were implemented during the drought in order to achieve water use reductions statewide and locally. As a result of the emergency, these policy actions and regulations were implemented on a quick timeline, often requiring near immediate action from water suppliers in order to comply. BAWSCA staff provided technical support to member agencies in understanding and complying with (1) SFPUC s request for BAWSCA Drought Response Actions 8/9/
37 voluntary water use reductions and (2) the Governor s drought-related executive orders and subsequent actions by the SWRCB and DWR. BAWSCA s actions related to each of these efforts are described below SFPUC Voluntary 10% Reduction Agency Support When SFPUC issued its call for a voluntary 10% reduction in water use in January 2014, several questions arose from BAWSCA and the member agencies regarding the specific goals of this request. These questions included: What was the baseline from which the 10% reduction target was to be calculated? What was the period over which the reduction was to be achieved? What were the water supply implications if the reductions were not achieved? How was SFPUC monitoring progress toward the reduction target? What were the financial implications of these reductions, in particular for those agencies with minimum purchase requirements? To address these concerns and provide clear guidance for member agencies seeking to meet SFPUC s reduction target, BAWSCA coordinated with SFPUC to develop the annualized water use target, as well as the corresponding weather-adjusted monthly water targets, for the SF RWS collectively and for the individual BAWSCA member agencies. BAWSCA then developed monthly tracking for each member agency comparing actual water use with target use. For those agencies not meeting their monthly targets, BAWSCA worked with agency staff to understand the water use patterns and to determine potential paths for meeting the reduction goals. Concurrent with BAWSCA s efforts to track member agency s water use reductions, SFPUC was considering implementation of a mandatory reduction in water use because in the spring of 2014 it did not appear that the call for voluntary reductions was yielding a decrease in water use. However, through the analysis of individual agency targets and monthly water use evaluation, it was recognized that most agencies were meeting, or were on track to meet, the call for 10 percent voluntary conservation. Further analysis showed that the primary reason for perceived higher demands was that ACWD was taking more SF RWS deliveries in early 2014 than it had in prior years. ACWD s increased deliveries were the result of a zero percent SWP allocation and an inability to access its water stored in the Semitropic Groundwater Bank as a result. Through subsequent discussions with ACWD, it was determined that ACWD would be able to meet its reduction target on an annual basis. With this information, SFPUC determined that implementing mandatory water use reductions would not be necessary at that time. BAWSCA Drought Response Actions BAWSCA continued to monitor agency water use on a monthly basis to ensure that agencies were meeting their voluntary reduction targets through June 2015, when the State implemented mandatory reduction targets. BAWSCA also extended this analysis for agencies to show water savings progress through June 2015 as compared to the savings they would be required to achieve under the State s mandatory reduction targets State Drought Regulation Support Beginning with the first SWRCB drought regulation in May 2014, BAWSCA received questions from multiple member agencies regarding the requirements of the regulation and impacts to the BAWSCA agencies. BAWSCA focused its activities related to the regulations in two areas: 1) advocating for BAWSCA agency interests at the SWRCB as each version of the emergency regulation was developed and 2) supporting member agencies in understanding and effectively implementing the adopted regulations. To advocate for BAWSCA agency interests at the SWRCB, BAWSCA took the following actions: 3-11
38 Analyzing the potential implications of proposed regulations on the BAWSCA agencies Participating in ACWA working groups to develop recommendations for the SWRCB Coordinating with SFPUC and other water agencies on review and comments for proposed regulations Participating in the SWRCB public comment opportunities One example of BAWSCA s advocacy efforts was the adjustment to proposed tiers of water conservation standards for urban water suppliers. The SWRCB s initial proposed regulatory framework for implementing the statewide 25 percent reduction target would have grouped urban water suppliers into four tiers, with reduction targets of either 10 percent, 20 percent, 25 percent, or 35 percent depending on per capita water use. The proposed tiers would have imposed a disproportionate burden on water suppliers in the bottom portion of the second range, including the majority of the BAWSCA member agencies. BAWSCA submitted recommended modifications to the SWRCB to address this disparity, and coordinated with other industry groups and water suppliers on submittal of similar recommendations. The SWRCB s final regulatory framework addressed these concerns, increasing the number of tiers from four to nine and reducing the conservation standards for the majority of the BAWSCA agencies. To support BAWSCA agencies in complying with the regulations, BAWSCA took the following actions: Corresponded with SWRCB staff on the implementation of the regulations Facilitated information sessions between SWRCB staff and the BAWSCA agencies Provided technical support to agencies in understanding the requirements of the regulations Coordinated legal review of regulations when necessary Updated member agency management staff on regulatory actions and requirements Tracked BAWSCA member agency progress toward SWRCB water savings targets Preparation for SFPUC Mandatory Water Use Reductions During the drought, SFPUC did not need to declare a water shortage emergency and implement mandatory conservation due to the success of voluntary conservation efforts. However, the implementation of mandatory water use reductions remained a possibility should water supply conditions worsen or if voluntary conservation target were not met. To assist agencies in preparing for this possibility, BAWSCA took actions to evaluate the potential allocations to the BAWSCA agencies and to educate the agencies on the allocation process and implications Background on Water Allocation Process If SFPUC determines that there is a water supply shortage due to drought and declares a water shortage emergency, SFPUC then has the option to implement mandatory reductions per the 2009 WSA. The Tier 1 Plan, adopted as part of the WSA, defines the process and formula for allocating water from the SF RWS along the San Francisco retail and wholesale customers during system-wide shortages of 20 percent or less. The Tier 2 Plan, adopted by each wholesale customer in 2011, then allocates the water collectively available to the wholesale customers under the Tier 1 Plan among each individual wholesale customer BAWSCA Actions To assist agencies in preparing for the possibility of Tier 1 and Tier 2 plan implementation, BAWSCA took the following actions: BAWSCA Drought Response Actions 8/9/
39 Presented to the Water Management Representatives and Water Resources Committee on the allocation process agreed upon in the adopted Tier 1 and Tier 2 plans Analyzed Tier 1 allocation scenarios and discussed potential concerns with SFPUC Analyzed Tier 2 allocation scenarios and shared results and potential challenges with BAWSCA agencies Tier 1 and Tier 2 Plan Evaluation for Future Droughts In 2016, BAWSCA compared the water use reductions achieved by the BAWSCA agencies during the drought (FY ) to potential allocations that the BAWSCA agencies would have received under the Tier 1 and Tier 2 plan to achieve similar levels of overall SF RWS use during the same period. The purpose of the analysis was to assess the effectiveness of these adopted plans, based on current water use patterns, for equitably allocating shortages in future droughts. Key conclusions include: Under the Tier 1 Plan, San Francisco retail customers would have been allocated more water than was actually used by retail customers in calendar year SFPUC retail customers would have been allocated 75.3 mgd in a 10 percent system-wide shortage, which is 10.8 mgd more water than the retail customers used in calendar year 2014, and would have been allocation 69.7 mgd in a 20 percent system-wide shortage, 5.23 mgd more water than was used. Eight BAWSCA agencies would have had to achieve water use reductions from the SF RWS greater than what was achieved in FY Additional reductions from FY that would have been required ranged from 2 percent to 31 percent. The allocations that would have been provided to each BAWSCA member agency under the Tier 2 plan were not consistent with the level of reductions agencies were required to achieve under the SWRCB Emergency Regulation. Allocations were lower than SWRCB reduction targets for some BAWSCA member agencies and higher than SWRCB reduction targets for others. BAWSCA Drought Response Actions 3-13
40
41 Drought Response by Member Agencies
42
43 Drought Response by Member Agencies This chapter provides an overview of the regional and local drought response actions that were implemented by the BAWSCA member agencies and the feedback received from each BAWSCA member agency on the perceived relative effectiveness and benefits of each program. 4.1 Drought Response Actions Utilized by Member Agencies In addition to the regional support provided by BAWSCA (see Section 3), BAWSCA member agencies implemented a range of drought response actions within their individual service areas. Table 4.1 summarizes the drought response actions implemented by each member agency based on information provided to BAWSCA as part of a Drought Response Survey conducted in February In addition to participating in the regional BAWSCA drought response actions, the member agencies implemented additional actions that were focused specifically within their respective service areas. The most broadly implemented actions (i.e., those implemented by over half of the member agencies) included the following: 1. Water bill inserts (96% of agencies), 2. Excessive water use warnings, fines, and/or penalties (88% of agencies), 3. Platform for reporting water wasters (e.g., website or hotline) (88% of agencies), 4. Promotion of drought messaging on social media (88% of agencies), 5. Reduced irrigation of city-owned landscape and/or parks (80% of agencies), 6. Limited fire system flushing (76% of agencies), 7. Water use surveys or audits (76% of agencies), 8. Increased water loss prevention programs (68% of agencies). The overall number of drought response actions implemented by the member agencies varied quite substantially, ranging from Westborough Water District, who reported implementing 12 drought response actions and programs, to the City of Redwood City who reported implementing 28 distinct drought response actions and programs. In general, larger member agencies implemented more drought response actions. However, the list presented in Table 4.1 should not be considered all inclusive, as additional actions may have been implemented that were not captured by the Drought Response Survey. Drought Response by Member Agencies 4.2 Relative Perceived Effectiveness of Drought Response Actions As documented in the Drought Response Survey, the member agencies were asked to rank the relative effectiveness of the local and regional drought response actions that they implemented. The results summarized here are qualitative and should not be considered measurements of actual water savings. Table 4.2 summarizes the perceived relative effectiveness of the drought response actions that were provided by BAWSCA and/or that were locally implemented by at least half of the member agencies. The BAWSCA drought response actions that were considered to be the most effective were the SWRCB Drought Regulation Support, Electronic Drought Messaging Materials, and Regional Outdoor Watering Schedule. The member agency drought response actions that were considered to be the most effective included Enacting Water Shortage Contingency Plans, Reducing irrigation of city-owned landscape or parks, Promoting drought messaging on social media, and Providing 4-1
44 water bill inserts. In general, the drought response actions that were perceived as being the most effective were those that promoted drought messaging to customers, on a regional or local basis. 4.3 Member Agency Feedback on BAWSCA Drought Support The Drought Response Survey asked the member agencies to indicate which regional drought response actions BAWSCA should consider a high, medium, or low priority to enact in the event of future drought. The majority of member agencies indicated that BAWSCA should make the following actions a high priority: SWRCB Drought Regulation Support, Regional Media Campaign, Regional Watering Schedule, and Increased Public Outreach. With the exception of SWRCB Drought Regulation Support, these drought response actions all center on providing a cohesive and consistent public outreach message. The member agencies recognize that BAWSCA has a unique ability to provide regionally coordinated and consistent public drought messaging that provides valuable reinforcement to local messaging. Member agencies did caution that such regional messaging was only as valuable as it was consistent with local and other regional messaging campaigns. Several member agencies expressed concern that regional messaging, in particular the coordination of outdoor irrigation schedules, is most beneficial when the messaging is consistent with that of adjacent and overlapping regional entities, including EBMUD and SCVWD. It was suggested that in advance of the next drought, BAWSCA coordinate with EBMUD and SCVWD to pre-determine and agree upon three-day and two-day watering schedules that would then be implemented and messaged consistently by all entities. Member agencies indicated that drought response actions that center on providing direct support to member agency staff (i.e., the SWRCB Drought Regulation Support and SFPUC Voluntary Reduction Support) should also be prioritized by BAWSCA during a future drought. It was noted by one member agency that such support could be better tailored for member agencies that receive water supply from additional sources, particularly those located in the SCVWD service area. While the Regional MWELO Update support provided by BAWSCA was also focused on directly supporting member agency staff, the Drought Response Survey results indicated more mixed opinions on whether it (and presumably similar type services) should be made a high priority in future droughts. Based on the feedback provided by member agencies, support for this action was highly dependent on whether the responding agency had relied on the version of the MWELO ordinance that was provided by BAWSCA. Member agencies provided relatively little feedback regarding website update support (i.e., drought updates to the BAWSCA and WaterWise Gardening websites). Some agencies noted that they found it very useful to provide links to these resources from their own websites and other customer communications, but that they had no way of gauging what benefit their customers received from it. Member agencies generally provided positive feedback regarding the Drought Messaging Bulk Purchase Program and the Water Conservation 101 Public Education Workshops, but ranked them among the drought response actions they would least like to see prioritized in the event of a future drought. Interestingly, even though member agencies did not request that it be made a high priority for future droughts, member agencies ranked the Drought Messaging Bulk Purchase Program as being one of the most effective programs provided by BAWSCA (Table 4.2). Drought Response by Member Agencies 8/9/
45 Table 4.1: Drought Response Implementation by Member Agency Drought Response Action Implementation Drought Response Action Regionally Coordinated Drought Response Programs Alameda CWD Brisbane/GVMID Burlingame Cal Water Coastside CWD Daly City East Palo Alto Estero MID Hayward Hillsborough Menlo Park Mid-Peninsula WD Millbrae Milpitas Mountain View North Coast CWD Palo Alto Purissima Hills WD Redwood City San Bruno San Jose Santa Clara Stanford Sunnyvale Westborough WD Percentage of Member Agencies SWRCB Drought Regulation Support Regional Implementation 100% SFPUC Voluntary Reduction Support Regional Implementation 100% BAWSCA Website Drought Updates Regional Implementation 100% Regional Media Campaign Regional Implementation 100% WaterWise Gardening Website Update Regional Implementation 100% Regional MWELO Update Regional Implementation 100% Regional Outdoor Watering Schedule X X X X X X X X X X X X X X X X X X 72% Electronic Drought Messaging Materials X X X X X X X X X X X X X X 56% "Water Conservation 101" Public Education Workshops Drought Messaging Bulk Purchase Program Locally Coordinated Drought Response Programs X X X X X X X X X X X 44% X X X X X X X 28% Water bill inserts X X X X X X X X X X X X X X X X X X X X X X X X 96% Platform for reporting water wasters (e.g., hotline, website, etc.) Excessive water use warnings, fines, and/or penalties X X X X X X X X X X X X X X X X X X X X X X 88% X X X X X X X X X X X X X X X X X X X X X 84%
46 Table 4.1: Drought Response Implementation by Member Agency Drought Response Action Implementation Drought Response Action Enacted Water Shortage Contingency Plan Stage Promotion of drought messaging on social media Alameda CWD Brisbane/GVMID Burlingame Cal Water Coastside CWD Daly City East Palo Alto Estero MID Hayward Hillsborough Menlo Park Mid-Peninsula WD Millbrae Milpitas Mountain View North Coast CWD Palo Alto Purissima Hills WD Redwood City San Bruno San Jose Santa Clara Stanford Sunnyvale Westborough WD X X X X X X X X X X X X X X X X X X X X X X X 92% X X X X X X X X X X X X X X X X X X X X X 84% Percentage of Member Agencies Water use surveys or audits X X X X X X X X X X X X X X X X X X X 76% Reduced irrigation of city-owned landscape and/or parks X X X X X X X X X X X X X X X X X X X 76% Limited fire system flushing X X X X X X X X X X X X X X X X X X X 76% Increased water loss prevention programs X X X X X X X X X X X X X X X X X 68% Issued more excessive water use warnings than typical years X X X X X X X X X X X X X X X 60% Promotion of recycled water projects X X X X X X X X X X X X 48% Recycled water fill stations X X X X X X X X X X X 44% Additional staff hired X X X X X X X X X X 40% Enactment of drought rates or surcharges X X X X X X X X 32% Reduced overall water system pressure X X X X 16% Issued more excessive water use fines than typical years X X X X 16%
47 Table 4.1: Drought Response Implementation by Member Agency Drought Response Action Implementation Alameda CWD Brisbane/GVMID Burlingame Cal Water Coastside CWD Daly City East Palo Alto Estero MID Hayward Hillsborough Menlo Park Mid-Peninsula WD Millbrae Milpitas Mountain View North Coast CWD Palo Alto Purissima Hills WD Redwood City San Bruno San Jose Santa Clara Stanford Sunnyvale Westborough WD Drought Response Action Locally Coordinated Drought Response Programs (Programs Identified by Survey Write-In, May Not Be Inclusive of All Member Agencies) (a) Workshops and other outreach X X X X X X X X 32% Percentage of Member Agencies Drought mailers or door hangers X X X X X X X 28% School education program X X X 12% Large landscape irrigation water budget X X X 12% changes and/or enforcement Outdoor watering schedule X X X X 16% Landscape rebates X X 8% Distribution of low flow devices X X X X 16% Enforcement of municipal and State X X 8% regulations Leak detection through AMI meters X X 8% Limit or reuse water from system flushing X X X 12% Rate increase X X 8% Adjustment of water rate tiers X 4% Hired PR/graphic design consultant X 4% Large landscape irrigation enforcement X 4% Total Number of Actions Implemented by Member Agency Notes (a) Agency responses have been edited for clarification and consistency.
48 Table 4.2 Relative Perceived Effectiveness of Drought Response Actions Implemented by at Least 50% of Member Agencies Regionally Coordinated Drought Response Programs SWRCB Drought Regulation Support Electronic Drought Messaging Materials Regional Outdoor Watering Schedule Regional Media Campaign Increased Public Outreach Regional MWELO Update SFPUC Voluntary Reduction Support "Water Conservation 101" Public Education Workshops BAWSCA Website Drought Updates WaterWise Gardening Website Update Locally Coordinated Drought Response Programs Water Shortage Contingency Plan enactment Reduced irrigation of city-owned landscape or parks Promotion of drought messaging on social media Water bill inserts Excessive water use warnings, fines, and/or penalties Platform for reporting water wasters Increased water loss prevention programs Limited fire system flushing Water use surveys or audits 1.00 Not 2.00 Moderately Very 5.00 Effective Effective Effective Relative Perceived Effectiveness at Supporting Agency's Drought Response Action and Motivating Customer Water Use Reductions Notes (a) Relative perceived effectiveness is summarized based on the mean of the effectiveness reported by agencies (on a scale of 1 to 5 with 5 being the most effective) that listed and participated in the available action.
49 5. Fiscal Considerations
50
51 5. Fiscal Considerations This section documents the fiscal impacts and associated actions for BAWSCA, SFPUC, and BAWSCA member agencies as a result of the drought. 5.1 BAWSCA Fiscal Impacts To support BAWSCA member agencies in drought response, adjustments to BAWSCA s work plan and budget were required to provide staff support for drought response activities and to fund outside consultant costs. In FY and FY , significant drought response activities were not anticipated in BAWSCA s work plan development. However, drought response activities were able to be accommodated within BAWSCA s operating budget and existing staff resources. This was possible largely due to the timing of the drought, as BAWSCA had added an additional staff member to the Water Resources group in FY and also had some flexibility in timing some other work efforts. In future droughts, a similar level of drought response effort can be expected to require adjustments to BAWSCA s work plan or additional financial resources. It is estimated that drought response activities required the equivalent of 1.5 full time employees per year 1 in FY and FY For the Regional Media Campaign, it was determined that SFPUC would fund these costs and would collect the wholesale share through the Wholesale Revenue Requirement. This was financially preferable to funding the campaign through BAWSCA s operating budget, as it would have represented a significant unbudgeted expenditure for BAWSCA. 5.2 SFPUC Fiscal Impacts Minimum Purchase Requirements The 2009 Water Supply Agreement (WSA) includes minimum purchase requirements for four wholesale customers that have the ability to purchase imported water supplies from third parties (e.g., SCVWD and SWP). These agencies are subject to a requirement to buy a minimum quantity of water from SFPUC. The purpose of the minimum purchase requirement is to promote system-wide financial stability. The four wholesale customers that have minimum purchase requirements are ACWD, Milpitas, Mountain View, and Sunnyvale. 5. Fiscal Considerations Minimum Purchase Waiver in FY and FY Following the SFPUC call for voluntary rationing in January 2014, two wholesale customers contacted the SFPUC to request a waiver of their respective minimum purchase volumes in the event that their customers responded to the call to conserve and their total FY purchases fell below the minimum purchase volumes specified in the 2009 Water Supply Agreement. The WSA provides that minimum purchase requirements..will be waived during a Drought or other period of water shortage if the water San Francisco makes available to these Wholesale Customers is less that the minimum purchase quantity. (2009 WSA). However, as SFPUC did not adopt mandatory rationing, its call for conservation did not trigger application of the WSA or establish the amount of water that SFPUC would make available to the four wholesale customers with minimum purchase requirements. 1 While BAWSCA does not track staff time by activity, it is estimated the drought response required 30% of the time of the CEO, 30% of the time of the Water Resources Manager, 20% of the time of the Senior Water Resources Specialist, 60% of the time of the Water Resources Specialist, and 10% of the time of the Assistant to the CEO 5-1
52 On March 7, 2014, the SFPUC agreed to a one-time waiver of the minimum purchase requirements of ACWD, Milpitas, Mountain View, and Sunnyvale for up to 10 percent of the minimum purchase requirements as shown in Table 5.1. This waiver was provided via a letter from SFPUC management (Appendix D). In its letter to BAWSCA, SFPUC stated that requiring wholesale customers to meet their minimum purchase requirements when SFPUC has asked for a reduction in demands sends the wrong message to these customers and the public at large. On July 2, 2014, SFPUC extended the waiver of minimum purchase requirements through FY as a result of the continued call for 10 percent rationing (Appendix D). The waiver of the minimum purchase was subject to the provision that an agency s purchase of less than the minimum purchase volume was due to additional demand reduction efforts, not due to the purchase of other sources of water. The waiver also stipulated that the SFPUC reserves the right to adjust the Wholesale Revenue Requirement for FY and FY to the extent that it could demonstrate that the waiver caused financial hardship to retail customers due to corresponding adjustment of the retail/wholesale proportional use ratio that underlies that allocation of costs in the WSA. Table 5.1: Fiscal Year and FY Minimum Purchases Requirements Customer WSA Minimum Purchase Volume (mgd) Adjusted Minimum Purchase Volume (mgd) ACWD mgd mgd Milpitas mgd mgd Mountain View mgd mgd Sunnyvale mgd mgd Minimum Purchase Waiver in FY and FY On April 15, 2015, SFPUC further extended its waiver of minimum purchase requirements as a result of the SWRCB water use reduction requirements (Appendix D). Each agency s minimum purchase requirements were waived through FY , provided that reduced purchases were due to an overall net decrease in demand. This waiver was extended through FY , in a letter from SFPUC on June 23, 2016 (Appendix D), on the premise that mandatory rationing at the state level had greatly depressed demand and that it was unlikely that those demands would fully rebound in the near term. On April 4, 2017, SFPUC stated, in its Final Water Supply Availability Estimate, that it will no longer waive the minimum purchase requirements effective July 1, 2017, as the request for voluntary reductions has been lifted (Appendix E). After that date, purchases of less than the minimums will be subject to the take or pay requirements of the WSA section Implications of Minimum Purchase Waivers Table 5.2 shows the average daily purchases for each agency with a minimum purchase requirement during the first three years for which the minimum purchase waiver was in effect. In FY , in spite of the minimum purchase waiver, the agencies purchased 4.60 mgd more from SFPUC than the total minimum purchase requirement. This was primarily due to increased SFPUC purchases from ACWD. In FY , the agencies collectively purchased 2.65 mgd less than their total WSA minimum purchase requirement. In FY , the year for which the SWRCB mandatory water use reductions were in effect, the agencies collectively purchased 5.34 mgd less than their total 5. Fiscal Considerations 8/9/
 FY 2013-14 SFPUC Purchases (mgd) FY 2014-15 SFPUC Purchases (mgd) FY 2015-16")
53 WSA minimum purchase requirement. FY water sales were not yet available at the time of publication of this report Table 5.2: SF RWS Purchases during Drought for Agencies with Minimum Purchase Requirements WSA Minimum Purchase Requirement (mgd) FY SFPUC Purchases (mgd) FY SFPUC Purchases (mgd) FY SFPUC Purchases (mgd) ACWD Milpitas Mountain View Sunnyvale Total Source: SFPUC Commercial Records Division Data In the settlement discussions for FY , BAWSCA and SFPUC agreed that the waiver of the minimum purchase requirements during the drought provided a water supply reliability benefit to both the SFPUC retail customers and the wholesale customers. Therefore, the cost impacts of the minimum purchase waiver were shared between the retail and wholesale customers. Concerns may remain for some BAWSCA agencies with minimum purchase requirements regarding long-term implications of reduced water demands on the ability to meet minimum purchase obligations. Figure 5.1: SF RWS Purchases during Drought for Agencies with Minimum Purchase Requirements Fiscal Considerations Million Gallons per Day (mgd) ACWD Milpitas Mountain View Sunnyvale WSA Minimum Purchase Requirement (mgd) FY SFPUC Purchases (mgd) FY SFPUC Purchases (mgd) FY SFPUC Purchases (mgd) 5-3
54 5.2.2 Wholesale Water Rate Impacts Table 5.3 shows the increases to the wholesale water rates each year during the drought. From FY to FY , wholesale water rates increased by 67 percent. Table 5.3: Wholesale Water Rate Changes during Drought (FY to FY ) FY FY FY Wholesale Water Rate ($/ccf) $2.93 $3.75 $4.10 Change from Prior Year (%) 19.6% 28.0% 9.3% The rate increases in FY and FY were primarily due to SFPUC s revenue shortfall in the prior year, caused by the difference between the actual water sales and the projected water sales for rate setting purposes. In FY , the rate increase was mainly due to an increase in debt service for the Water System Improvement Program (WSIP), not due to the drought. Table 5.3 shows the projected water sales for rate setting purchases compared with actual water sales for FY through FY Table 5.4: Wholesale Water Rate Changes during Drought (FY to FY ) FY FY FY Projected Water Sales (mgd) Actual Water Sales (mgd) Difference (mgd) Difference (%) -12% -15% 13% 5.3 Member Agency Fiscal Impacts In addition to fiscal impacts from SFPUC wholesale rate increases, BAWSCA member agencies also faced revenue shortfalls during the drought due to the reduction in water sales and associated water revenue. BAWSCA agencies also incurred additional drought-related expenses; for instance, 40% of BAWSCA agencies hired additional staff to support drought responses. Based upon the data provided by BAWSCA member agencies in the Annual Survey, average monthly water use for single family households decreased by 31 percent from FY to FY , from 12.2 ccf to 8.4 ccf monthly. Over the same period, single family residential water bills decreased by 10 percent on average, from $68.76 per month in FY to $61.67 in FY Therefore, while water rates increases did offset some financial impacts of the drought, it is likely that many agencies still experienced revenue shortfalls. Eight BAWSCA member agencies enacted drought rates or surcharges, and at least two additional agencies increased their water rates or made adjustments to their water rate tiers (see Table 4.1). However, one BAWSCA agency, the Town of Hillsborough, is currently facing a lawsuit from residents regarding the legality of its drought rates. The lawsuit alleges that the tiered rates and penalty charge for use over the allotted amount violates Proposition Fiscal Considerations 8/9/
55 Water Quality Impacts
56
57 Water Quality Impacts This section documents the water quality events and or incidences that took place within the SF RWS and further within specific BAWSCA member agencies water systems that were observed during the drought period. At the time of this report preparation, causes of many of these events remain speculation. Conclusive information may be collected and/or findings developed, yet it remains to be seen as to whether the causes of specific events or incidences were drought-related water supply and operational actions or other factors not related to the drought. Therefore, this section is intended primarily to document the water quality concerns that arose during the drought period and the actions taken to address these issues. 6.1 Increased Nitrification Nitrification is a microbial process that results in nitrogen compounds (especially ammonia) being oxidized to nitrite and then nitrate. Ammonia is present in our drinking water supply due to the addition of chloramine (formed in a reaction of free chlorine and ammonia) as a residual disinfectant. Nitrification occurs in chloraminated systems with otherwise harmless bacteria called nitrifying bacteria. Due to the oxidation of the ammonia, total chlorine residual also decreases which can lead to risk of bacterial contamination of the distribution system. During the period of mandatory and voluntary reductions in water use, the incidence of low total chlorine residuals increased in the water systems of member agencies. Because there was lower water use, water remained in pipes for longer than usual operations. In addition, agencies reduced the frequency of unidirectional flushing programs to conserve water. Both of these factors likely contributed to increased nitrification and loss of total chlorine residual in member agencies water systems. Agencies also experienced nitrification issues in their storage tanks due to low water demands. If nitrification proliferates in a storage tank, the water becomes unusable and must be disposed. To avoid nitrification, some agencies tried to reduce detention and storage times in tanks by lowering the operating range and stored volume, however, this method of operation could lead to agencies having less water (or water pressure) available in the event of an emergency. One method to avoid nitrification was to have quicker turnover of water in storage tanks or invest in mixing systems for storage tanks to prevent thermal gradients from forming in the tanks and prevent nitrification. This provided some improvement. Water Quality Impacts To conserve water, agencies had reduced or eliminated flushing programs to reduce water use during the drought. As needed, agencies resumed implementation of their standard practice of unidirectional flushing of their systems to avoid nitrification and maintain residual levels. In some cases, where unidirectional flushing was not able to be implemented, significant spot flushing occurred in response to low chlorine residuals from nitrification. The Town of Hillsborough invested in a No-DES machine, a flushing technology that uses a mounted pumping, filtering, and rechlorinating system to circulate water within the distribution system to provide water quality improvements along water distribution lines without discharging the flushed water to the storm drainage system or nearby surface water bodies. 6-1
58 6.2 Elevated Levels of Disinfection Byproducts Disinfectant byproducts are formed in water systems when total organic carbon (TOC) interacts with chlorine and chloramine. Several factors drive the formation rate of DBPs, most importantly concentration of TOC and the time for which the contact between the organics and disinfectant can occur. Beginning in 2016, elevated TOC levels have been detected in the Hetch Hetchy water supply. It is uncertain whether the elevated TOC levels were related to the drought, but a suspected cause is debris from the drought and Rim Fire that did not previously enter Hetch Hetchy due to lack of runoff during the severe drought years. In the winter of FY , runoff resumed as modest rainfall was recorded and with that elevated TOC levels were observed. Moreover, with record low demands throughout the regional water system and locally for wholesale customers, the amount of time that contact occurred between TOC and disinfectant was much higher than in previous years. Hetch Hetchy supply does not typically receive filtration before delivery to customers, so TOC is not removed from the supply. The increased TOC levels have led to increased levels of disinfection byproduct since late 2015, in particular trihalomethanes (THMs) and haloacetic acids (HAA5). The Hetch Hetchy supply is disinfected with free chlorine at the Tesla Portal, a good distance before it reaches customers, and chloramine disinfectant residual is added in the East Bay before the water is delivered to wholesale customers. Therefore, there is time for disinfection byproducts to form in this supply. In addition, water has been spending more time in pipelines due the low demands during this time, which has led to an increase in formation of these byproducts. Local watershed supplies (and Hetchy Hetchy supplies that are introduced into the local watersheds) are treated at either Harry Tracy Water Treatment Plant (HTWTP) or Sunol Valley Water Treatment Plant (SVWTP) before being distributed to customers. This treatment provides removal of the TOCs and thus, disinfection byproducts are lower in the supplies coming from the treatment plants. SFPUC has been mixing supplies from Hetch Hetchy Reservoir with supplies from SVWTP to reduce the concentrations of disinfection byproducts in the SF RWS. Two agencies, Brisbane and Stanford, exceeded the MCLs for disinfection byproducts on a quarterly annual average basis, and had to issue notices of violation in late 2016 and early 2017, respectively (violations occurring in second quarter 2016 and fourth quarter 2016). As of the date of this report, SFPUC and the affected wholesale customers are still determining the best approach to addressing disinfection byproduct issues in the Hetch Hetchy supply. 6.3 Taste and Odor Issues Although modern treatment plants remove the algae, some of their taste- and odor-causing metabolites may remain. The two most common metabolites are geosmin and 2-methylisoborneal (MIB). Even though these compounds are harmless, humans sense of taste and of smell are extremely sensitive to the compounds and can detect them in the water at concentrations as low as 5 parts per trillion. In January 2015, some agencies reported customer complaints of water smelling fishy and earthy which they related to isolated areas of low water use. Specifically, Menlo Park, Foster City, and Mountain View were agencies that reported having these issues. During the summer of 2015, Redwood City received complaints on the color and odor of water. As noted, they ve suspected the cause is low water consumption and a lack of unidirectional flushing. The above agencies addressed this issue by performing spot flushing. While flushing had been minimized to prioritize conservation, water quality needs in this case exceeded those of saving water. Water Quality Impacts 8/9/
59 On December 1, 2016, customers throughout the SF RWS service area reported taste and odor issues with their tap water, specifically an earthy or musty taste. The week of November 28th, SFPUC operators made routine operational changes to the system to bring local reservoir water levels down in anticipation of rains, included taking water out of San Antonio Reservoir in the East Bay and treating it at the SVWTP. SFPUC also reduced the flow of water coming from Hetch Hetchy Reservoir. This operational activity stirred up sediments in the pipeline, and the pipeline sediment was believed to be the initial source of the taste and odor issues. However, chemical testing in the system also showed the presence of a dissolved compound called geosmin that is a natural byproduct of blue green algae in the water. This dissolved compound is not harmful from a public health standard. However, this compound can cause taste and odor issues in the drinking water supply, even in extremely small amounts (parts per trillion). Geosmin was detected at the SVWTP, and SFPUC has indicated that this was the source of the taste and odor issues. This issue did not impact safety or compliance with water quality standards. The algae in the distribution system were stirred up due to system turnover. It is unclear, however, as to whether its growth was drought-related. Water Quality Impacts 6-3
60
61 Water Use Reductions
62
63 Water Use Reductions This section documents the water use reductions achieved by the BAWSCA member agencies during the drought, including: 1) water use reductions from the SF RWS and 2) overall potable water use reductions as reported to the SWRCB. Water use reductions during the drought were tracked by multiple entities, including SFPUC, BAWSCA, and the SWRCB. For each of these entities, reductions were calculated based upon different parameters (e.g., water sources and reporting periods for water use). The primary reporting periods used are: January 2014 to April 2017 the period for which the SFPUC s call for voluntary water use reductions was in effect. SF RWS deliveries and reductions targets for this period were compiled by the SFPUC Hydrology and Water Systems Group (Appendix I). June 2014 to April 2017 the portion of the drought period for which SWRCB mandatory water use reporting was in effect. Total reductions in water use were calculated for this period using the SWRCB urban water supplier reporting dataset (Appendix J). June 2015 to May the portion of the drought period for which SWRCB mandatory reductions in water use were in effect. Total reductions in water use were calculated for this period using the SWRCB urban water supplier reporting dataset. 7.1 San Francisco Regional Water System Water Use Reductions Throughout the drought, SFPUC monitored weekly progress toward system-wide water use reduction targets for the SF RWS, using historical weekly water use patterns to approximate weekly reduction targets. This ongoing monitoring enabled SFPUC to assess whether regional drought response was resulting in the necessary demand reductions or whether additional actions would be required. In 2014, prior to implementation of the statewide conservation standards, weekly water use targets were based on a 10 percent reduction from agency s FY purchase projections from the SF RWS. From June 2015 to May 2016, water use reduction targets were based upon the weighted average conservation standard for SFPUC retail and wholesale customers from 2013 water use. From June 2016 to April 2017, water use reduction targets were based on a 10% reduction from 2013 water use. Figure 7.1 depicts weekly SF RWS deliveries for 2013 through As shown, SF RWS reduction began to take effect in spring 2014 and continued throughout the drought period. The most significant reductions were achieved in summer 2015, when the SWRCB mandatory reductions in water use were in effect. As expected, reductions were most significant during the summer months due to reduction in outdoor water use as compared to Water Use Reductions Figure 7.2 shows the target and actual water savings for the SF RWS over the voluntary reduction period of January 31, 2014 to April 7, For this period, SF RWS retail and wholesale customers reduced SF RWS water purchases by 44,202 million gallons, achieving 51% more savings than the cumulative savings target of 29,206 mgd 1. 1 Source: Data compiled by SFPUC, Hydrology and Water Systems Group. Data copied on 6/2/
64 Figures 7.3 through 7.6 show the weekly target and actual SF RWS deliveries for 2014 through Figure 7.7 through 7.10 show the target and actual cumulative water savings on an annual basis for 2014 through Figure 7.1: SF RWS Total System Deliveries on Weekly Basis 290 Weekly SF RWS Deliveries (mgd) Jan 1-7 Jan Jan 29-Feb 4 Feb Feb 26-Mar 3 Mar Mar Apr 8-14 Apr May 6-12 May Jun 3-9 Jun July 1-7 July July 29- Aug 4 Aug Aug 26 - Sept 1 Sept 9-15 Sept Oct 7-13 Oct Nov 4-10 Nov Dec 2-8 Dec Figure 7.2: SF RWS Target and Actual Target Water Savings for Voluntary Reduction Period (January 31, 2014 April 7, 2017) 60,000 SF RWS Water Savings (mg) for Voluntary Reduction Period (January 31, April 7, 2017) 50,000 40,000 30,000 20,000 10,000 0 Target Water Savings: 29,206 mg Cumulative SF RWS Savings Target Actual Water Savings: 44,208 mg Cumulative SF RWS Actual Savings Water Use Reductions 8/9/
65 Figure 7.3: 2014 Weekly SF RWS Target and Actual Deliveries 290 SF RWS Deliveries (mgd) Jan 1-7 Jan Jan 29-Feb 4 Feb Feb 26-Mar 3 Mar Mar Apr 8-14 Apr May 6-12 May Jun 3-9 Jun July 1-7 July July 29- Aug 4 Aug Aug 26 - Sept 1 Sept 9-15 Sept Oct 7-13 Oct Nov 4-10 Nov Dec 2-8 Dec % Voluntary Reduction Target 2014 Weekly Deliveries (mgd) Figure 7.4: 2015 Weekly SF RWS Target and Actual Deliveries 290 SF RWS Deliveries (mgd) Water Use Reductions 130 Jan 1-7 Jan Jan 29-Feb 4 Feb Feb 26-Mar 3 Mar Mar Apr 8-14 Apr May 6-12 May Jun 3-9 Jun July 1-7 July July 29- Aug 4 Aug Aug 26 - Sept 1 Sept 9-15 Sept Oct 7-13 Oct Nov 4-10 Nov Dec 2-8 Dec % Voluntary Reduction Target 2015 Weekly Deliveries (mgd) SWRCB Mandatory Reduction Target 7-3
66 Figure 7.5: 2016 Weekly SF RWS Target and Actual Deliveries 290 SF RWS Deliveries (mgd) Jan 1-7 Jan Jan 29-Feb 4 Feb Feb 26-Mar 3 Mar Mar Apr 8-14 Apr May 6-12 May Jun 3-9 Jun July 1-7 July July 29- Aug 4 Aug Aug 26 - Sept 1 Sept 9-15 Sept Oct 7-13 Oct Nov 4-10 Nov Dec 2-8 Dec % Voluntary Reduction Target 2016 Weekly Deliveries (mgd) SWRCB Mandatory Reduction Target Figure 7.6: 2017 Weekly SF RWS Target and Actual Deliveries 290 SF RWS Deliveries (mgd) Jan 1-7 Jan Jan 29-Feb 4 Feb Feb 26-Mar 3 Mar Mar Apr 8-14 Apr May 6-12 May Jun 3-9 Jun July 1-7 July July 29- Aug 4 Aug Aug 26 - Sept 1 Sept 9-15 Sept Oct 7-13 Oct Nov 4-10 Nov Dec 2-8 Dec % Voluntary Reduction Target 2017 Weekly Deliveries (mgd) Water Use Reductions 8/9/
67 Figure 7.7: 2014 SF RWS Target and Actual Cumulative Water Savings SF RWS Water Savings (mg) Target Savings: 8,065 mg Actual Savings: 9,897 mg Jan 1-7 Jan Jan 29-Feb 4 Feb Feb 26-Mar 3 Mar Mar Apr 8-14 Apr May 6-12 May Jun 3-9 Jun July 1-7 July July 29- Aug 4 Aug Aug 26 - Sept 1 Sept 9-15 Sept Oct 7-13 Oct Nov 4-10 Nov Dec 2-8 Dec Cumulative Savings Target (mg) 2014 Cumulative Actual Savings (mg) Figure 7.8: 2015 SF RWS Target and Actual Cumulative Water Savings 17,000 Water Use Reductions SF RWS Water Savings (mg) 15,000 13,000 11,000 9,000 7,000 5,000 3,000 1,000-1, Target Savings: 11,032 mg 2015 Actual Savings: 16,049 mg Jan 1-7 Jan Jan 29-Feb 4 Feb Feb 26-Mar 3 Mar Mar Apr 8-14 Apr May 6-12 May Jun 3-9 Jun July 1-7 July July 29- Aug 4 Aug Aug 26 - Sept 1 Sept 9-15 Sept Oct 7-13 Oct Nov 4-10 Nov Dec 2-8 Dec Cumulative Target Savings (MG) 2015 Cumulative Actual Savings (mg) 7-5
68 Figure 7.9: 2016 SF RWS Target and Actual Cumulative Water Savings 17,000 SF RWS Water Savings (mg) 15,000 13,000 11,000 9,000 7,000 5,000 3,000 1,000-1, Target Savings: 9,099 mg 2016 Actual Savings: 15,675 mg Jan 1-7 Jan Jan 29-Feb 4 Feb Feb 26-Mar 3 Mar Mar Apr 8-14 Apr May 6-12 May Jun 3-9 Jun July 1-7 July July 29- Aug 4 Aug Aug 26 - Sept 1 Sept 9-15 Sept Oct 7-13 Oct Nov 4-10 Nov Dec 2-8 Dec Cumulative Target Savings (MG) 2016 Cumulative Actual Savings (MG) Figure 7.10: 2017 SF RWS Target and Actual Cumulative Water Savings SF RWS Water Savings (mg) 17,000 15,000 13,000 11,000 9,000 7,000 5,000 3,000 1,000-1, Target Savings: 1,010 mg 2017 Actual Savings: 2,587 mg Jan 1-7 Jan Jan 29-Feb 4 Feb Feb 26-Mar 3 Mar Mar Apr 8-14 Apr May 6-12 May Jun 3-9 Jun July 1-7 July July 29- Aug 4 Aug Aug 26 - Sept 1 Sept 9-15 Sept Oct 7-13 Oct Nov 4-10 Nov Dec 2-8 Dec Cumulative Target Savings (MG) 2017 Cumulative Actual Savings (MG) Water Use Reductions 8/9/
69 7.2 Total Potable Water Use Reductions Total potable water use reductions for the BAWSCA member agencies were evaluated based on the data reported on a monthly basis to the SWRCB for the 24 BAWSCA member agency service areas required to report. Consistent with the SWRCB s methodology, water use reductions were measured as compared to the same months in Total Cumulative Water Use Reductions Figure 7.15 (page 7-11) shows cumulative water use reductions as compared to 2013 from June 2014, the first month for which mandatory SWRCB reporting was required, through April 2017, the month in which the Governor declared an end to the drought emergency, for the 24 BAWSCA member agencies required to report monthly use to the SWRCB. As shown, water savings ramped up significantly between summer 2014 and summer 2015, consistent with the increase in outreach and State and local water use restrictions over this period. Water use reductions varied significantly by season, with the most significant reductions as compared to 2013 achieved during the summer months, when water use is typically highest due to outdoor irrigation. Cumulative water use reductions for the BAWSCA agencies over this period were 22 percent as compared to 2013 water use. Figure 7.11 shows total water use reductions for each of the 24 BAWSCA member agencies required to report monthly use to the SWRCB. As shown, water use reductions for individual BAWSCA member agencies ranged from 10 percent to 35 percent as compared to Figure 7.11: BAWSCA Member Agency Water Use Reductions, June 2014 to April % 35% 35%35% Percent Reduction 30% 25% 20% 15% 10% 27% 24%24% 19% 18% 17%17% 17% 13% 10% 26% 25% 24% 23% 23% 22% 17% 18% 20% 20% 19% 18% 5% 0% Water Use Reductions % Reduction (June 2014 to April 2017) 7-7
70 7.2.2 Compliance with SWRCB Water Conservation Standards From June 2015 through May 2016, 24 BAWSCA member agencies were required to achieve mandatory reductions in potable water use under the SWRCB emergency drought regulation (see Section 2). Each urban water supplier in the state was assigned a mandatory potable water use reduction percentage, or conservation standard, as compared to the same months in Stanford University, Brisbane/GVMID, and Purissima Hills WD were not assigned conservation standards as they do not meet the size threshold to be considered urban water suppliers. The SWRCB tracked cumulative compliance toward the assigned targets based on monthly water production data reported by each urban water supplier. BAWSCA used this dataset to track compliance for each individual member agency as well as total reductions for the BAWSCA service area. As discussed in Section 2, the conservation standards for the individual BAWSCA agencies ranged from 8 percent to 36 percent, assigned based on each agency s residential per capita water use in summer During the 12-month period for which the mandatory conservation standards were in effect, all of the BAWSCA member agencies met their conservation standards. BAWSCA agencies reduced potable water use by 27 percent as compared to 2013, collectively saving 23 billion gallons of water (166 percent of their savings target). Figure 7.12 shows the water use reductions as compared to 2013 achieved for each BAWSCA member agency during the 12- month compliance period, as well as their SWRCB assigned conservation standards. Figure 7.12: BAWSCA Member Agency Conservation Standards and Total Water Use Reductions, June 2015 to May % 40% 37% 41%41% 35% 30% 25% 20% 28%29% 24% 21% 22% 22% 23% 32% 32% 28% 26% 22% 23% 30% 29% 24%24% 23% 24% 15% 10% 5% 0% 12% 14% Conservation Standard % Reduction (June 2015 to May 2016) Water Use Reductions 8/9/

71 7.3 Residential Per Capita Water Use In the Drought Response Survey, most BAWSCA member agencies estimated that the majority of the water savings achieved during the drought resulted from actions by residential customers. Residential water use accounts for the majority of demand within each of the member agencies service areas, and can include a substantial amount of water use for landscape irrigation purposes. Since such landscape irrigation is generally considered discretionary, particularly in times of water shortage, one would expect member agencies with higher residential water use in normal years to be able to achieve higher water savings during drought conditions. Figure 7.13 shows the residential per capita water use (in gallons per capita per day) for each member agency during the SWRCB compliance period (June 2015 to May 2016). During this 12-month period, the average residential customer within the BAWSCA service area used 60 gallons per capita per day. Figure 7.13 BAWSCA Member Agency Per Capita Water Use, June 2015 to May 2016 (a) Source: SWRCB Dataset, June 2015 to May 2016; Agency data for Purissima Hills WD, Brisbane/GVMID, and Stanford Water Use Reductions 7.4 Outdoor Water Use Reductions As discussed in Sections 3 and 4, many of the drought response actions implemented by the State, BAWSCA, and the member agencies were designed to encourage a significant reduction in outdoor water use. Outdoor water use tends to be much higher in warm, dry summer months than in the winter months. Therefore, the higher the water use in summer months, the higher the proportion of water is being used for outdoor irrigation purposes, as indoor uses stay relatively constant. 7-9
72 The San Francisco Bay area has many microclimates, meaning that member agencies experience significantly different climatic conditions (e.g., temperature, humidity, and rainfall) based on the location of their service area, and therefore can have significant differences in typical landscape irrigation water demands. These differences in landscape irrigation water demands mean that there is a difference in opportunity and capacity for water savings through drought response actions targeting outdoor water use. Therefore, member agencies with higher outdoor water use would be expected to achieve a higher percentage of water savings from these drought response actions. As a measure of the seasonal variability in water use among member agencies, the ratio of monthly potable water production in summer and fall months (i.e., July through November) to monthly potable water production in winter months (i.e., December through March), based on 2013 water production, was calculated for each member agency. This relative seasonal variability ranged from the cooler northern member agencies such as Daly City, San Bruno, Westborough WD and CWS- South San Francisco (seasonal variability of 1 to 1.3), to member agencies in warmer areas with larger typical lot sizes, such Menlo Park, Hillsborough, and CWS- Bear Gulch (seasonal variability of over 2). Figure 7.14 shows the cumulative water savings achieved by each member agency relative to the degree of seasonal variability in water use. As expected, there is a strong correlation between the water savings achieved during the drought and relative seasonal variability in water use observed during non-drought years. Reductions in outdoor water use appear to have been a significant contributor to the amount of water savings achieved by a member agency. Figure 7.14: Seasonal Water Use Variability and Cumulative Water Savings 40% 35% Menlo Park Cumulative Water Savings June 2014 to April % 25% 20% 15% 10% Daly City Alameda CWD Coastside CWD Estero MID CWS - Bear Gulch 5% 0% Seasonal Water Use Variability Agencies with pre-drought R-GPCD of less than 75 Agencies with pre-drought R-GPCD of 75 to 99 Agencies with pre-drought R-GPCD 100 or more Water Use Reductions 8/9/

73 7-11 Figure 7.15: Water Use Reduction Timeline
74
75 Preparing for the Next Drought
76
77 Preparing for the Next Drought This section discusses 1) key lessons learned in responding to the drought and 2) BAWSCA s current and potential actions to prepare for future droughts. 8.1 Lessons Learned The experience in responding to the drought provided valuable insights for BAWSCA and the member agencies on best practices for drought response and considerations for long-term water supply planning. Key insights gained by BAWSCA and the member agencies include: Preparing for the Next Drought The existing Tier 1 and Tier 2 drought allocation plans no longer provide an effective means for allocating water supplies during a shortage. Had implementation of these plans been required, the water supply allocations to each agency would have been inconsistent with the water use reduction requirements set forth by the SWRCB. Modifications to both the Tier 1 and Tier 2 plan are anticipated to be necessary to align with proposed permanent Sate requirements. Drought conditions prompted significant attention from the State on water use and water supply. BAWSCA s support for member agencies in understanding and complying with State regulations represented a substantial work effort that was not anticipated in the initial planning for drought response. At the same time, the SWRCB regulation support was the BAWSCA drought response action valued most by the member agencies. Therefore, BAWSCA should anticipate that resources to support member agencies in responding to State drought actions will be needed in future droughts and should make this support a high priority action. Regional drought messaging, including both the development of messaging materials and the implementation of a media campaign, are among the most valuable drought response actions that BAWSCA can provide for its member agencies. As water use reduction targets may vary among the BAWSCA agencies, regional drought messaging should focus on simple, specific actions customers can take to conserve, in particular on actions to reduce outdoor water use, rather than focusing on reduction percentages. Joint implementation of a regional media campaign with SFPUC is preferable from both a consistency and resource perspective. Given the length of the contracting process for the media buy, actions to implement a regional media campaign should be taken as soon as possible after the need for water use reductions has been identified. Additionally, BAWSCA should coordinate with member agencies to leverage local ad space. Regional messaging, in particular the coordination of outdoor irrigation schedules, is most beneficial when the messaging is consistent with that of adjacent and overlapping regional entities, including SCVWD and EBMUD. Coordination in advance of the next drought to pre-determine and agree upon three-day and twoday watering schedules that would then be implemented and messaged consistently by all entities would be preferable. When a voluntary reduction request for the SF RWS is in place, a waiver of minimum purchase requirements for the agencies with these obligations should be promptly considered to align with an agency s activity to reduce water use. Adjustments to the minimum purchase requirements will impact the Wholesale Revenue Requirement during the drought. Continued low water use post-drought may also affect the ability of agencies with minimum purchase requirements to meet the minimum purchase once the 8-1
78 voluntary reductions are lifted. Early documentation of minimum purchase waivers and the associated terms during a voluntary reduction is beneficial to all parties. A number of BAWSCA agencies have historically low per capita use. Efforts by the State and others to ensure the water customers maintain a portion of the water use reductions achieved during the drought on a long-term basis will make it increasingly challenging to implement significant rationing requirements during the next drought. Shortages to member agencies other supply sources can impact member agency reliability and potential SF RWS purchases. As was observed in 2014, the demand for SF RWS supplies may increase for some BAWSCA agencies under certain hydrologic conditions, and the timing of the SF RWS demands may also change. A better understanding of the impacts of the reliability of other regional water supplies on the SF RWS is needed. The drought highlighted the importance of routine system flushing, the challenges of managing the system when flows are lower than normal, and the value of mixing in storage tanks and frequent turnout cleanings. While reduction of system flushing during drought can be beneficial from water conservation and public perception perspectives, maintaining water quality must remain a priority. Reduced water sales due to drought can cause revenue shortfalls for member agencies. This caused financial issues for some wholesale customers, and is a lingering difficulty of the drought. Analysis of demand forecasts at the beginning and end of a drought period to anticipate reductions and rebound would be beneficial for financial planning. In addition, some BAWSCA agencies have expressed concern regarding the legality of certain drought rate structures under Proposition 218. To support member agencies in preparing financially for future droughts, BAWSCA may consider implementation of a regional workshop on the financial impacts of drought. The workshop could discuss water utility financial best management practices to identify potential actions that can assist agencies in better preparing for and addressing the financial impacts of drought. The workshop may also identify local economic impacts of drought response and methods for projecting demand for budget and rate setting. 8.2 Drought Preparedness Actions The lessons learned during the drought motivated several of the actions included in BAWSCA s Board-adopted FY Work Plan and Operating Budget. The actions being taken to improve preparedness for future droughts are described below Tier 1 and Tier 2 Plans Revisions BAWSCA s FY Work Plan includes the development of principles for new Tier 1 and 2 drought allocation plans. The intent is to develop plans that align with proposed State water shortage contingency plan requirements and new conservation requirements so that the plans can be easily implemented if waters supply conditions warrant. This is expected to be a multi-year effort, as modifications to the Tier 1 plan will require an amendment to the 2009 WSA. As the current Tier 2 drought allocation plan expires in December 2018, BAWSCA will also prepare a temporary extension to the existing Tier 2 drought allocation plan Drought Response Studies BAWSCA and member agencies implemented an expansive variety of actions to reduce customer water use. The combined State and local drought response actions achieved water use reductions beyond what was required to meet State and local water use reduction targets. However, the multiple levels of response and the short Preparing for the Next Drought 8/9/
79 timeframe for deciding on and implementing drought response actions create a challenge in understanding the relative effectiveness of the individual demand management actions in reducing water use. BAWSCA is participating in two separate research efforts to better understand the drivers for drought water use reductions, the Demand Reduction Study and the Drought Restrictions Study. Each of these efforts is described below ReNUWIt Demand Reduction Study BAWSCA funded a two-part research study to evaluate the factors related to change in water use behavior for single family customers in the BAWSCA service area. The study was completed by Stanford researchers affiliated with the Re-Inventing the Nation s Urban Water Infrastructure (ReNUWIt) research center. The study investigated the extent to which various factors, including media coverage of the drought, new regulations, climate, and active conservation programs, influenced water use patterns within the service area during drought. The technical memorandums that were prepared for BAWSCA as part of this study are provided in Appendix K AWE Drought Restrictions Study BAWSCA has partnered with the Alliance for Water Efficiency (AWE) on a Drought Restrictions Study. The goal of this project is to conduct new empirical research on drought response approaches implemented by different water providers and the impact and water savings achieved. Twelve water providers, wholesalers, and water organizations, including BAWSCA, are partnering with AWE on this study and are providing a financial contribution of $10,000 each as well as the data necessary to complete the analysis. The study is anticipated to be completed in mid Regional Water System and Supply Modeling Tool To address the need to better understand the impacts of the reliability of other regional water supplies on the SF RWS, BAWSCA is currently developing an Independent Regional Water System & Supply Modeling Tool (Model). The Model will allow BAWSCA to run hydrologic scenarios to understand the impacts of the reliability of other regional water supplies (e.g., surface water from SCVWD, SWP supplies, etc.) on the BAWSCA agencies and on the reliability of the SF RWS. The model will also be used to evaluate the benefits of developing additional water supplies to support implementation of the Strategy as detailed in Section 3. Development of the Model is a multiyear investment with initial model development to occur in FY Preparing for the Next Drought 8.4 Making Water Conservation a California Way of Life BAWSCA s FY Work Plan and Operating Budget includes support for BAWSCA member agencies in meeting the new water use efficiency targets proposed in the Making Water Conservation a California Way of Life final framework report, which provides the State agencies proposed framework for implementing the Governor s long-term conservation directives. The BAWSCA Making Conservation a Way of Life Strategic Plan (Plan) is anticipated to be a multi-year effort, phased over the next three fiscal years to align with the state s proposed schedule for implementing new water use efficiency targets. Phase 1 of the Plan, to be completed in FY , will include: a) an assessment of member agency existing data and technical capabilities to comply with the anticipated State requirements and b) development of a roadmap for compliance with the proposed State requirements that identifies respective BAWSCA and member agency roles. 8-3
80
81 Appendices
82
83 Appendix A Drought Related Executive Orders and Proclamations
84
85 A PROCLAMATION OF A STATE OF EMERGENCY WHEREAS the State of California is experiencing record dry conditions, with 2014 projected to become the driest year on record; and WHEREAS the state s water supplies have dipped to alarming levels, indicated by: snowpack in California s mountains is approximately 20 percent of the normal average for this date; California s largest water reservoirs have very low water levels for this time of year; California s major river systems, including the Sacramento and San Joaquin rivers, have significantly reduced surface water flows; and groundwater levels throughout the state have dropped significantly; and WHEREAS dry conditions and lack of precipitation present urgent problems: drinking water supplies are at risk in many California communities; fewer crops can be cultivated and farmers long-term investments are put at risk; low-income communities heavily dependent on agricultural employment will suffer heightened unemployment and economic hardship; animals and plants that rely on California s rivers, including many species in danger of extinction, will be threatened; and the risk of wildfires across the state is greatly increased; and WHEREAS extremely dry conditions have persisted since 2012 and may continue beyond this year and more regularly into the future, based on scientific projections regarding the impact of climate change on California s snowpack; and WHEREAS the magnitude of the severe drought conditions presents threats beyond the control of the services, personnel, equipment and facilities of any single local government and require the combined forces of a mutual aid region or regions to combat; and WHEREAS under the provisions of section 8558(b) of the California Government Code, I find that conditions of extreme peril to the safety of persons and property exist in California due to water shortage and drought conditions with which local authority is unable to cope. NOW, THEREFORE, I, EDMUND G. BROWN JR., Governor of the State of California, in accordance with the authority vested in me by the state Constitution and statutes, including the California Emergency Services Act, and in particular, section 8625 of the California Government Code HEREBY PROCLAIM A STATE OF EMERGENCY to exist in the State of California due to current drought conditions. IT IS HEREBY ORDERED THAT: 1.State agencies, led by the Department of Water Resources, will execute a statewide water conservation campaign to make all Californians aware of the drought and encourage personal actions to reduce water usage. This campaign will be built on the existing Save Our Water campaign ( and will coordinate with local water agencies. This campaign will call on Californians to reduce their water usage by 20 percent. 2.Local urban water suppliers and municipalities are called upon to implement their local water shortage contingency plans immediately in order to avoid or forestall outright restrictions that could become necessary later in the drought season. Local water agencies should also update their legally required urban and agricultural water management plans, which help plan for extended drought conditions. The Department of Water Resources will make the status of these updates publicly available.
86 3.State agencies, led by the Department of General Services, will immediately implement water use reduction plans for all state facilities. These plans will include immediate water conservation actions, and a moratorium will be placed on new, non-essential landscaping projects at state facilities and on state highways and roads. 4.The Department of Water Resources and the State Water Resources Control Board (Water Board) will expedite the processing of water transfers, as called for in Executive Order B Voluntary water transfers from one water right holder to another enables water to flow where it is needed most. 5.The Water Board will immediately consider petitions requesting consolidation of the places of use of the State Water Project and Federal Central Valley Project, which would streamline water transfers and exchanges between water users within the areas of these two major water projects. 6.The Department of Water Resources and the Water Board will accelerate funding for water supply enhancement projects that can break ground this year and will explore if any existing unspent funds can be repurposed to enable near-term water conservation projects. 7.The Water Board will put water right holders throughout the state on notice that they may be directed to cease or reduce water diversions based on water shortages. 8.The Water Board will consider modifying requirements for reservoir releases or diversion limitations, where existing requirements were established to implement a water quality control plan. These changes would enable water to be conserved upstream later in the year to protect cold water pools for salmon and steelhead, maintain water supply, and improve water quality. 9.The Department of Water Resources and the Water Board will take actions necessary to make water immediately available, and, for purposes of carrying out directives 5 and 8, Water Code section and Division 13 (commencing with section 21000) of the Public Resources Code and regulations adopted pursuant to that Division are suspended on the basis that strict compliance with them will prevent, hinder, or delay the mitigation of the effects of the emergency. Department of Water Resources and the Water Board shall maintain on their websites a list of the activities or approvals for which these provisions are suspended. 10. The state s Drinking Water Program will work with local agencies to identify communities that may run out of drinking water, and will provide technical and financial assistance to help these communities address drinking water shortages. It will also identify emergency interconnections that exist among the state s public water systems that can help these threatened communities. 11.The Department of Water Resources will evaluate changing groundwater levels, land subsidence, and agricultural land fallowing as the drought persists and will provide a public update by April 30 that identifies groundwater basins with water shortages and details gaps in groundwater monitoring. 12.The Department of Water Resources will work with counties to help ensure that well drillers submit required groundwater well logs for newly constructed and deepened wells in a timely manner and the Office of Emergency Services will work with local authorities to enable early notice of areas experiencing problems with residential groundwater sources. 13.The California Department of Food and Agriculture will launch a one-stop website ( that provides timely updates on the drought and connects farmers to state and federal programs that they can access during the drought. 14.The Department of Fish and Wildlife will evaluate and manage the changing impacts of drought on threatened and endangered species and species of special concern, and develop contingency plans for state
87 Wildlife Areas and Ecological Reserves to manage reduced water resources in the public interest. 15. The Department of Fish and Wildlife will work with the Fish and Game Commission, using the best available science, to determine whether restricting fishing in certain areas will become necessary and prudent as drought conditions persist. 16.The Department of Water Resources will take necessary actions to protect water quality and water supply in the Delta, including installation of temporary barriers or temporary water supply connections as needed, and will coordinate with the Department of Fish and Wildlife to minimize impacts to affected aquatic species. 17.The Department of Water Resources will refine its seasonal climate forecasting and drought prediction by advancing new methodologies piloted in The California Department of Forestry and Fire Protection will hire additional seasonal firefighters to suppress wildfires and take other needed actions to protect public safety during this time of elevated fire risk. 19.The state s Drought Task Force will immediately develop a plan that can be executed as needed to provide emergency food supplies, financial assistance, and unemployment services in communities that suffer high levels of unemployment from the drought. 20.The Drought Task Force will monitor drought impacts on a daily basis and will advise me of subsequent actions that should be taken if drought conditions worsen. I FURTHER DIRECT that as soon as hereafter possible, this Proclamation be filed in the Office of the Secretary of State and that widespread publicity and notice be given of this Proclamation. IN WITNESS WHEREOF I have hereunto set my hand and caused the Great Seal of the State of California to be affixed this 17th day of January, EDMUND G. BROWN JR., Governor of California ATTEST: DEBRA BOWEN, Secretary of State
88 A PROCLAMATION OF A CONTINUED STATE OF EMERGENCY WHEREAS on January 17, 2014, I proclaimed a State of Emergency to exist in the State of California due to severe drought conditions; and WHEREAS state government has taken expedited actions as directed in that Proclamation to minimize harm from the drought; and WHEREAS California's water supplies continue to be severely depleted despite a limited amount of rain and snowfall since January, with very limited snowpack in the Sierra Nevada mountains, decreased water levels in California's reservoirs, and reduced flows in the state's rivers; and WHEREAS drought conditions have persisted for the last three years and the duration of this drought is unknown; and WHEREAS the severe drought conditions continue to present urgent challenges: water shortages in communities across the state, greatly increased wildfire activity, diminished water for agricultural production, degraded habitat for many fish and wildlife species, threat of saltwater contamination of large fresh water supplies conveyed through the Sacramento-San Joaquin Bay Delta, and additional water scarcity if drought conditions continue into 2015; and WHEREAS additional expedited actions are needed to reduce the harmful impacts from the drought as the state heads into several months of typically dry conditions; and WHEREAS the magnitude of the severe drought conditions continues to present threats beyond the control of the services, personnel, equipment, and facilities of any single local government and require the combined forces of a mutual aid region or regions to combat; and WHEREAS under the provisions of section 8558(b) of the Government Code, I find that conditions of extreme peril to the safety of persons and property continue to exist in California due to water shortage and drought conditions with which local authority is unable to cope; and WHEREAS under the provisions of section 8571 of the Government Code, I find that strict compliance with the various statutes and regulations specified in this proclamation would prevent, hinder, or delay the mitigation of the effects of the drought. NOW, THEREFORE, I, EDMUND G. BROWN JR., Governor of the State of California, in accordance with the authority vested in me by the Constitution and statutes of the State of California, including the Emergency Services Act and in particular Government Code section 8567, do hereby issue this Executive Order, effective immediately, to mitigate the effects of the drought conditions upon the people and property within the State of California. IT IS HEREBY ORDERED THAT: 1. The orders and provisions contained in Proclamation No , dated January 17, 2014, remain in full force and effect except as modified herein. 2. The Department of Water Resources and the State Water Resources Control Board (Water Board) will immediately and expeditiously process requests to move water to areas of need, including requests involving
89 voluntary water transfers, forbearance agreements, water exchanges, or other means. If necessary, the Department will request that the Water Board consider changes to water right permits to enable such voluntary movements of water. 3. Recognizing the tremendous importance of conserving water during this drought, all California residents should refrain from wasting water: a. Avoid using water to clean sidewalks, driveways, parking lots and other hardscapes. b. Turn off fountains and other decorative water features unless recycled or grey water is available. c. Limit vehicle washing at home by patronizing local carwashes that use recycled water. d. Limit outdoor watering of lawns and landscaping to no more than two times a week. Recreational facilities, such as city parks and golf courses, and large institutional complexes, such as schools, business parks and campuses, should immediately implement water reduction plans to reduce the use of potable water for outdoor irrigation. Commercial establishments such as hotel and restaurants should take steps to reduce water usage and increase public awareness of the drought through measures such as offering drinking water only upon request and providing customers with options to avoid daily washing of towels or sheets. Professional sports facilities, such as basketball arenas, football, soccer, and baseball stadiums, and hockey rinks should reduce water usage and increase public awareness of the drought by reducing the use of potable water for outdoor irrigation and encouraging conservation by spectators. The Water Board shall direct urban water suppliers that are not already implementing drought response plans to limit outdoor irrigation and other wasteful water practices such as those identified in this Executive Order. The Water Board will request by June 15 an update from urban water agencies on their actions to reduce water usage and the effectiveness of these efforts. The Water Board is directed to adopt emergency regulations as it deems necessary, pursuant to Water Code section , to implement this directive. Californians can learn more about conserving water from the Save Our Water campaign (SaveOurH2O.org). 4. Homeowners Associations (commonly known as HOAs) have reportedly fined or threatened to fine homeowners who comply with water conservation measures adopted by a public agency or private water company. To prevent this practice, pursuant to Government Code section 8567, I order that any provision of the governing document, architectural or landscaping guidelines, or policies of a common interest development will be void and unenforceable to the extent it has the effect of prohibiting compliance with the water-saving measures contained in this directive, or any conservation measure adopted by a public agency or private water company, any provision of Division 4, Part 5 (commencing with section 4000) of the Civil Code notwithstanding. 5. All state agencies that distribute funding for projects that impact water resources, including groundwater resources, will require recipients of future financial assistance to have appropriate conservation and efficiency programs in place. 6. The Department of Fish and Wildlife will immediately implement monitoring of winter-run Chinook salmon in the Sacramento River and its tributaries, as well as several runs of salmon and species of smelt in the Delta as described in the April 8, 2014 Drought Operations Plan. 7. The Department of Fish and Wildlife will implement projects that respond to drought conditions through habitat restoration and through water infrastructure projects on property owned or managed by the Department of Fish and Wildlife or the Department of Water Resources for the benefit of fish and wildlife impacted by the drought.
90 8. The Department of Fish and Wildlife will work with other state and federal agencies and with landowners in priority watersheds to protect threatened and endangered species and species of special concern and maximize the beneficial uses of scarce water supplies, including employment of voluntary agreements to secure instream flows, relocation of members of those species, or through other measures. 9. The Department of Water Resources will expedite the consideration and, where appropriate, the implementation, of pump-back delivery of water through the State Water Project on behalf of water districts. 10. The Water Board will adopt statewide general waste discharge requirements to facilitate the use of treated wastewater that meets standards set by the Department of Public Health, in order to reduce demand on potable water supplies. 11. The Department of Water Resources will conduct intensive outreach and provide technical assistance to local agencies in order to increase groundwater monitoring in areas where the drought has significant impacts, and develop updated contour maps where new data becomes available in order to more accurately capture changing groundwater levels. The Department will provide a public update by November 30 that identifies groundwater basins with water shortages, details remaining gaps in groundwater monitoring, and updates its monitoring of land subsidence and agricultural land fallowing. 12. The California Department of Public Health, the Office of Emergency Services, and the Office of Planning and Research will assist local agencies that the Department of Public Health has identified as vulnerable to acute drinking water shortages in implementing solutions to those water shortages. 13. The Department of Water Resources and the Water Board, in coordination with other state agencies, will provide appropriate assistance to public agencies or private water companies in establishing temporary water supply connections to mitigate effects of the drought. 14. For the protection of health, safety, and the environment, CAL FIRE, the Office of Emergency Services, the Department of Water Resources, and the Department of Public Health, where appropriate, may enter into contracts and arrangements for the procurement of materials, goods, and services necessary to quickly mitigate the effects of the drought. 15. Pursuant to the drought legislation I signed into law on March 1, 2014, by July 1, 2014, the California Department of Food and Agriculture, in consultation with the Department of Water Resources and Water Board, will establish and implement a program to provide financial incentives to agricultural operations to invest in water irrigation treatment and distribution systems that reduce water and energy use, augment supply, and increase water and energy efficiency in agricultural applications. 16. To assist landowners meet their responsibilities for removing dead, dying and diseased trees and to help landowners clear other trees and plants close to structures that increase fire danger, certain noticing requirements are suspended for these activities. Specifically, the requirement that any person who conducts timber operations pursuant to the exemptions in Title 14, California Code of Regulations sections 1038 (b) and (c) submit notices to CAL FIRE under the provisions of Title 14, California Code of Regulations, section is hereby suspended. Timber operations pursuant to sections 1038(b) and (c) may immediately commence operations upon submission of the required notice to CAL FIRE and without a copy of the Director's notice of acceptance at the operating site. All other provisions of these regulations will remain in effect. 17. The Water Board will adopt and implement emergency regulations pursuant to Water Code section , as it deems necessary to prevent the waste, unreasonable use, unreasonable method of use, or unreasonable method of diversion of water, to promote water recycling or water conservation, and to require curtailment of
91 diversions when water is not available under the diverter's priority of right. 18. In order to ensure that equipment and services necessary for drought response can be procured quickly, the provisions of the Government Code and the Public Contract Code applicable to state contracts, including, but not limited to, advertising and competitive bidding requirements, are hereby suspended for directives 7 and 14. Approval by the Department of Finance is required prior to the execution of any contract entered into pursuant to these directives. 19. For several actions called for in this proclamation, environmental review required by the California Environmental Quality Act is suspended to allow these actions to take place as quickly as possible. Specifically, for actions taken by state agencies pursuant to directives 2, 3, 6-10, 13, 15, and 17, for all actions taken pursuant to directive 12 when the Office of Planning and Research concurs that local action is required, and for all necessary permits needed to implement these respective actions, Division 13 (commencing with section 21000) of the Public Resources Code and regulations adopted pursuant to that Division are hereby suspended. The entities implementing these directives will maintain on their websites a list of the activities or approvals for which these provisions are suspended. This suspension and that provided in paragraph 9 of the January 17, 2014 Proclamation will expire on December 31, 2014, except that actions started prior to that date shall not be subject to Division 13 for the time required to complete them. 20. For several actions called for in this proclamation, certain regulatory requirements of the Water Code are suspended to allow these actions to take place as quickly as possible. Specifically, for actions taken pursuant to directive 2, section of the Water Code is suspended. The 30-day comment period provided in section 1726(f) of the Water Code is also suspended for actions taken pursuant to directive 2, but the Water Board will provide for a 15-day comment period. For actions taken by state agencies pursuant to directives 6 and 7, Chapter 3 of Part 3 (commencing with section 85225) of the Water Code is suspended. The entities implementing these directives will maintain on their websites a list of the activities or approvals for which these provisions are suspended. I FURTHER DIRECT that as soon as hereafter possible, this Proclamation shall be filed in the Office of the Secretary of State and that widespread publicity and notice be given to this Proclamation. IN WITNESS WHEREOF I have hereunto set my hand and caused the Great Seal of the State of California to be affixed this 25th day of April, 2014 EDMUND G. BROWN JR. Governor of California ATTEST: DEBRA BOWEN Secretary of State
92
93 ~=======================================================~ ~xccuti\lc :Bcpertmcnt ~tote of ~lifornia EXECUTIVE ORDER B WHEREAS on January 17, 2014, I proclaimed a State of Emergency to exist throughout the State of California due to severe drought conditions; and WHEREAS on April 25, 2014, I proclaimed a Continued State of Emergency to exist throughout the State of California due to the ongoing drought; and WHEREAS California's water supplies continue to be severely depleted despite a limited amount of rain and snowfall this winter, with record low snowpack in the Sierra Nevada mountains, decreased water levels in most of California's reservoirs, reduced flows in the state's rivers and shrinking supplies in underground water basins; and WHEREAS the severe drought conditions continue to present urgent challenges including: drinking water shortages in communities across the state, diminished water for agricultural production, degraded habitat for many fish and wildlife species, increased wildfire risk, and the threat of saltwater contamination to fresh water supplies in the Sacramento-San Joaquin Bay Delta; and WHEREAS a distinct possibility exists that the current drought will stretch into a fifth straight year in 2016 and beyond; and WHEREAS new expedited actions are needed to reduce the harmful impacts from water shortages and other impacts of the drought; and WHEREAS the magnitude of the severe drought conditions continues to present threats beyond the control of the services, personnel, equipment, and facilities of any single local government and require the combined forces of a mutual aid region or regions to combat; and WHEREAS under the provisions of section 8558(b) of the Government Code, I find that conditions of extreme peril to the safety of persons and property continue to exist in California due to water shortage and drought conditions with which local authority is unable to cope; and WHEREAS under the provisions of section 8571 of the California Government Code, I find that strict compliance with various statutes and regulations specified in this order would prevent, hinder, or delay the mitigation of the effects of the drought. NOW, THEREFORE, I, EDMUND G. BROWN JR., Governor of the State of California, in accordance with the authority vested in me by the Constitution and statutes of the State of California, in particular Government Code sections 8567 and 8571 of the California Government Code, do hereby issue this Executive Order, effective immediately. ~=======================================================~
94 ~=======================================================~ IT IS HEREBY ORDERED THAT: 1. The orders and provisions contained in my January 17, 2014 Proclamation, my April 25, 2014 Proclamation, and Executive Orders B and B remain in full force and effect except as modified herein. SAVE WATER 2. The State Water Resources Control Board (Water Board) shall impose restrictions to achieve a statewide 25% reduction in potable urban water usage through February 28, These restrictions will require water suppliers to California's cities and towns to reduce usage as compared to the amount used in These restrictions should consider the relative per capita water usage of each water suppliers' service area, and require that those areas with high per capita use achieve proportionally greater reductions than those with low use. The California Public Utilities Commission is requested to take similar action with respect to investor-owned utilities providing water services. 3. The Department of Water Resources (the Department) shall lead a statewide initiative, in partnership with local agencies, to collectively replace 50 million square feet of lawns and ornamental turf with drought tolerant landscapes. The Department shall provide funding to allow for lawn replacement programs in underserved communities, which will complement local programs already underway across the state. 4. The California Energy Commission, jointly with the Department and the Water Board, shall implement a time-limited statewide appliance rebate program to provide monetary incentives for the replacement of inefficient household devices. 5. The Water Board shall impose restrictions to require that commercial, industrial, and institutional properties, such as campuses, golf courses, and cemeteries, immediately implement water efficiency measures to reduce potable water usage in an amount consistent with the reduction targets mandated by Directive 2 of this Executive Order. 6. The Water Board shall prohibit irrigation with potable water of ornamental turf on public street medians. 7. The Water Board shall prohibit irrigation with potable water outside of newly constructed homes and buildings that is not delivered by drip or microspray systems. ~======================================================~

95 ~======================================================~ 8. The Water Board shall direct urban water suppliers to develop rate structures and other pricing mechanisms, including but not limited to surcharges, fees, and penalties, to maximize water conservation consistent with statewide water restrictions. The Water Board is directed to adopt emergency regulations, as it deems necessary, pursuant to Water Code section to implement this directive. The Water Board is further directed to work with state agencies and water suppliers to identify mechanisms that would encourage and facilitate the adoption of rate structures and other pricing mechanisms that promote water conservation. The California Public Utilities Commission is requested to take similar action with respect to investor-owned utilities providing water services. INCREASE ENFORCEMENT AGAINST WATER WASTE 9. The Water Board shall require urban water suppliers to provide monthly information on water usage, conservation, and enforcement on a permanent basis. 10. The Water Board shall require frequent reporting of water diversion and use by water right holders, conduct inspections to determine whether illegal diversions or wasteful and unreasonable use of water are occurring, and bring enforcement actions against illegal diverters and those engaging in the wasteful and unreasonable use of water. Pursuant to Government Code sections 8570 and 8627, the Water Board is granted authority to inspect property or diversion facilities to ascertain compliance-with water rights laws and regulations where there is cause to believe such laws and regulations have been violated. When access is not granted by a property owner, the Water Board may obtain an inspection warrant pursuant to the procedures set 1 forth in Title 13 (commencing with section ) of Part 3 of the Code of Civil Procedure for the purposes of conducting an inspection pursuant to this directive. 11. The Department shall update the State Model Water Efficient Landscape Ordinance through expedited regulation. This updated Ordinance shall increase water efficiency standards for new and existing landscapes through more efficient irrigation systems, greywater usage, onsite storm water capture, and by limiting the portion of landscapes that can be covered in turf. It will also require reporting on the implementation and enforcement of local ordinances, with required reports due by December 31, The Department shall provide information on local compliance to the Water Board, which shall consider adopting regulations or taking appropriate enforcement actions to promote compliance. The Department shall provide technical assistance and give priority in grant funding to public agencies for actions necessary to comply with local ordinances. 12. Agricultural water suppliers that supply water to more than 25,000 acres shall include in their required 2015 Agricultural Water Management Plans a detailed drought management plan that describes. the actions and measures the supplier will take to manage water demand during drought. The Department shall require those plans to include quantification of water supplies and demands for 2013, 2014, and 2015 to the extent data is available. The Department will provide technical assistance to water suppliers in preparing the plans. ~~ f.l U:.,lltlf ~======================================================~

96 ~======================================================~ 13. Agricultural water suppliers that supply water to 10,000 to 25,000 acres of irrigated lands shall develop Agricultural Water Management Plans and submit the plans to the Department by July 1, These plans shall include a detailed drought management plan and quantification of water supplies and demands in 2013, 2014, and 2015, to the extent that data is available. The Department shall give priority in grant funding to agricultural water suppliers that supply water to 10,000 to 25,000 acres of land for development and implementation of Agricultural Water Management Plans. 14. The Department shall report to Water Board on the status of the Agricultural Water Management Plan submittals within one month of receipt of those reports. 15. Local water agencies in high and medium priority groundwater basins shall immediately implement all requirements of the California Statewide Groundwater Elevation Monitoring Program pursuant to Water Code section The Department shall refer noncompliant local water agencies within high and medium priority groundwater basins to the Water Board by December 31, 2015, which shall consider adopting regulations or taking appropriate enforcement to promote compliance. 16. The California Energy Commission shall adopt emergency regulations establishing standards that improve the efficiency of water appliances, including toilets, urinals, and faucets available for sale and installation in new and existing buildings. INVEST IN NEW TECHNOLOGIES 17. The California Energy Commission, jointly with the Department and the Water Board, shall implement a Water Energy Technology (WET) program to deploy innovative water management technologies for businesses, residents, industries, and agriculture. This program will achieve water and energy savings and greenhouse gas reductions by accelerating use of cutting-edge technologies such as renewable energy-powered desalination, integrated onsite reuse systems, water-use monitoring software, irrigation system timing and precision technology, and on-farm precision technology. STREAMLINE GOVERNMENT RESPONSE 18. The Office of Emergency Services and the Department of Housing and Community Development shall work jointly with counties to provide temporary assistance for persons moving from housing units due to a lack of potable water who are served by a private well or water utility with less than 15 connections, and where all reasonable attempts to find a potable water source have been exhausted. 19. State permitting agencies shall prioritize review and approval of water infrastructure projects and programs that increase local water supplies, including water recycling facilities, reservoir improvement projects, surface water treatment plants, desalination plants, stormwater capture, and greywater systems. Agencies shall report to the Governor's Office on applications that have been pending for longer than 90 days. ~=======================================================~
97 ~======================================================~ 20. The Department shall take actions required to plan and, if necessary, implement Emergency Drought Salinity Barriers in coordination and consultation with the Water Board and the Department of Fish and Wildlife at locations within the Sacramento- San Joaquin delta estuary. These barriers will be designed to conserve water for use later in the year to meet state and federal Endangered Species Act requirements, preserve to the extent possible water quality in the Delta, and retain water supply for essential human health and safety uses in 2015 and in the future. 21. The Water Board and the Department of Fish and Wildlife shall immediately consider any necessary regulatory approvals for the purpose of installation of the Emergency Drought Salinity Barriers. 22. The Department shall immediately consider voluntary crop idling water transfer and water exchange proposals of one year or less in duration that are initiated by local public agencies and approved in 2015 by the Department subject to the criteria set forth in Water Code section The Water Board will prioritize new and amended safe drinking water permits that enhance water supply and reliability for community water systems facing water shortages or that expand service connections to include existing residences facing water shortages. As the Department of Public Health's drinking water program was transferred to the Water Board, any reference to the Department of Public Health in any prior Proclamation or Executive Order listed in Paragraph 1 is deemed to refer to the Water Board. 24. The California Department of Forestry and Fire Protection shall launch a public information campaign to educate the public on actions they can take to help to prevent wildfires including the proper treatment of dead and dying trees. Pursuant to Government Code section 8645, $1.2 million from the State Responsibility Area Fire Prevention Fund (Fund 3063) shall be allocated to the California Department of Forestry and Fire Protection to carry out this directive. 25. The Energy Commission shall expedite the processing of all applications or petitions for amendments to power plant certifications issued by the Energy Commission for the purpose of securing alternate water supply necessary for continued power plant operation. Title 20, section 1769 of the California Code of Regulations is hereby waived for any such petition, and the Energy Commission is authorized to create and implement an alternative process to consider such petitions. This process may delegate amendment approval authority, as appropriate, to the Energy Commission Executive Director. The Energy Commission shall give timely notice to all relevant local, regional, and state agencies of any petition subject to this directive, and shall post on its website any such petition. ~=======================================================~
98 ~======================================================!~ 26. For purposes of carrying out directives 2-9, 11, 16-17, 20-23, and 25, Division 13 (commencing with section ) of the Public Resources Code and regulations adopted pursuant to that Division are hereby suspended. This suspension applies to any actions taken by state agencies, and for actions taken by local agencies where the state agency with primary responsibility for implementing the directive concurs that local action is required, as well as for any necessary permits or approvals required to complete these actions. This suspension, and those specified in paragraph 9 of the January 17, 2014 Proclamation, paragraph 19 of the April 25, 2014 proclamation, and paragraph 4 of Executive Order B-26-14, shall remain in effect until May 31, Drought relief actions taken pursuant to these paragraphs that are started prior to May 31, 2016, but not completed, shall not be subject to Division 13 (commencing with section ) of the Public Resources Code for the time required to complete them. 27. For purposes of carrying out directives 20 and 21, section and Chapter 3 of Part 3 (commencing with section 85225) of the Water Code are suspended. 28. For actions called for in this proclamation in directive 20, the Department shall exercise any authority vested in the Central Valley Flood Protection Board, as codified in Water Code section 8521, et seq., that is necessary to enable these urgent actions to be taken more quickly than otherwise possible. The Director of the Department of Water Resources is specifically authorized, on behalf of the State of California, to request that the Secretary of the Army, on the recommendation of the Chief of Engineers of the Army Corps of Engineers, grant any permission required pursuant to section 14 of the Rivers and Harbors Act of 1899 and codified in section 48 of title 33 of the United States Code. 29. The Department is directed to enter into agreements with landowners for the purposes of planning and installation of the Emergency Drought Barriers in 2015 to the extent necessary to accommodate access to barrier locations, land-side and water-side construction, and materials staging in proximity to barrier locations. Where the Department is unable to reach an agreement with landowners, the Department may exercise the full authority of Government Code section For purposes of this Executive Order, chapter 3.5 (commencing with section 11340) of part 1 of division 3 of the Government Code and chapter 5 (commencing with section 25400) of division 15 of the Public Resources Code are suspended for the development and adoption of regulations or guidelines needed to carry out the provisions in this Order. Any entity issuing regulations or guidelines pursuant to this directive shall conduct a public. meeting on the regulations and guidelines prior to adopting them. ~=======================================================~
99 ~=======================================================~ 31. In order to ensure that equipment and services necessary for drought response can be procured quickly, the provisions of the Government Code and the Public Contract Code applicable to state contracts, including, but not limited to, advertising and competitive bidding requirements, are hereby suspended for directives 17, 20, and 24. Approval by the Department of Finance is required prior to the execution of any contract entered into pursuant to these directives. This Executive Order is not intended to, and does not, create any rights or benefits, substantive or procedural, enforceable at law or in equity, against the State of California, its agencies, departments, entities, officers, employees, or any other person. I FURTHER DIRECT that as soon as hereafter possible, this Order be filed in the Office of the Secretary of State and that widespread publicity and notice be given to this Order. IN WITNESS WHEREOF I have hereunto set my hand and caused the Great Seal of the State of California to be affixed this 1 51 day of April2015. EDMUND G. BROWN JR. Governor of California ATTEST: ALEX PADILLA Secretary of State ~======================================================~
100


101
102

103
104

105
106

107
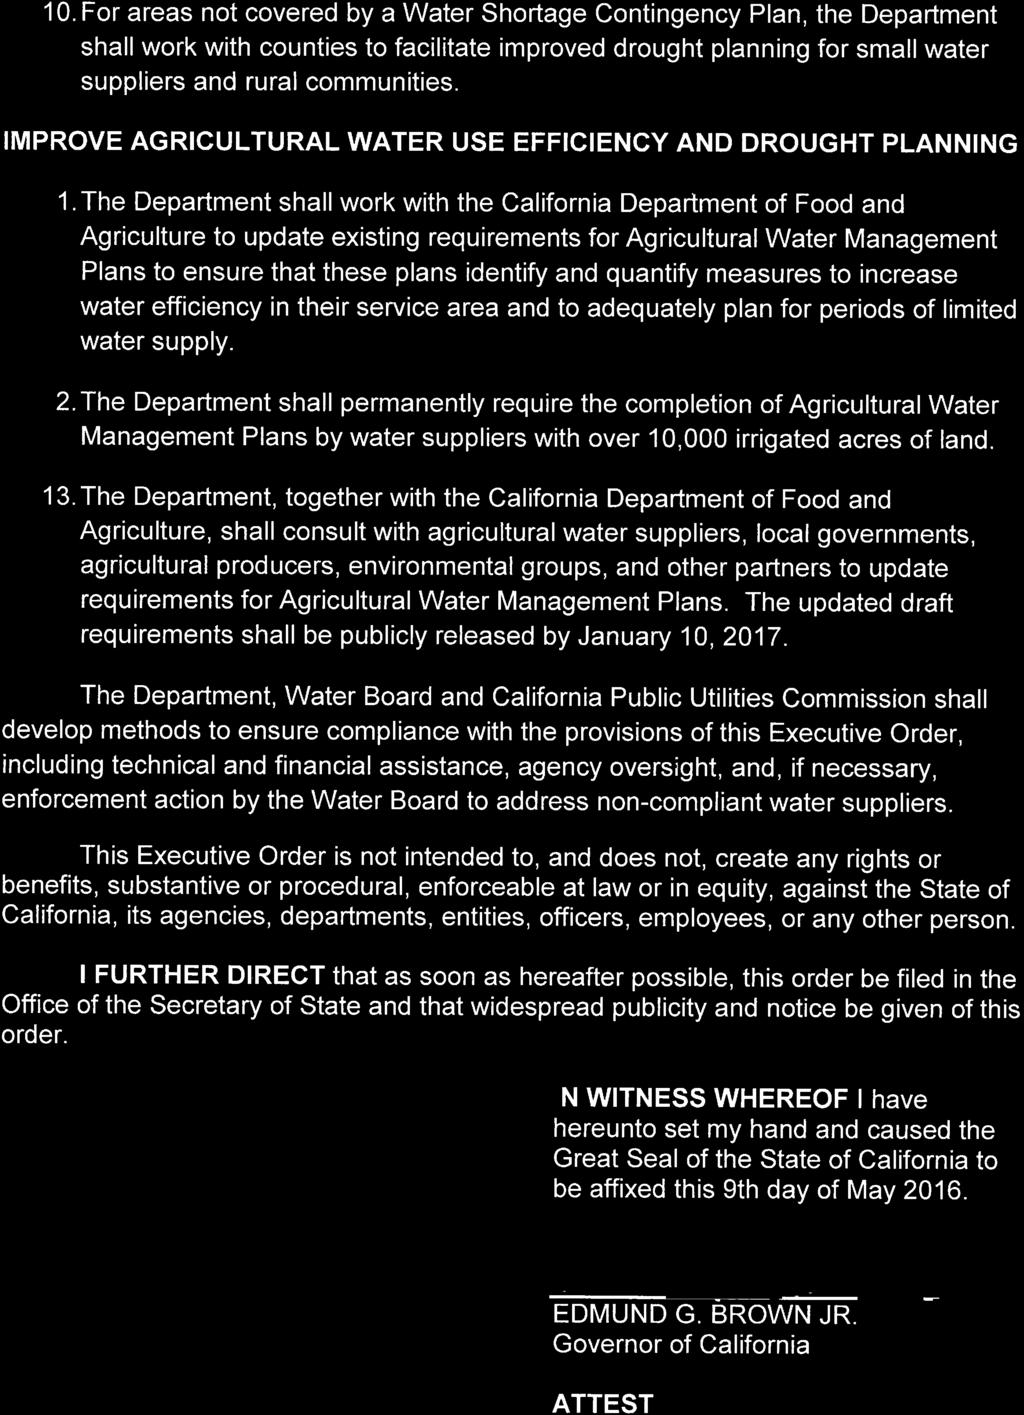


108
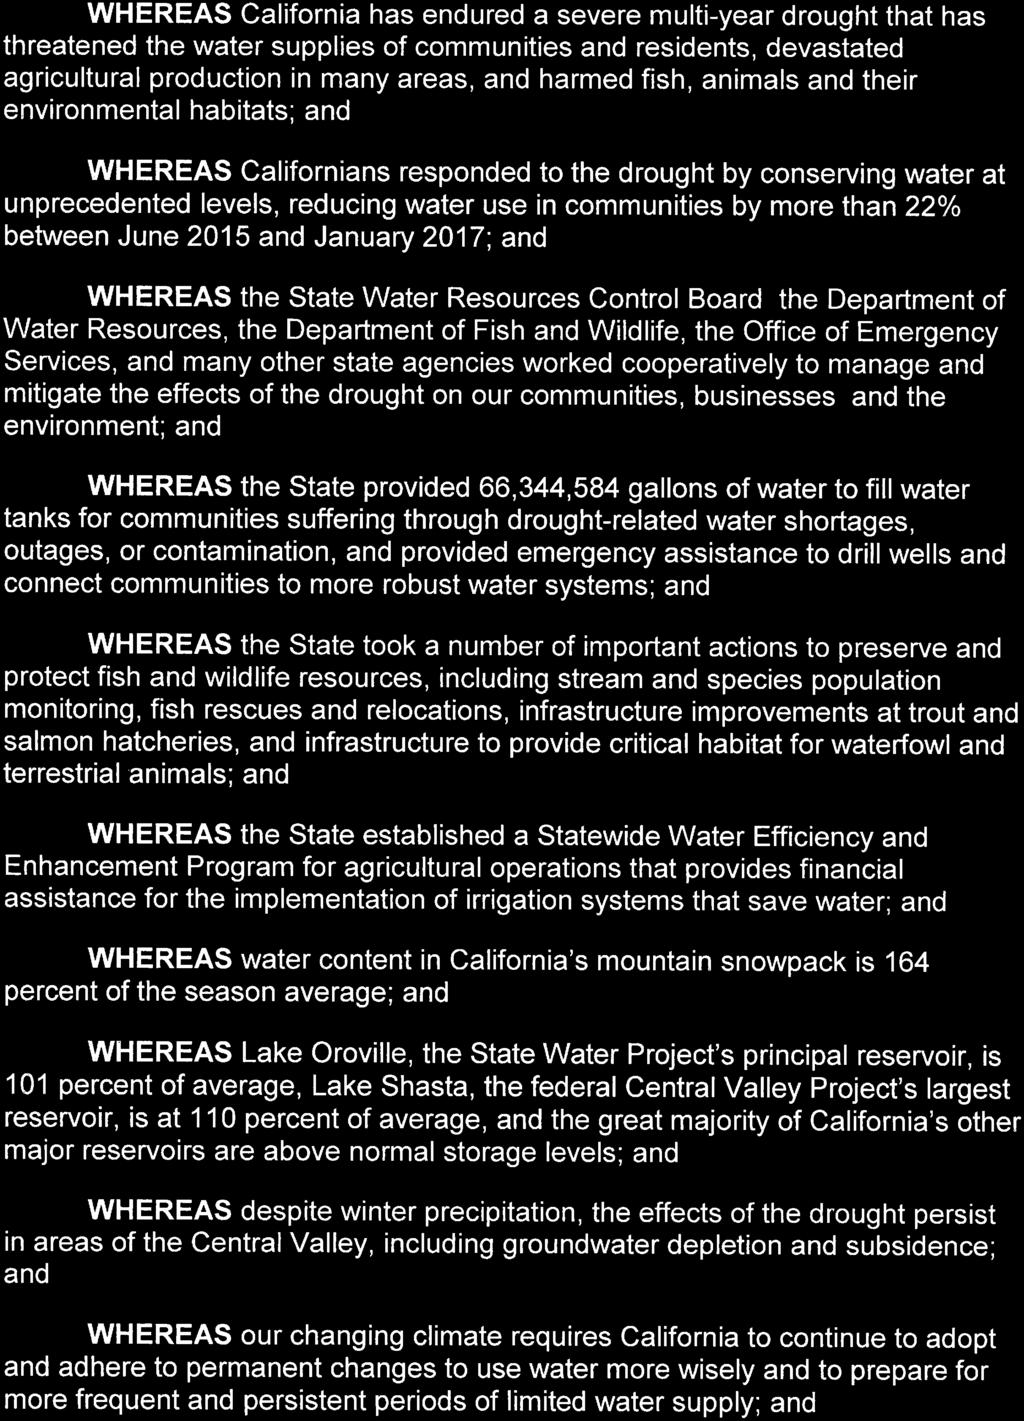
109

110

111


112
113 Appendix B State Water Resources Control Board Drought Regulations
114
115 July 2014 SWRCB Emergency Regulation
116
117 STATE WATER RESOURCES CONTROL BOARD RESOLUTION NO TO ADOPT AN EMERGENCY REGULATION FOR STATEWIDE URBAN WATER CONSERVATION WHEREAS: 1. On April 25, 2014, Governor Edmund G. Brown Jr. issued an executive order to strengthen the state s ability to manage water and habitat effectively in drought conditions and called on all Californians to redouble their efforts to conserve water. The executive order finds that the continuous severe drought conditions present urgent challenges across the state including water shortages in communities and for agricultural production, increased wildfires, degraded habitat for fish and wildlife, threat of saltwater contamination, and additional water scarcity if drought conditions continue into The National Integrated Drought Information System reported that nearly 80% of the state was reported to be under "extreme" drought conditions at the end of June; 2. The executive order refers to the Governor s Proclamation No , issued on January 17, 2014, declaring a State of Emergency to exist in California due to severe drought conditions. The January Proclamation notes that the state is experiencing record dry conditions, with 2014 projected to become the driest year on record. Since January, state water officials indicate that reservoirs, rainfall totals and the snowpack remain critically low. This follows two other dry or below average years, leaving reservoir storage at alarmingly low levels. The January Proclamation highlights the State s dry conditions, lack of precipitation and the resulting effects on drinking water supplies, the cultivation of crops, and the survival of animals and plants that rely on California s rivers and streams. The January Proclamation also calls on all Californians to reduce their water usage by 20 percent; 3. There is no guarantee that winter precipitation will alleviate the drought conditions that the executive orders address, which will lead to even more severe impacts across the state if the drought wears on; 4. Water Code section grants the State Water Board the authority to adopt emergency regulations in certain drought years in order to: prevent the waste, unreasonable use, unreasonable method of use, or unreasonable method of diversion, of water, to promote water recycling or water conservation, to require curtailment of diversions when water is not available under the diverter s priority of right, or in furtherance of any of the foregoing, to require reporting of diversion or use or the preparation of monitoring reports ; 5. Over 400,000 acres of farmland are expected to be fallowed, thousands of people may be out of work, communities risk running out of drinking water, and fish and wildlife will suffer.
118 6. Many Californians have taken bold steps over the years and in this year to reduce water use; nevertheless, the dire nature of the current drought requires additional conservation actions from residents and businesses. Some severely affected communities have implemented water rationing, limiting water use in some cases to only 50 gallons per person per day, foregoing showers, laundry, toilet flushing, and all outdoor watering. 7. Water conservation is the easiest, most efficient and most cost effective way to quickly reduce water demand and extend supplies into the next year, providing flexibility for all California communities. Water saved this summer is water available next year, giving water suppliers the flexibility to manage their systems efficiently. The more water that is conserved now, the less likely it is that a community will experience such dire circumstances that water rationing is required ; 8. Most Californians use more water outdoors than indoors. In many areas, 50 percent or more of daily water use is for lawns and outdoor landscaping. Outdoor water use is generally discretionary, and many irrigated landscapes would not suffer greatly from receiving a decreased amount of water; 9. Public information and awareness is critical to achieving conservation goals and the Save Our Water campaign, run jointly by the Department of Water Resources (DWR) and the Association of California Water Agencies, is an excellent resource for conservation information and messaging that is integral to effective drought response ( 10. Enforcement against water waste is a key tool in conservation programs. When conservation becomes a social norm in a community, the need for enforcement is reduced or eliminated; 11. The emergency regulations set a minimum standard requiring only modest lifestyle changes across the state. Many communities are already doing more and have been for years. They should be commended, but can and should do more. Others are not yet doing so and should at least do this, but should do much more given the severity of the drought; 12. On July 8, 2014, the State Water Board issued public notice that the State Water Board would consider the adoption of the regulation at the Board s regularly-scheduled July 15, 2014 public meeting, in accordance with applicable State laws and regulations. The State Water Board also distributed for public review and comment a Finding of Emergency that complies with State laws and regulations; 13. On April 25, 2014, the Governor suspended the California Environmental Quality Act s application to the State Water Board s adoption of emergency regulations pursuant to Water Code section to prevent the waste, unreasonable use, unreasonable method of use, or unreasonable method of diversion of water, to promote water recycling or water conservation; 14. As discussed above, the State Water Board is adopting the emergency regulation because of emergency drought conditions, the need for prompt action, and current limitations in the existing enforcement process; 2
119 15. Disadvantaged communities may require assistance in increasing water conservation and state agencies should look for opportunities to provide assistance in promoting water conservation; 16. Nothing in the regulations or in the enforcement provisions of the regulations, preclude a local agency from exercising its authority to adopt more stringent conservation measures. Moreover, the Water Code does not impose a mandatory penalty for violations of the regulations adopted by this resolution and local agencies retain their enforcement discretion in enforcing the regulations, to the extent authorized, and may develop their own progressive enforcement practices to encourage conservation. THEREFORE BE IT RESOLVED THAT: 1. The State Water Board adopts California Code of Regulations, title 23, sections 863, 864, and 865, as appended to this resolution as an emergency regulation; 2. The State Water Board staff will submit the regulation to the Office of Administrative Law (OAL) for final approval; 3. If, during the approval process, State Water Board staff, the State Water Board, or OAL determines that minor corrections to the language of the regulation or supporting documentation are needed for clarity or consistency, the State Water Board Executive Director or designee may make such changes; 4. These regulations shall remain in effect for 270 days after filing with the Secretary of State unless the State Water Board determines that it is no longer necessary due to changed conditions, or unless the State Water Board renews the regulations due to continued drought conditions as described in Water Code section ; 5. The State Water Board directs staff to provide the Board with monthly updates on the implementation of the emergency regulations and their effect; 6. Directs State Water Board staff to condition funding upon compliance with the emergency regulations, to the extent feasible; 7. Directs State Water Board staff to work with the Department of Water Resources and the Save Our Water campaign to disseminate information regarding the emergency regulations; and 8. Directs State Water Board staff in developing an electronic reporting portal to include data fields so that local agencies may provide monthly reporting data on (i) conservationrelated implementation measures or enforcement actions taken by the local agency and (ii) substitution during the drought of potable water with recycled water to extend water supplies. 3
120 THEREFORE BE IT FURTHER RESOLVED THAT: 9. The State Water Board commends water suppliers that have increased conservation messaging and adopted innovative strategies to enhance customer awareness of water use, such as applications that let customers compare their water use to water use by others; reduce system losses, such as fixing system leaks which can deplete supplies by 10 percent or more; and establish incentives to reduce demand, such as tiered or drought rate structures. The State Water Board also commends all Californians that have already been working to maximize their conservation efforts, both at home and at work; 10. The State Water Board calls upon water suppliers to take the following actions: Educate customers and employees Retail water suppliers should provide notice of the regulations in English and Spanish in one or more of the following ways: newspaper advertisements, bill inserts, website homepage, social media, notices in public libraries; Wholesale suppliers should include reference to the regulations in their customer communications; All water suppliers should train personnel on the regulations; All water suppliers should provide signage where recycled or reclaimed water is being used for activities that the emergency regulations prohibit with the use of potable water, such as operation of fountains and other water features; All water suppliers should redouble their efforts to disseminate information regarding opportunities and incentives to upgrade indoor fixtures and appliances; All water suppliers should use education and the tools available through the Save Our Water website ( and All water suppliers should educate and prepare their boards and councils on the drought response actions contained in the emergency regulations and in this resolution, and to make sure that drought response items are placed on agendas as early as possible; Increasing local supplies All water suppliers should accelerate the completion of projects that will conserve potable water by making use of non-potable supplies, such as recycled water, greywater, and stormwater collection projects; All water suppliers should improve their leak reporting and response programs and request that police and fire departments and other local government personnel report leaks and water waste that they encounter during their routine duties/patrols; Smaller water suppliers those with fewer than 3,000 service connections should take proactive steps to secure their communities water supplies and educate their customers about water conservation and the status of their supply reserves; All water suppliers should conduct water loss audits and make leak detection and repair a top priority for the duration of the drought; and All urban water suppliers should evaluate their rate structures and begin to implement needed changes as part of planning for another dry year. Information and assistance on setting and implementing drought rates is available from the Alliance for Water Efficiency. ( 4
121 11. The State Water Board calls on all Californians to take the following additional actions: Further reduce water demand, whether by using less water in daily routines indoors and out, retrofitting appliances and installing greywater and rainwater catchment systems; and Check residential and business water bills to see if there are high charges that may indicate a leak and to fix the leak, if they are able, or contact their local water utility if they need assistance. 12. The State Water Board encourages its staff, the Department of Water Resources, the Public Utilities Commission, urban water suppliers, and other local agencies to look for opportunities to encourage and promote new technologies that reduce water usage, including through timely access to water usage information and behavioral response. 13. The State Water Board encourages all state and local agencies to look for additional opportunities to minimize potable water use in outdoor spaces. 14. The State Water Board encourages investor-owned utilities to expeditiously submit applications for implementation of the regulations to the California Public Utilities Commission. CERTIFICATION The undersigned Clerk to the Board does hereby certify that the foregoing is a full, true, and correct copy of a resolution duly and regularly adopted at a meeting of the State Water Resources Control Board held on July 15, AYE: NAY: ABSENT: ABSTAIN: Chair Felicia Marcus Vice Chair Frances Spivy-Weber Board Member Steven Moore Board Member Dorene D Adamo None Board Member Tam M. Doduc None Jeanine Townsend Clerk to the Board 5
122
123 PROPOSED TEXT OF EMERGENCY REGULATIONS Article Drought Emergency Water Conservation Sec. 863 Findings of Drought Emergency (a) The State Water Resources Control Board finds as follows: (1) On January 17, 2014, the Governor issued a proclamation of a state of emergency under the California Emergency Services Act based on drought conditions; (2) On April 25, 2014, the Governor issued a proclamation of a continued state of emergency under the California Emergency Services Act based on continued drought conditions; (3) The drought conditions that formed the basis of the Governor s emergency proclamations continue to exist; (4) The present year is critically dry and has been immediately preceded by two or more consecutive below normal, dry, or critically dry years; and (5) The drought conditions will likely continue for the foreseeable future and additional action by both the State Water Resources Control Board and local water suppliers will likely be necessary to further promote conservation. Authority: Wat. Code, References: Wat. Code, 102, 104, 105. Sec. 864 Prohibited Activities in Promotion of Water Conservation (a) To promote water conservation, each of the following actions is prohibited, except where necessary to address an immediate health and safety need or to comply with a term or condition in a permit issued by a state or federal agency: (1) The application of potable water to outdoor landscapes in a manner that causes runoff such that water flows onto adjacent property, non-irrigated areas, private and public walkways, roadways, parking lots, or structures; (2) The use of a hose that dispenses potable water to wash a motor vehicle, except where the hose is fitted with a shut-off nozzle or device attached to it that causes it to cease dispensing water immediately when not in use; (3) The application of potable water to driveways and sidewalks; and (4) The use of potable water in a fountain or other decorative water feature, except where the water is part of a recirculating system. (b) The taking of any action prohibited in subdivision (a) of this section, in addition to any other applicable civil or criminal penalties, is an infraction, punishable by a fine of up to five hundred dollars ($500) for each day in which the violation occurs. Authority: Wat. Code, References: Wat. Code, 102, 104, 105.
124 PROPOSED TEXT OF EMERGENCY REGULATIONS Sec. 865 Mandatory Actions by Water Suppliers (a) The term urban water supplier, when used in this section, refers to a supplier that meets the definition set forth in Water Code section 10617, except it does not refer to suppliers when they are functioning solely in a wholesale capacity, but does apply to suppliers when they are functioning in a retail capacity. (b)(1) To promote water conservation, each urban water supplier shall implement all requirements and actions of the stage of its water shortage contingency plan that imposes mandatory restrictions on outdoor irrigation of ornamental landscapes or turf with potable water. (2) As an alternative to subdivision (b)(1), an urban water supplier may submit a request to the Executive Director for approval of an alternate plan that includes allocation-based rate structures that satisfies the requirements of chapter 3.4 (commencing with section 370) of division 1 of the Water Code, and the Executive Director may approve such an alternate plan upon determining that the rate structure, in conjunction with other measures, achieves a level of conservation that would be superior to that achieved by implementing limitations on outdoor irrigation of ornamental landscapes or turf with potable water by the persons it serves to no more than two days per week. (c) To promote water conservation, each urban water supplier that does not have a water shortage contingency plan or has been notified by the Department of Water Resources that its water shortage contingency plan does not meet the requirements of Water Code section shall, within thirty (30) days, limit outdoor irrigation of ornamental landscapes or turf with potable water by the persons it serves to no more than two days per week or shall implement another mandatory conservation measure or measures intended to achieve a comparable reduction in water consumption by the persons it serves relative to the amount consumed in (d) In furtherance of the promotion of water conservation each urban water supplier shall prepare and submit to the State Water Resources Control Board by the 15 th of each month a monitoring report on forms provided by the Board. The monitoring report shall include the amount of potable water the urban water supplier produced, including water provided by a wholesaler, in the preceding calendar month and shall compare that amount to the amount produced in the same calendar month in Beginning October 15, 2014, the monitoring report shall also estimate the gallons of water per person per day used by the residential customers it serves. In its initial monitoring report, each urban water supplier shall state the number of persons it serves. (e) To promote water conservation, each distributor of a public water supply, as defined in Water Code section 350, that is not an urban water supplier shall, within thirty (30) days, take one or more of the following actions: (1) Limit outdoor irrigation of ornamental landscapes or turf with potable water by the persons it serves to no more than two days per week; or (2) Implement another mandatory conservation measure or measures intended to achieve a comparable reduction in water consumption by the persons it serves relative to the amount consumed in Authority: Wat. Code, References: Wat. Code, 102, 104, 105; 350; 10617;
125 March 2015 SWRCB Emergency Regulation
126
127 STATE WATER RESOURCES CONTROL BOARD RESOLUTION NO TO ADOPT AN EMERGENCY REGULATIONS FOR STATEWIDE URBAN WATER CONSERVATION WHEREAS: 1. On April 25, 2014, Governor Edmund G. Brown Jr. issued an executive order (April 2014 Proclamation) to strengthen the State s ability to manage water and habitat effectively in drought conditions, and called on all Californians to redouble their efforts to conserve water. The April 2014 Proclamation finds that the continuous severe drought conditions present urgent challenges across the State, including water shortages in communities and for agricultural production, increased wildfires, degraded habitat for fish and wildlife, threat of saltwater contamination, and additional water scarcity, if drought conditions continue into The April 2014 Proclamation also suspends the environmental review required by the California Environmental Quality Act to allow the emergency regulation and other actions to take place as quickly as possible; 2. The April 2014 Proclamation refers to the Governor s Proclamation No , issued on January 17, 2014, declaring a drought State of Emergency to exist in California due to severe drought conditions (January 2014 Proclamation). The January 2014 Proclamation finds that dry conditions and lack of precipitation present urgent problems to drinking water supplies and cultivation of crops, which put farmers longterm investments at risk. The conditions also threaten the survival of animals and plants that rely on California s rivers, including many species in danger of extinction. The January 2014 Proclamation also calls on all Californians to reduce their water usage by 20 percent; 3. On December 22, 2014, in light of the continued lack of rain, Governor Brown issued Executive Order B-28-14, which extends the California Environmental Quality Act suspension through May 31, 2016 for Water Code section and certain activities identified in the January 2014 and April 2014 proclamations; 4. Drought conditions are continuing. As of March 3, 2015, snow water equivalents for the Northern, Central, and Southern Sierra regions were at 16 percent, 20 percent, and 21 percent of normal for that date, respectively. Additionally, most reservoirs are less than 60 percent full and January 2015 was one of the driest months ever recorded in California history. Moreover, many communities face the prospect of needing emergency drinking water supplies; 5. The likelihood that any additional precipitation will significantly reduce the severity of drought conditions this year is extremely low; 6. Water Code section grants the State Water Board the authority to adopt emergency regulations in certain drought years in order to: prevent the waste, unreasonable use, unreasonable method of use, or unreasonable method of diversion, of water, to promote water recycling or water conservation, to require curtailment of diversions when water is not available under the diverter s priority of right, or in furtherance of any of the foregoing, to require reporting of diversion or use or the preparation of monitoring reports ;
128 7. On July 15, 2014, the State Water Board adopted an emergency regulation to support water conservation (Resolution No ), and that regulation became effective July 28, 2014 upon approval by the Office of Administrative Law (OAL); 8. The current emergency regulation will expire on April 25, 2015; 9. The current emergency regulation has supported Californians water conservation efforts, with over 119 billion gallons saved from August 2014 through January 2015; 10. Many Californians have taken bold steps over the years and in this year to reduce water use; nevertheless, the dire nature of the current drought requires additional conservation actions from residents and businesses. Some severely-affected communities have implemented water rationing, limiting water use in some cases to only 50 gallons per person per day, foregoing showers, laundry, toilet flushing, and all outdoor watering; 11. Water conservation is the easiest, most efficient and most cost-effective way to quickly reduce water demand and extend supplies into the next year, providing flexibility for all California communities. Water saved this summer is water available later in the season or next year, giving water suppliers the flexibility to manage their systems efficiently; 12. In many areas, 50 percent or more of daily water use is for lawns and outdoor landscaping. Outdoor water use is generally discretionary, and many irrigated landscapes would not suffer greatly from receiving a decreased amount of water; 13. Most urban water suppliers have placed restrictions on outdoor watering, but the State Water Board has nevertheless received many reports of excessive water use; 14. Education and enforcement against water waste is a key tool in conservation programs. When conservation becomes a social norm in a community, the need for enforcement is reduced or eliminated; 15. Public information and awareness is critical to achieving conservation goals, and the Save Our Water campaign, run jointly by the Department of Water Resources (DWR) and the Association of California Water Agencies, is an excellent resource for conservation information and messaging that is integral to effective drought response ( 16. Other parts of the world have faced social and economic hardship due to severe drought. Californians must continue to make lifestyle changes, including landscape choices that conserve even more water; 17. On March 6, 2015, the State Water Board issued public notice that it would consider the adoption of the emergency regulation at the Board s regularly-scheduled March 17, 2015 public meeting, in accordance with applicable State laws and regulations. The State Water Board also distributed for public review and comment a Finding of Emergency that complies with State laws and regulations; 18. As discussed above, the State Water Board is adopting the emergency regulation because of the continuing emergency drought conditions, the need for prompt action, and the need to act before the current emergency regulation expires on April 25, 2015; and 2
129 19. Nothing in the regulation or in the enforcement provisions of the regulation precludes a local agency from exercising its authority to adopt more stringent conservation measures. Moreover, the Water Code does not impose a mandatory penalty for violations of the regulation adopted by this resolution, and local agencies retain the enforcement discretion in enforcing the regulation to the extent authorized. Local agencies are encouraged to develop their own progressive enforcement practices to promote conservation. THEREFORE BE IT RESOLVED THAT: 1. The State Water Board re-adopts California Code of Regulations, title 23, sections 863, 864,and 865, as appended to this resolution as an emergency regulation; 2. State Water Board staff will submit the regulation to the OAL for final approval; 3. If, during the approval process, State Water Board staff, the State Water Board, or OAL determines that minor corrections to the language of the regulation or supporting documentation are needed for clarity or consistency, the State Water Board Executive Director or designee may make such changes; 4. This regulation shall remain in effect for 270 days after filing with the Secretary of State unless the State Water Board determines that it is no longer necessary due to changed conditions, or unless the State Water Board renews the regulation due to continued drought conditions as described in Water Code section ; 5. The State Water Board directs staff to provide the Board with monthly updates on the implementation of the emergency regulation and its effect; 6. The State Water Board directs staff to condition funding upon compliance with the emergency regulation, to the extent feasible; 7. The State Water Board directs staff to work with the DWR and the Save Our Water campaign to disseminate information regarding the emergency regulations; and 8. The State Water Board directs staff to update the electronic reporting portal to include data fields for local agencies to report on compliance and enforcement activities. THEREFORE BE IT FURTHER RESOLVED THAT: 9. The State Water Board commends Californians who heeded the call for conservation and have helped to save over 119 billion gallons from August 2014 through January The State Water Board calls upon Californians to redouble their conservation efforts in the face of a fourth year of severe drought. For homeowners and businesses that have delayed removing turf, planting drought-tolerant landscapes, or installing efficient irrigation systems, the time to act is now; 3
130 10. The State Water Board calls upon water suppliers to ensure that they have adequate personnel and financial resources to implement conservation requirements not only for 2015, but also for another year of drought should it occur. Water suppliers that face budget shortfalls due to reduced sales should take immediate steps to raise necessary revenues in a way that actively promotes continued conservation. In Resolution No , the State Water Board called on all urban water suppliers to evaluate their rate structures and begin to implement needed changes as part of planning for another dry year. These efforts should be continued and redoubled; 11. Disadvantaged communities may require assistance in increasing water conservation and State agencies should look for opportunities to provide assistance in promoting water conservation; 12. The State Water Board calls upon all water suppliers to take further actions to increase water conservation, such as by: a. providing customers with timely and easy-to-understand information on the average b. number of gallons they use each month and each day within their billing period; accelerating the completion of projects that will conserve potable water by making use of non-potable supplies, such as recycled water and stormwater collection projects; and c. accelerating projects to fix leaks, and to conduct a system-wide water loss audit as soon as possible; 13. The State Water Board calls upon the restaurant and hospitality industry to take further actions to increase water conservation, such as by utilizing water efficient pre-rinse spray valves for dish washing and training staff on the new regulation so that the minimum amount of water is used to wash towels and linens; and 14. The State Water Board directs staff to develop a statewide portal for reporting water waste. CERTIFICATION The undersigned Clerk to the Board does hereby certify that the foregoing is a full, true, and correct copy of a resolution duly and regularly adopted at a meeting of the State Water Resources Control Board held on March 17, AYE: NAY: ABSENT: ABSTAIN: Chair Felicia Marcus Vice Chair Frances Spivy-Weber Board Member Tam M. Doduc Board Member Steven Moore Board Member Dorene D Adamo None None None Jeanine Townsend Clerk to the Board 4
131 ADOPTED TEXT OF EMERGENCY REGULATION Article Drought Emergency Water Conservation Sec. 863 Findings of Drought Emergency (a) The State Water Resources Control Board finds as follows: (1) On January 17, 2014, the Governor issued a proclamation of a state of emergency under the California Emergency Services Act based on drought conditions; (2) On April 25, 2014, the Governor issued a proclamation of a continued state of emergency under the California Emergency Services Act based on continued drought conditions; (3) The drought conditions that formed the basis of the Governor s emergency proclamations continue to exist; (4) The present year is critically dry and has been immediately preceded by two or more consecutive below normal, dry, or critically dry years; and (5) The drought conditions will likely continue for the foreseeable future and additional action by both the State Water Resources Control Board and local water suppliers will likely be necessary to further promote conservation. Authority: Wat. Code, References: Wat. Code, 102, 104, 105. Sec. 864 Prohibited ActivitiesEnd-User Requirements in Promotion of Water Conservation (a) To promote water conservation, each of the following actions is prohibited, except where necessary to address an immediate health and safety need or to comply with a term or condition in a permit issued by a state or federal agency: (1) The application of potable water to outdoor landscapes in a manner that causes runoff such that water flows onto adjacent property, non-irrigated areas, private and public walkways, roadways, parking lots, or structures; (2) The use of a hose that dispenses potable water to wash a motor vehicle, except where the hose is fitted with a shut-off nozzle or device attached to it that causes it to cease dispensing water immediately when not in use; (3) The application of potable water to driveways and sidewalks; and (4) The use of potable water in a fountain or other decorative water feature, except where the water is part of a recirculating system.; (5) The application of potable water to outdoor landscapes during and within 48 hours after measurable rainfall; and (6) The serving of drinking water other than upon request in eating or drinking establishments, including but not limited to restaurants, hotels, cafes, cafeterias, bars, or other public places where food or drink are served and/or purchased. (b) To promote water conservation, operators of hotels and motels shall provide guests with the option of choosing not to have towels and linens laundered daily. The hotel or motel shall prominently display notice of this option in each guestroom using clear and easily understood language. 1
132 (b)(c) The taking of any action prohibited in subdivision (a) or the failure to take any action required in subdivision (b) of this section, in addition to any other applicable civil or criminal penalties, is an infraction, punishable by a fine of up to five hundred dollars ($500) for each day in which the violation occurs. Authority: Wat. Code, References: Wat. Code, 102, 104, 105. Sec. 865 Mandatory Actions by Water Suppliers (a) The term urban water supplier, when used in this section, refers to a supplier that meets the definition set forth in Water Code section 10617, except it does not refer to suppliers when they are functioning solely in a wholesale capacity, but does apply to suppliers when they are functioning in a retail capacity. (b)(1) To promote water conservation, each urban water supplier shall implement all requirements and actions of the stage of its water shortage contingency plan that imposes includes mandatory restrictions on the number of days that outdoor irrigation of ornamental landscapes or turf with potable water is allowed, or shall amend its water shortage contingency plan to include mandatory restrictions on the number of days that outdoor irrigation of ornamental landscapes or turf with potable water is allowed and implement these restrictions within forty-five (45) days. Urban water suppliers with approved alternate plans as described in subdivision (b)(2) are exempted from this requirement. (2) As an alternative to subdivision (b)(1) aan urban water supplier may submit a request to the Executive Director for approval of an alternate plan that includes allocation-based rate structures that satisfies the requirements of chapter 3.4 (commencing with section 370) of division 1 of the Water Code, and the Executive Director may approve such an alternate plan upon determining that the rate structure, in conjunction with other measures, achieves a level of conservation that would be superior to that achieved by implementing limitations on outdoor irrigation of ornamental landscapes or turf with potable water by the persons it serves to no more than two days per week. (c) To promote water conservation, each urban water supplier that does not have a water shortage contingency plan that restricts the number of days that outdoor irrigation of ornamental landscapes and turf with potable water is allowed, or has been notified by the Department of Water Resources that its water shortage contingency plan does not meet the requirements of Water Code section shall, within thirty forty-five (3045) days, limit outdoor irrigation of ornamental landscapes or turf with potable water by the persons it serves to no more than two days per week or shall implement another mandatory conservation measure or measures intended to achieve a comparable reduction in water consumption by the persons it serves relative to the amount consumed in (d) In furtherance of the promotion of water conservation each urban water supplier shall: (1) Provide prompt notice to a customer whenever the supplier obtains information that indicates that a leak may exist within the end-users exclusive control. (2) Prepare and submit to the State Water Resources Control Board by the 15 th of each month a monitoring report on forms provided by the Board. The monitoring report 2
133 shall include the amount of potable water the urban water supplier produced, including water provided by a wholesaler, in the preceding calendar month and shall compare that amount to the amount produced in the same calendar month in Beginning October 15, 2014, tthe monitoring report shall specify the population served by the urban water supplier, the percentage of water produced that is used for the residential sector, descriptive statistics on water conservation compliance and enforcement efforts, and the number of days that outdoor irrigation is allowed. The monitoring report shall also estimate the gallons of water per person per day used by the residential customers it serves. In its initial monitoring report, each urban water supplier shall state the number of persons it serves. (e) To promote water conservation, each distributor of a public water supply, as defined in Water Code section 350, that is not an urban water supplier shall, within thirty forty-five (3045) days, take one or more of the following actions: (1) Limit outdoor irrigation of ornamental landscapes or turf with potable water by the persons it serves to no more than two days per week; or (2) Implement another mandatory conservation measure or measures intended to achieve a comparable20 percent reduction in water consumption by the persons it serves relative to the amount consumed in Authority: Wat. Code, References: Wat. Code, 102, 104, 105; 350; 10617;
134
135 May 2015 SWRCB Emergency Regulation
136
137 t i '. i ~ In re: State Water Resources Control Board NOTICE OF APPROVAL OF EMERGENCY REGULATORY ACTION Regulatory Action: Title 23, California Code of Regulations Adopt sections: 863, 864, 865, 866 Amend sections: Repeal sections: Government Code Sections and ; Water Code Section OAL File No EE The State Water Resources Control Board submitted this action to readopt and further amend three sections, adapted in OAL file no E and readopted in OAL file no EE, and to adopt a new section in title 23 of the California Code of Regulations pertaining to drought emergency water conservation. The updated regulations are intended to safeguard urban water supplies in the event of continued draught, minimize the potential for waste and unreasonable use of water, and achieve the 25.percent statewide potable water usage reduction ordered by Governor Brown in his April 1, 2015 executive order. OAL approves this emergency regulatory action pursuant to sections and of the Government Cade and section of the Water Code. This emergency regulatory action is effective on 5/18/2015 and will expire on 2113/2016. The Certificate of Compliance for this action is due no later than 2/12/2016. Date: 5/18/ Senior Attorney i C' ~ ' Original: Thomas Howard Copy: David Rose 1
138

139 srnteofca~.if~awn-officeofnaminisrr~ra ~~-~~~:v ~ C~lC~TIC~ 1~lDBLICAT14i1i/R~C~I~~.l~~"1~31~~ Stj~Nil~SIG~f~f sro.aorjf~e~1.0 ~-2ot31 - ~ _.. ~_ -- (S c is~str iic#ions on r,~;,verse} for use 6y SBccetary of State only OAL FILE. NOTICE FILE NUtv18ER~ ~ REGUCAI..RY ACT10N NUMB"1 EMERGf`: ;Y NUMBER v~;~,qeh~ ~:. 2.0~: ~o~ls6-(~~ ~ ENDC~i~SED m ~~~ For use by Office of Administrative.Law (OAL1 only itt th8 OffiCB Of t#t9 S8Cr8t8ry Of 3t~t~ of tt e State of California ~`~ r,c ~!'~ ~'1~'~ NOTICE AGENCYWITHRUI,ENUtKtMGAUTHOAtfY `State Waier Resources Contrvl`Baard (REGULATIONS AGENCY --- FILENVMBER(Ifany} A. PUBLICATION OF NOTICE (Complete far pablisa#ion in Notice Regis#er}. i.'subject OF NOTICE -7~7'tg(g? - FIRST SECTION AFFECTED 2. RE4UESTED PUBLICATION DATE 3, NOTIGE7YPE 4. AGENCY CONTACTPER50N TELEPHONE NUMBER PAX NUMBER (Optional) Nofice re Proposed Re u~ato Action ether AC71QN ON OAL I..JSE PROPOSED NOTICE NOTICE REGISTER NUMBER ~ PUBIIGATION Oh7E Approved as ~ ~PProved as ~ C]isappn,~~rf/ ONLY Submitted Modified ~thcra,vn ~ ~ B. ~~1BMIS5lON!!E REGtil.,4TlON5 4~~~plet~ whey submitting reputations} a: SUB.IECT OF REGULATIONS) Drought Emergency Water Conservation 1 b. AlL F'REV IOUS RELATED OAL REGULATORY AGTIpN NUMBERS) OALFile No.2014-Q738-Q1-E;201: Q1 EE 3.5{'EGIFYCAUFORNIA CODE VF ftegulat10n5 TITLEiS) AND SECTION(5) tirtcluding title2fi,iftouirsretated) AooP-r SECTtON(S) AFFECTED ~~.ist alf section numbers) $63, Sb4r 8651 ~ ~~ individually.attach nmena add~tionat shqet if needed.) TiTLE(S) z~ 3. TYPE OF flllng REPEAL _ psr a~bngy Regular Rulemaking (Gov. ~ Certificate of Compliance: The agency officernamed' Cod~g77346) ~ )( Emer 4 enc Y iieadn P t{(,,ov. below hangeswithoutregulatory certifies that Yhis agency complied witfi the. Code, 1 ~3A6.1(h1j Resubmittal of disapproved or ~ ~~~ (Cal. Code provisions of Gov. Regs..Yide Code ~ either ~ ~1~~ withdrawn nonemergency before the emergency regulation was adopted or filing (Gov. Code , within the Fife&PCiM time period requited by statute Print Only ) Emergency (Gov. Code, ~ Resubmittal of disappraved orwithdrawn ~ ptfier`{specify) 43134b.t ib)) emergency filing (Gov. Code, t i 3A6.i) ~~erg, Re~t~a~}~ ~~/~(1t. Code (e)) 4. ALL BEGINNING AND ENDING DATES OFAYAILiiBILlTY'OPMODIFIED REC,ULftTiOt+14 ANOJOR MATEflIAIADDEDTOTHE RUI.EMAKiNGFILE (dal. Cade Regs, tide 1, q4 ~rxi Gov. Code y77347.ty 3. EFFEGTIYF DATED CHANGES (Gov. Code, , t (d); Cal. Cede Regs., tille:1, 4100) Eifec6lve January 1, April 1, July 1, or o Effective on filing witfi ~ 1QOGtw~es Without EKective 06tot~f 1 (Gov. Code {ajj $ecretgryof State Regulatory Effect other (Speclty) 6: CHECK IF THESE REGULA i'tons REQt1iRE NOTtGPTO, OR REViE4Y, GONSULTATIpN, gpfroval QR CONCURRENCE BY, ANOTHER AGENCY OR ENTITY Department.ofFinante(FonnSTD.399}{SAM 6bb0) ~ FairPottticalPraaicssCommission ~ StateFireMarshal tltherj5peci(y) 7. CONTACT F'ER3bN TELEPHONE NUMBER FAX NUMBER {Optional} RpDRESS (Optional} David Rose ' david.rose@w~terboards.ca.gav $~ 1 certify that the attached copy of the regulationts) is a true amd correct copy f or use by Office of Administrative Law (DAL}only a# tite regulation(s~ identified aet this form, that the information specified on this form is true and correct, and that t am the head of the agency taking this action, ar a,designee o~f the head of the agen~r, and`am authorized to mate this certifica#ion. $IC,N AGENCY NEADORO - NEE DA3E ~: ~ ~ TYPE NAME Rt~D TITCE OF S~GNAFORY. Thomas (-toward, Executive Director, State Water Resources Cantroi Board
140
141 ADAPTED TEXT C)F EMERGENCY REGULATION Article Drought Emergency Water Conservation. Sec Findings of Drought Emergency. (a) The State Water Resources Control Board finds as follows: (1) On January 17, 2014, the Governor issued a proclamation of a state of emergency under the California Emergency Services Act based on drought conditions; {2) On Apri125, 20.14, the Governor issued a proclamation of a continued state of emergency under the California Emergency Services Act based on continued drought conditions; ~3) Oil A~riI 1, 2015, the Governor issued an Executive Order that, in part, directs the Siate Board to impose restrictions on water suppliers to achieve a statewide 25 percent reduction in potable urban usa eg through February, 2016; re4uire commercial, industrial, and institutional users to implement water efficiency measures; prohibit irrigation with potable water of ornamental turf in public street medians; and prohibit irrigation with potable water outside newer constnzcted homes and buildings that is not delivered b,y drib or microspra~s, std erns; (~4) The drought conditions that formed the basis of the Governor's emergency proclamations continue to exist; (45) The present year is critically dry and has been immediately preceded by two or more consecutive below normal, dry, or critically dry years; and (~6) The drought'conditions will likely continue for the foreseeable future and additional action by both the State Water Resources Control hoard and local water suppliers.will likely be necessary to prevent waste and unreasonable use of water and to further promote conservation. Authority: Section , Water Code. References: Article X Section 2 California Constitution' Sections 102,104,- 105, and 275. Water Code; Light v. State Water Resources Control Board (2014 `226 Ca1.A~n.4th Sec. $64. End-User Requirements in Promotion of Water Conservation. (a) To prevent the waste and unreasonable use of water and to promote water conservation, each of the following actions is prohibited, except where necessary to address an immediate health and safety need or to comply with a term or condition in a permit issued by a state or federal agency: (1) The application of potable water to outdoor landscapes in a manner that causes runoff such that evater flows onto adjacent property, non-irrigated areas, private and public walkways, roadways, parking lots, or strictures; (2} The use of a hose that dispenses potable water to wash a motor vehicle, except where the hose is fitted with ashut-off nozzle or device attached #o it that causes it to cease dispensing water immediately when not in use, (3) The application of potable water to driveways and sidewalks;
142 (4) The use of potable water in a fountain or other decorative water feature, except where the water is part of a recirculating system; (5) The application of potable water to outdoor landscapes during and within 48 hours after measurable rainfall;-ate (6) The serving of drinking water other than upon request in eating or drinking: establishments, including but not limited to restaurants, hotels, cafes, cafeterias, bars, or other public places where food or drink are served and/or purchased:i ~7) The irri~:ation with potable water of ornamental turf on public street medians and ~8 The irri~;ation with potable water of landscapes outside of newly constructed homes and buildings in a manner inconsistent with regulations or other requirements established by the California Building Standards Commission and the Department of Housing and Community Development. (b) To promote water conservation, operators of hotels and motels shall provide guests with the option of choosing not to have towels and linens laundered daily. The hotel or motel shall prominently display notice of this option in each guestroom using clear and easily understood language... (c~ Immediately upon this subdivision taking effect, all commercial, industrial and institutional properties that use a water supply, any portion of which is from a source other than a water supplier subject to section 865, shall either: (1) Limit outdoor irrigation of ornamental landscapes or turf with potable water to no more than two damper week; or ~2 Reduce potable water usage supplied by sources other than a water supplier amount used from those sources for the same months in (Ed) The taking of any action prohibited in subdivision (a) or the failure to take any action required in subdivisions (b) or c, e-~r~-p~~~~is an infraction; punishable by a fine of up to five hundred dollars ($500) for each day in which the violation occurs. The fine for the infraction is in addition to, and does not supersede orlimit, any other remedies, civil or criminal Authority: Section , Water Code. References: Article X Section 2 California Constitution Sections 102, 104,-ate 105, and Water Code; Light v. State Water Resources Control Board (2014) 22b Ca1.A~~.4th Sec Mandatory Actions by Water Suppliers. (a? As used in this section: ~1) "Distributor of a public water supply" has the same meaning as under section 350 of the Water Code, except it does not refer to such distributorswhen they are. functioning solely in a wholesale capacity, but does abniv to distributors when they are functioning in a retail ca~acit~ ~ ~, n-vr ~.,L uicau~ ic~iugii~iai ~auvu~ ~ci c;a~i~a,~ci ua~ (3 "Total potable water production" means all potable water that enters into a water supplier's distribution. system, excludin,~water placed into storage and not
143 withdrawn for use during ~e re~arting period or water exhorted outsider the supplier's service area. {-a~.(4~''=="ter" Urban water supplier;" ~,', ~~' +'~; ~*~ ^; ~~~ *^ means a.supplier that meets the definition set forth in Water Code section 10617,.except it does not refer to suppliers when they are functioning solely in a wholesale capacity, but. does apply to suppliers when they are functioning in a retail capacity. ~~~ {fib) In furtherance of the promotion of water conservation each urban water supplier shall: (1) Provide prompt notice to a customer whenever the supplierobtains information that indicates that a leak may exist within the end-user's exclusive control. (2) Prepare and subinit~ to the State Water Resources Control Board by thel5th of each month a monitoring report on forms provided by the Board. Themonitoring report; shall include the amount of potable water the urban water supplier produced, including water provided by a wholesaler, in the preceding calendar month and shall compare that amount to the amount produced in the same calendar month in The monitoring reportshall specify thepopulation served by the urban water supplier, the percentage of water produced that is used for the residential sector, descriptive statistics on water conservation compliance and enforcement.efforts, -the number of days that autdoar irrigation is allowed, and monthly commercial, industrial and institutional sector use. The monitoring report shall also estimate the gallons of water per person per day. used by the residential customers it serves.

144 ~c)(1, To prevent the waste and unreasonable use of water and to meet the requirements of the Governor's April Executive Order each urban water supplier shall reduce its total potable water production b~ the percentage identified as its conservation standard in this subdivision. Each urban water su~piier's conservation standard considers its service area's relative per cabita water usage. (21 Each urban water su~~lier whose source of supply does not include ~oundwater or water imported from outside the h dy rolo ig c region in which the water supplier is located, and that has a minimum of four vears" reserved` su~~lv'available may submit to the Executive Director for approval a request that, in lieu of the reduction that would otherwise be required under ~ara~raphs 3 through (101 the urban water supplier shall reduce its total potable water production by 4 percent for each month as compared to the amount used in the same month in Any such request shall be accompanied by information showing that the supplier's sources of sup~ly do not include groundwater or water imported from outside the h d~ ig c re~:ion and that the supplier has a minimum of four years' reserved su~iv available.,~31 Each urban water supplier whose average Jul~September 2014 R-GPCD was less than 65 sha11 reduce its total potable water production by 8 percent for each month as compared to the amount used in the same month in ~4) Each urban water sup~alier whose average, July-September 2014 R-GPCD was 65 or more but less than 80 shall reduce its total potable water production by 12,percent for each month as compared to the amount used in the same month in 2013: ~5) Each urban,water surlier whose average July-September 2014 R-GPCD was 80 or more but less than 95 shall reduce its total potable water production by 16 percent for each month as compared to the amount used in the same month' in (6).Each urban water surlier whose' average July-Se~ternber 2014 R-GPCD was 95 or more but less than 120 shall reduce its total potable water production by 2Q percent for each rnonth;as compared to the amount used in the same month in (7) Each urban water surlier whose average July-September 2014' R-GPCD was 110 or more but less than 130 shall reduce its total potable water production by 24 percent for each month as compared to the amount used in the same month in 2013.' ~8) Each urban water supplier whose avera~y-september 2014 R-GPCD was 130 or more but less than 170 shall reduce its total potable water production by 28 percent for each month as compared to the amount used in the same month in ~9) Each urban water surlier whose average, July-September 2014 R-GPCD was 170 or more but less than 215 shall reduce its total potable water production by 32 aercent for each month as compared to the amount used in the same month in X10) Each urban water surlier whose avera~e~y-september 2014 R-GPCD was 215 or more shall reduce its total.. potable water: production by 36 percent for each month as compared to the amount used in the same month in (d)(1~; Beginning June 1, 2015, each urban water su~lier'shall comply with the conservation standard specified in subdivision (c). (21 Compliance with. the ret~uirements of this subdivision shall be measured monthly and assessed on a cumulative. basis. ~e)(11 Each urban water surlier that provides potable water for commercial agricultural use meeting the definition of Government Code section 51201, subdivision fib), rnav subtract the amount of water provided for commercial agricultural. use from its
, for commercial agricultural users meetin~the`definition of Goveriunent Code")
145 shall: ~A) Impose reductions determined locallti a~pro~riate by the urban.water su~~lier, after considering the a~~licable urban water supplier conservation standard ~pecifi~cl in subdivision {c), for commercial agricultural users meetin~the`definition of Goveriunent Code sectioli subdivision (bl servedk~v~thesunnlier~ seetion~the total amount of water supplied for commercial. agricultural use, and.:shall identifythe reduction. izn~osed on its commercial agricultural users and each~recipient of potable water far commercial agricultural use; ~C~ Certify that the agricultural uses it serves meet the definition of Government Code section S 1201, subdivision (b~; and ~D) Comply with the Agricultural Water Management Plan requirement of ~2) Submitting~anv information pursuant to subdivision,~~~1~b1 or ~C~ of this ectian that is found to be materially false by the board is a violation of this re ation, violation occurs. Every da~~ that the error goes uncorrected constitutes a separate limit, any other remedies. civil or criminal. (ef~~to prevent waste and unreasonable use of water and to promote water conservation, each. distributor of a public water supply, ~~ ~~~;-~~a ;~ «'~+~~ r^a~ ^o^+;~r ~8; that is not an urban water supplier shall,,take one or more of the following actions: (~A) Limit outdoor.irrigation of ornamental landscapes ar turf with potable water by thepersons it serves to no.more than two daysper week; or ~B Reduce by 25 percent its total potable water production relative to the amount produced in ~.~.,.,+,.,,.,~,,.,,oa ;., ~n~ ~ ~2) Each distributor of a ~aublic water sup~ly that is not an urban water supplier shall submit a report by.december 15,2015, on a form provided by the Board, that either confirms com,~liance with subdivision (f~(1),~a~or identifies total potable water production, by month, from June through November, 2Q15, and total potable water production, by month, for June through November Authority: Section , Water Code. References: Article X Section 2 California Constitution Sections 102, 104, 105, 275, 350, 1846,10617 and 10632, Water Code; Light v. State Water Resources Control Board (2Q14~ 226 Cal.App.4th 1463.
146 Sec. $66. Additional Conservation Taols. ~a~(1 Ta prevent the waste and'unreasonable use of water and to promote conservation, when a water supplier does not meet its conservation standard required by section 865 the Executive Director, ar the Executive Director's desi~ee, may issue conservation orders requiring: additional actions b t~p~lier to come into compliance with its conservation standard: ~2) A decision or order issued under this article by the board or an officer or employee of the board is subject to reconsideration under article 2 fcornmencin~, with section 1122, of chapter 4 of part 1 of division 2 of the Water Code. (b) The Executive Director, or his designee, may issue an informational order requiring water suppliers, or commercial, industrial or institutional properties that receive andportion of their su~~ly from a source other than a water surlier subject to section 865, to submit additional information relating to water production, water use or water conservation. The failure to provide the information requested within 30 days or any additional time extension granted is a violation subject to civil liability of u,~ to $500 der day for each day the violation continues pursuant to Water Code section Authority: Section , Water Code. References: Article X Section 2 California Constitution Sections $ $ and Water Code Light v. State Water Resources Control Board ( Cal.App.4th 1463.
147 March 2016 SWRCB Emergency Regulation
148
149 ADOPTED TEXT OF EMERGENCY REGULATION Article Drought Emergency Water Conservation. Sec Findings of Drought Emergency. (a) The State Water Resources Control Board finds as follows: (1) On January 17, 2014, the Governor issued a proclamation of a state of emergency under the California Emergency Services Act based on drought conditions; (2) On April 25, 2014, the Governor issued a proclamation of a continued state of emergency under the California Emergency Services Act based on continued drought conditions; (3) On April 1, 2015, the Governor issued an Executive Order that, in part, directs the State Board to impose restrictions on water suppliers to achieve a statewide 25 percent reduction in potable urban usage through February, 2016; require commercial, industrial, and institutional users to implement water efficiency measures; prohibit irrigation with potable water of ornamental turf in public street medians; and prohibit irrigation with potable water outside newly constructed homes and buildings that is not delivered by drip or microspray systems; (4) On November 13, 2015, the Governor issued an Executive Order that directs the State Board to, if drought conditions persist through January 2016, extend until October 31, 2016 restrictions to achieve a statewide reduction in potable usage; (5) The drought conditions that formed the basis of the Governor s emergency proclamations continue to exist; and (6) The drought conditions will likely continue for the foreseeable future and additional action by both the State Water Resources Control Board and local water suppliers will likely be necessary to prevent waste and unreasonable use of water and to further promote conservation. Authority: Section , Water Code. References: Article X, Section 2, California Constitution; Sections 102, 104, 105, and 275, Water Code; Light v. State Water Resources Control Board (2014) 226 Cal.App.4th Sec End-User Requirements in Promotion of Water Conservation. (a) To prevent the waste and unreasonable use of water and to promote water conservation, each of the following actions is prohibited, except where necessary to address an immediate health and safety need or to comply with a term or condition in a permit issued by a state or federal agency: (1) The application of potable water to outdoor landscapes in a manner that causes runoff such that water flows onto adjacent property, non-irrigated areas, private and public walkways, roadways, parking lots, or structures; (2) The use of a hose that dispenses potable water to wash a motor vehicle, except where the hose is fitted with a shut-off nozzle or device attached to it that causes it to cease dispensing water immediately when not in use; (3) The application of potable water to driveways and sidewalks;
150 (4) The use of potable water in a fountain or other decorative water feature, except where the water is part of a recirculating system; (5) The application of potable water to outdoor landscapes during and within 48 hours after measurable rainfall; (6) The serving of drinking water other than upon request in eating or drinking establishments, including but not limited to restaurants, hotels, cafes, cafeterias, bars, or other public places where food or drink are served and/or purchased; (7) The irrigation with potable water of ornamental turf on public street medians; and (8) The irrigation with potable water of landscapes outside of newly constructed homes and buildings in a manner inconsistent with regulations or other requirements established by the California Building Standards Commission and the Department of Housing and Community Development. (b) To promote water conservation, operators of hotels and motels shall provide guests with the option of choosing not to have towels and linens laundered daily. The hotel or motel shall prominently display notice of this option in each guestroom using clear and easily understood language. (c) Immediately upon this subdivision taking effect, all commercial, industrial and institutional properties that use a water supply, any portion of which is from a source other than a water supplier subject to section 865, shall either: (1) Limit outdoor irrigation of ornamental landscapes or turf with potable water to no more than two days per week; or (2) Reduce potable water usage supplied by sources other than a water supplier by 25 percent for the months of June 2015 through October 2016 as compared to the amount used from those sources for the same months in (d) The taking of any action prohibited in subdivision (a) or (e), or the failure to take any action required in subdivision (b) or (c), is an infraction punishable by a fine of up to five hundred dollars ($500) for each day in which the violation occurs. The fine for the infraction is in addition to, and does not supersede or limit, any other remedies, civil or criminal. (e)(1) To prevent the waste and unreasonable use of water and to promote water conservation, any homeowners association or community service organization or similar entity is prohibited from: (A) Taking or threatening to take any action to enforce any provision of the governing documents or architectural or landscaping guidelines or policies of a common interest development where that provision is void or unenforceable under section 4735, subdivision (a) of the Civil Code; or (B) Imposing or threatening to impose a fine, assessment, or other monetary penalty against any owner of a separate interest for reducing or eliminating the watering of vegetation or lawns during a declared drought emergency, as described in section 4735, subdivision (c) of the Civil Code. (2) As used in this subdivision: (A) Architectural or landscaping guidelines or policies includes any formal or informal rules other than the governing documents of a common interest development. (B) Homeowners association means an association as defined in section 4080 of the Civil Code.
151 (C) Common interest development has the same meaning as in section 4100 of the Civil Code. (D) Community service organization or similar entity has the same meaning as in section 4110 of the Civil Code. (E) Governing documents has the same meaning as in section 4150 of the Civil Code. (F) Separate interest has the same meaning as in section 4185 of the Civil Code. (3) If a disciplinary proceeding or other proceeding to enforce a rule in violation of subdivision (e)(1) is initiated, each day the proceeding remains pending shall constitute a separate violation of this regulation. Authority: Section , Water Code. References: Article X, Section 2, California Constitution; Sections 4080, 4100, 4110, 4150, 4185, and 4735, Civil Code; Sections 102, 104, 105, 275, 350, and 10617, Water Code; Light v. State Water Resources Control Board (2014) 226 Cal.App.4th Sec Mandatory Actions by Water Suppliers. (a) As used in this section: (1) Distributor of a public water supply has the same meaning as under section 350 of the Water Code, except it does not refer to such distributors when they are functioning solely in a wholesale capacity, but does apply to distributors when they are functioning in a retail capacity. (2) R-GPCD means residential gallons per capita per day. (3) Total potable water production means all potable water that enters into a water supplier s distribution system, excluding water placed into storage and not withdrawn for use during the reporting period, or water exported outsider the supplier s service area. (4) Urban water supplier means a supplier that meets the definition set forth in Water Code section 10617, except it does not refer to suppliers when they are functioning solely in a wholesale capacity, but does apply to suppliers when they are functioning in a retail capacity. (b) In furtherance of the promotion of water conservation each urban water supplier shall: (1) Provide prompt notice to a customer whenever the supplier obtains information that indicates that a leak may exist within the end-user s exclusive control. (2) Prepare and submit to the State Water Resources Control Board by the 15th of each month a monitoring report on forms provided by the Board. The monitoring report shall include the amount of potable water the urban water supplier produced, including water provided by a wholesaler, in the preceding calendar month and shall compare that amount to the amount produced in the same calendar month in The monitoring report shall specify the population served by the urban water supplier, the percentage of water produced that is used for the residential sector, descriptive statistics on water conservation compliance and enforcement efforts, the number of days that outdoor irrigation is allowed, and monthly commercial, industrial and institutional sector use. The
152 monitoring report shall also estimate the gallons of water per person per day used by the residential customers it serves. (c)(1) To prevent the waste and unreasonable use of water and to meet the requirements of the Governor s November 13, 2015 Executive Order, each urban water supplier shall reduce its total potable water production by the percentage identified as its conservation standard in this subdivision. Each urban water supplier s conservation standard considers its service area s relative per capita water usage. (2) Each urban water supplier whose source of supply does not include groundwater or water imported from outside the hydrologic region in which the water supplier is located, and that has a minimum of four years reserved supply available, may submit to the Executive Director for approval a request that, in lieu of the reduction that would otherwise be required under paragraphs (3) through (10), the urban water supplier shall reduce its total potable water production by 4 percent for each month as compared to the amount used in the same month in Any such request shall be accompanied by information showing that the supplier s sources of supply do not include groundwater or water imported from outside the hydrologic region and that the supplier has a minimum of four years reserved supply available. (3) Each urban water supplier whose average July-September 2014 R-GPCD was less than 65 shall reduce its total potable water production by 8 percent for each month as compared to the amount used in the same month in (4) Each urban water supplier whose average July-September 2014 R-GPCD was 65 or more but less than 80 shall reduce its total potable water production by 12 percent for each month as compared to the amount used in the same month in (5) Each urban water supplier whose average July-September 2014 R-GPCD was 80 or more but less than 95 shall reduce its total potable water production by 16 percent for each month as compared to the amount used in the same month in (6) Each urban water supplier whose average July-September 2014 R-GPCD was 95 or more but less than 110 shall reduce its total potable water production by 20 percent for each month as compared to the amount used in the same month in (7) Each urban water supplier whose average July-September 2014 R-GPCD was 110 or more but less than 130 shall reduce its total potable water production by 24 percent for each month as compared to the amount used in the same month in (8) Each urban water supplier whose average July-September 2014 R-GPCD was 130 or more but less than 170 shall reduce its total potable water production by 28 percent for each month as compared to the amount used in the same month in (9) Each urban water supplier whose average July-September 2014 R-GPCD was 170 or more but less than 215 shall reduce its total potable water production by 32 percent for each month as compared to the amount used in the same month in (10) Each urban water supplier whose average July-September 2014 R-GPCD was 215 or more shall reduce its total potable water production by 36 percent for each month as compared to the amount used in the same month in (d)(1) Beginning June 1, 2015, each urban water supplier shall comply with the conservation standard specified in subdivision (c), with any modifications to the conservation standard pursuant to subdivision (f) applying beginning March 1. (2) Compliance with the requirements of this subdivision shall be measured monthly and assessed on a cumulative basis through October 2016.
153 (e)(1) Each urban water supplier that provides potable water for commercial agricultural use meeting the definition of Government Code section 51201, subdivision (b), may subtract the amount of water provided for commercial agricultural use from its potable water production total, provided that any urban water supplier that subtracts any water provided for commercial agricultural use from its total potable water production shall: (A) Impose reductions determined locally appropriate by the urban water supplier, after considering the applicable urban water supplier conservation standard specified in subdivision (c), for commercial agricultural users meeting the definition of Government Code section 51201, subdivision (b) served by the supplier; (B) Report its total potable water production pursuant to subdivision (b)(2) of this section, the total amount of water supplied for commercial agricultural use, and shall identify the reduction imposed on its commercial agricultural users and each recipient of potable water for commercial agricultural use; (C) Certify that the agricultural uses it serves meet the definition of Government Code section 51201, subdivision (b); and (D) Comply with the Agricultural Water Management Plan requirement of paragraph 12 of the April 1, 2015 Executive Order for all commercial agricultural water served by the supplier that is subtracted from its total potable water production. (2) Submitting any information pursuant to subdivision (e)(1)(b) or (C) of this section that is found to be materially false by the Board is a violation of this regulation, punishable by civil liability of up to five hundred dollars ($500) for each day in which the violation occurs. Every day that the error goes uncorrected constitutes a separate violation. Civil liability for the violation is in addition to, and does not supersede or limit, any other remedies, civil or criminal. (f) In consideration of the differences in climate affecting different parts of the state, growth experienced by urban areas and significant investments that have been made by some suppliers towards creating new, local, drought-resilient sources of potable water supply, an urban water supplier s conservation standard identified in subdivision (c) shall be reduced by an amount, not to exceed eight (8) percentage points total, as follows: (1) For an urban water supplier whose service area evapotranspiration (ETo) for the months of July through September exceeds the statewide average evapotranspiration, as determined by the Board, for the same months by five (5) percent or more, the supplier s conservation standard identified in subdivision (c) shall be reduced: (A) By two (2) percentage points if the supplier s service area evapotranspiration exceeds the statewide average by five (5) percent or more but less than ten (10) percent; (B) By three (3) percentage points if the supplier s service area evapotranspiration exceeds the statewide average by ten (10) percent or more but less than twenty (20) percent; (C) By four (4) percentage points if the supplier s service area evapotranspiration exceeds the statewide average by twenty (20) percent or more. (D) Statewide average evapotranspiration is calculated as the arithmetic mean of all urban water suppliers service area default evapotranspiration values for the months of July through September. Default service area evapotranspiration will be based on the California Irrigation Management System (CIMIS) ETo Zones Map zone for which the supplier s service area has the greatest area of overlap. In lieu of applying its default
154 service area evapotranspiration, a supplier may use specific data from CIMIS stations within its service area that have at least a five-year period of record, or a three year continuous period of record, to identify a more specifically-applicable evapotranspiration for its service area. If no CIMIS station exists within the supplier s service area, a weather station of comparable accuracy, meeting the preceding period of record requirements, may be used. To qualify for the in-lieu climate adjustment, the supplier shall submit the following data to the Board by March 15, 2016 for each station: station ID; station location; and monthly average evapotranspiration, in inches per month, for July, August, and September for either the five-year period of record or the three-year continuous period of record. (2) To account for water efficient growth experienced in the state since 2013, urban water suppliers conservation standards shall be reduced by the product of the percentage change in potable water production since 2013 and the percentage reduction in potable water use required pursuant to subdivision (c), rounded to the nearest whole percentage point. Change in potable water production since 2013 shall be calculated as the sum of the following: (A) The number of additional permanent residents served since January 1, 2013, multiplied by the average residential water use per person for that supplier s service area during the months of February through October, 2015, in gallons; and (B) The number of new commercial, industrial and institutional connections since January 1, 2013, multiplied by the average commercial, industrial and institutional water use per connection for that supplier s service area during the months of February through October, 2015, in gallons. (C) To qualify for the growth credit the supplier shall submit to the Board the following data by March 15, 2016: the number of additional permanent residents served since January 1, 2013 and the number of new commercial, industrial and institutional connections since January 1, (3) For an urban water supplier that supplies, contracts for, or otherwise financially invests in, water from a new local, drought-resilient source of supply, the use of which does not reduce the water available to another legal user of water or the environment, the conservation standard identified in subdivision (c) shall be reduced: (A) By one (1) percentage point if the supplier s qualifying source of supply is one (1) percent or more but less than two (2) percent of the supplier s total potable water production; (B) By two (2) percentage points if the supplier s qualifying source of supply is two (2) percent or more but less than three (3) percent of the supplier s total potable water production; (C) By three (3) percentage points if the supplier s qualifying source of supply is three (3) percent or more but less than four (4) percent of the supplier s total potable water production; (D) By four (4) percentage points if the supplier s qualifying source of supply is four (4) percent or more but less than five (5) percent of the supplier s total potable water production; (E) By five (5) percentage points if the supplier s qualifying source of supply is five (5) percent or more but less than six (6) percent of the supplier s total potable water production;
155 (F) By six (6) percentage points if the supplier s qualifying source of supply is six (6) percent or more but less than seven (7) percent of the supplier s total potable water production; (G) By seven (7) percentage points if the supplier s qualifying source of supply is seven (7) percent or more but less than eight (8) percent of the supplier s total potable water production; (H) By eight (8) percentage points if the supplier s qualifying source of supply is eight (8) percent or more of the supplier s total potable water production. (I) To qualify for this reduction the supplier must certify, and provide documentation to the Board upon request demonstrating, the percent of its total potable water production that comes from a local, drought-resilient source of supply developed after 2013, the supplier s investment in that local, drought-resilient source of supply, and that the use of that supply does not reduce the water available to another legal user of water or the environment. To qualify for this reduction an urban water supplier shall submit the required certification to the Board by March 15, (J) Certifications that do not meet the requirements of subdivision (f)(3)(i), including certifications for which documentation does not support that the source of supply is a local, drought-resilient source of supply, the use of which does not reduce the water available to another legal user of water or the environment, will be rejected. Submitting a certification or supporting documentation pursuant to subdivision (f)(3)(i) that is found to be materially false by the Board is a violation of this regulation, punishable by civil liability of up to five hundred dollars ($500) for each day in which the violation occurs. Every day that the error goes uncorrected constitutes a separate violation. Civil liability for the violation is in addition to, and does not supersede or limit, any other remedies, civil or criminal. (4) No urban water supplier s conservation standard shall drop below eight (8) percent as a consequence of the reductions identified in this subdivision. No reduction pursuant to this subdivision shall be applied to any urban water supplier whose conservation standard is four (4) percent based on subdivision (c)(2). (g)(1) To prevent waste and unreasonable use of water and to promote water conservation, each distributor of a public water supply that is not an urban water supplier shall take one or more of the following actions: (A) Limit outdoor irrigation of ornamental landscapes or turf with potable water by the persons it serves to no more than two days per week; or (B) Reduce by 25 percent its total potable water production relative to the amount produced in (2) Each distributor of a public water supply that is not an urban water supplier shall submit a report by September 15, 2016, on a form provided by the Board, that either confirms compliance with subdivision (g)(1)(a) or identifies total potable water production, by month, from December, 2015 through August, 2016, and total potable water production, by month, for the same months in Authority: Section , Water Code. References: Article X, Section 2, California Constitution; Sections 102, 104, 105, 275, 350, 1846, and 10632, Water Code; Light v. State Water Resources Control Board (2014) 226 Cal.App.4th 1463.
156 Sec Additional Conservation Tools. (a)(1) To prevent the waste and unreasonable use of water and to promote conservation, when a water supplier does not meet its conservation standard required by section 865 the Executive Director, or the Executive Director s designee, may issue conservation orders requiring additional actions by the supplier to come into compliance with its conservation standard. (2) A decision or order issued under this article by the Board or an officer or employee of the Board is subject to reconsideration under article 2 (commencing with section 1122) of chapter 4 of part 1 of division 2 of the Water Code. (b) The Executive Director, or his designee, may issue an informational order requiring water suppliers, or commercial, industrial or institutional properties that receive any portion of their supply from a source other than a water supplier subject to section 865, to submit additional information relating to water production, water use or water conservation. The failure to provide the information requested within 30 days or any additional time extension granted is a violation subject to civil liability of up to $500 per day for each day the violation continues pursuant to Water Code section (c) Orders issued under previous versions of this subdivision shall remain in effect and shall be enforceable as if adopted under this version. Authority: Section , Water Code. References: Article X, Section 2, California Constitution; Sections 100, 102, 104, 105, 174, 186, 187, 275, 350, 1051, 1122, 1123, 1825, 1846, and 10632, Water Code; Light v. State Water Resources Control Board (2014) 226 Cal.App.4th 1463.
157 May 2016 SWRCB Emergency Regulation
158
159 ADOPTED TEXT OF EMERGENCY REGULATION Article Drought Emergency Water Conservation. Sec Findings of Drought Emergency. (a) The State Water Resources Control Board finds as follows: (1) On January 17, 2014, the Governor issued a proclamation of a state of emergency under the California Emergency Services Act based on drought conditions; (2) On April 25, 2014, the Governor issued a proclamation of a continued state of emergency under the California Emergency Services Act based on continued drought conditions; (3) On April 1, 2015, the Governor issued an Executive Order that, in part, directs the State Board to impose restrictions on water suppliers to achieve a statewide 25 percent reduction in potable urban usage through February, 2016; require commercial, industrial, and institutional users to implement water efficiency measures; prohibit irrigation with potable water of ornamental turf in public street medians; and prohibit irrigation with potable water outside newly constructed homes and buildings that is not delivered by drip or microspray systems; (4) On November 13, 2015, the Governor issued an Executive Order that directs the State Board to, if drought conditions persist through January 2016, extend until October 31, 2016 restrictions to achieve a statewide reduction in potable usage; (5) On May 9, 2016, the Governor issued an Executive Order that directs the State Board to adjust and extend its emergency water conservation regulations through the end of January 2017 in recognition of the differing water supply conditions for many communities; (56) The drought conditions that formed the basis of the Governor s emergency proclamations continue to exist; and (67) The drought conditions will likely continue for the foreseeable future and additional action by both the State Water Resources Control Board and local water suppliers will likely be necessary to prevent waste and unreasonable use of water and to further promote conservation. Authority: Section , Water Code. References: Article X, Section 2, California Constitution; Sections 102, 104, 105, and 275, Water Code; Light v. State Water Resources Control Board (2014) 226 Cal.App.4th Sec End-User Requirements in Promotion of Water Conservation. (a) To prevent the waste and unreasonable use of water and to promote water conservation, each of the following actions is prohibited, except where necessary to address an immediate health and safety need or to comply with a term or condition in a permit issued by a state or federal agency: 1
160 (1) The application of potable water to outdoor landscapes in a manner that causes runoff such that water flows onto adjacent property, non-irrigated areas, private and public walkways, roadways, parking lots, or structures; (2) The use of a hose that dispenses potable water to wash a motor vehicle, except where the hose is fitted with a shut-off nozzle or device attached to it that causes it to cease dispensing water immediately when not in use; (3) The application of potable water to driveways and sidewalks; (4) The use of potable water in a fountain or other decorative water feature, except where the water is part of a recirculating system; (5) The application of potable water to outdoor landscapes during and within 48 hours after measurable rainfall; (6) The serving of drinking water other than upon request in eating or drinking establishments, including but not limited to restaurants, hotels, cafes, cafeterias, bars, or other public places where food or drink are served and/or purchased; (7) The irrigation with potable water of ornamental turf on public street medians; and (8) The irrigation with potable water of landscapes outside of newly constructed homes and buildings in a manner inconsistent with regulations or other requirements established by the California Building Standards Commission and the Department of Housing and Community Development. (b) To promote water conservation, operators of hotels and motels shall provide guests with the option of choosing not to have towels and linens laundered daily. The hotel or motel shall prominently display notice of this option in each guestroom using clear and easily understood language. (c) Immediately uponupon this subdivision taking effect, all commercial, industrial and institutional properties that use a water supply, any portion of which is from a source other than a water supplier subject to section or 865 of this article, shall either: (1) Limit outdoor irrigation of ornamental landscapes or turf with potable water to no more than two days per week; or (2) Target potable water use reductions commensurate with those required of the nearest urban water supplier under section or, if applicable, section 865. Where this option is chosen, these properties shall implement the reductions on or before July 1, (2) Reduce potable water usage supplied by sources other than a water supplier by 25 percent for the months of June 2015 through October 2016 as compared to the amount used from those sources for the same months in (d) The taking of any action prohibited in subdivision (a) or (e), or the failure to take any action required in subdivision (b) or (c), is an infraction punishable by a fine of up to five hundred dollars ($500) for each day in which the violation occurs. The fine for the infraction is in addition to, and does not supersede or limit, any other remedies, civil or criminal. (e)(1) To prevent the waste and unreasonable use of water and to promote water conservation, any homeowners association or community service organization or similar entity is prohibited from: 2
161 (A) Taking or threatening to take any action to enforce any provision of the governing documents or architectural or landscaping guidelines or policies of a common interest development where that provision is void or unenforceable under section 4735, subdivision (a) of the Civil Code; or (B) Imposing or threatening to impose a fine, assessment, or other monetary penalty against any owner of a separate interest for reducing or eliminating the watering of vegetation or lawns during a declared drought emergency, as described in section 4735, subdivision (c) of the Civil Code. (2) As used in this subdivision: (A) Architectural or landscaping guidelines or policies includes any formal or informal rules other than the governing documents of a common interest development. (B) Homeowners association means an association as defined in section 4080 of the Civil Code. (C) Common interest development has the same meaning as in section 4100 of the Civil Code. (D) Community service organization or similar entity has the same meaning as in section 4110 of the Civil Code. (E) Governing documents has the same meaning as in section 4150 of the Civil Code. (F) Separate interest has the same meaning as in section 4185 of the Civil Code. (3) If a disciplinary proceeding or other proceeding to enforce a rule in violation of subdivision (e)(1) is initiated, each day the proceeding remains pending shall constitute a separate violation of this regulation. Authority: Section , Water Code. References: Article X, Section 2, California Constitution; Sections 4080, 4100, 4110, 4150, 4185, and 4735, Civil Code; Sections 102, 104, 105, 275, 350, and 10617, Water Code; Light v. State Water Resources Control Board (2014) 226 Cal.App.4th Sec Self-Certification of Supply Reliability for Three Additional Years of Drought. (a) To prevent the waste and unreasonable use of water and to meet the requirements of the Governor s May 9, 2016 Executive Order, each urban water supplier shall: (1) Identify and report no later than June 22, 2016, on a form provided by the Board, the conservation standard that the supplier will be required to meet under this section; (2) Identify and report no later than June 22, 2016, on a form provided by the Board, the data and underlying analysis relied upon by the supplier to determine the conservation standard reported pursuant to this subdivision including, but not limited to identification of each source of supply the supplier intends to rely on and the quantity of water available under that source of supply given the assumptions of this section; (3) Certify, no later than June 22, 2016, that the conservation standard reported pursuant to this subdivision is based on the information and assumptions identified in this section; 3
162 (4) Post, within two weeks of submittal to the board, the data and underlying analysis relied upon by the supplier to determine the conservation standard reported pursuant to this subdivision to a publicly-accessible webpage; and (5) Beginning June 1, 2016, reduce its total potable water production by the percentage identified as its conservation standard in this section each month, compared to the amount used in the same month in (b) Each urban water supplier s conservation standard pursuant to this section shall be the percentage by which the supplier s total potable water supply is insufficient to meet the total potable water demand in the third year after this section takes effect under the following assumptions: (1) The next three years precipitation is the same as it was in water years ; (2) No temporary change orders that increase the availability of water to any urban water supplier are issued in the next three years; (3) The supplier s total potable water demand for each of the next three years will be the supplier s average annual total potable water production for the years 2013 and 2014; (4) The supplier s total potable water supply shall include only water sources of supply available to the supplier that could be used for potable drinking water purposes; (5) Each urban water supplier s conservation standard shall be calculated as a percentage and rounded to the nearest whole percentage point. (c) The Board will reject conservation standards that do not meet the requirements of this section. (d) Beginning June 1, 2016, each urban water supplier shall comply with the conservation standard it identifies and reports pursuant to this section. (e) Compliance with the conservation standard reported pursuant to this section shall be measured monthly and assessed on a cumulative basis through January (f) If a wholesaler and all of its urban water supplier customers agree, in a legallybinding document, those suppliers and wholesaler may submit to the board, in lieu of the individualized self-certified conservation standard applicable pursuant to section or section 865, an aggregated conservation standard, with all supporting documentation required for individualized self-certified conservation standards by section (g) Each urban water wholesaler shall calculate, to the best of its ability, and no later than June 8, 2016, the volume of water that it expects it would deliver to each urban water supplier in each of the next three years under the assumptions identified in subdivision (b), and post that calculation, and the underlying analysis, to a publiclyaccessible webpage. (h) Submitting any information pursuant to this section that the person who submits the information knows or should have known is materially false is a violation of this regulation, punishable by civil liability of up to five hundred dollars ($500) for each day in which the violation occurs. Every day that the error goes uncorrected constitutes a separate violation. Civil liability for the violation is in addition to, and does not supersede or limit, any other remedies, civil or criminal. (i) Any urban water supplier that does not comply with this section shall comply with the applicable conservation standard identified in section
163 Authority: Section , Water Code. References: Article X, Section 2, California Constitution; Sections 102, 104, 105, 275, 350, 1846, and 10632, Water Code; Light v. State Water Resources Control Board (2014) 226 Cal.App.4th Sec Mandatory Actions by Water Suppliers. (a) As used in this sectionarticle: (1) Distributor of a public water supply has the same meaning as under section 350 of the Water Code, except it does not refer to such distributors when they are functioning solely in a wholesale capacity, but does apply to distributors when they are functioning in a retail capacity. (2) R-GPCD means residential gallons per capita per day. (3) Total potable water production means all potable water that enters into a water supplier s distribution system, excluding water placed into storage and not withdrawn for use during the reporting period, or water exported outsider the supplier s service area. (4) Urban water supplier means a supplier that meets the definition set forth in Water Code section 10617, except it does not refer to suppliers when they are functioning solely in a wholesale capacity, but does apply to suppliers when they are functioning in a retail capacity. (5) Urban water wholesaler means a wholesaler of water to more than one urban water supplier. (6) Water year means the period from October 1 through the following September 30. Where a water year is designated by year number, the designation is by the calendar year number in which the water year ends. (b) In furtherance of the promotion of water conservation each urban water supplier shall: (1) Provide prompt notice to a customer whenever the supplier obtains information that indicates that a leak may exist within the end-user s exclusive control. (2) Prepare and submit to the State Water Resources Control Board by the 15th of each month a monitoring report on forms provided by the Board. The monitoring report shall include the amount of potable water the urban water supplier produced, including water provided by a wholesaler, in the preceding calendar month and shall compare that amount to the amount produced in the same calendar month in The monitoring report shall specify the population served by the urban water supplier, the percentage of water produced that is used for the residential sector, descriptive statistics on water conservation compliance and enforcement efforts, the number of days that outdoor irrigation is allowed, and monthly commercial, industrial and institutional sector use. The monitoring report shall also estimate the gallons of water per person per day used by the residential customers it serves. (c)(1) To prevent the waste and unreasonable use of water and to meet the requirements of the Governor s November 13, 2015May 9, 2016 Executive Order, each urban water supplier that fails to identify a conservation standard as required under section 864.5, or that has a conservation standard rejected by the Board under section 5
164 864.5, shall reduce its total potable water production by the percentage identified as its conservation standard in this subdivisionsection. Each urban water supplier s conservation standard considers its service area s relative per capita water usage. (2) Each urban water supplier whose source of supply does not include groundwater or water imported from outside the hydrologic region in which the water supplier is located, and that has a minimum of four years reserved supply available, may submit to the Executive Director for approval a request that, in lieu of the reduction that would otherwise be required under paragraphs (3) through (10), the urban water supplier shall reduce its total potable water production by 4 percent for each month as compared to the amount used in the same month in Any such request shall be accompanied by information showing that the supplier s sources of supply do not include groundwater or water imported from outside the hydrologic region and that the supplier has a minimum of four years reserved supply available. (32) Each urban water supplier whose average July-September 2014 R-GPCD was less than 65 shall reduce its total potable water production by 8 percent for each month as compared to the amount used in the same month in (43) Each urban water supplier whose average July-September 2014 R-GPCD was 65 or more but less than 80 shall reduce its total potable water production by 12 percent for each month as compared to the amount used in the same month in (54) Each urban water supplier whose average July-September 2014 R-GPCD was 80 or more but less than 95 shall reduce its total potable water production by 16 percent for each month as compared to the amount used in the same month in (65) Each urban water supplier whose average July-September 2014 R-GPCD was 95 or more but less than 110 shall reduce its total potable water production by 20 percent for each month as compared to the amount used in the same month in (76) Each urban water supplier whose average July-September 2014 R-GPCD was 110 or more but less than 130 shall reduce its total potable water production by 24 percent for each month as compared to the amount used in the same month in (87) Each urban water supplier whose average July-September 2014 R-GPCD was 130 or more but less than 170 shall reduce its total potable water production by 28 percent for each month as compared to the amount used in the same month in (98) Each urban water supplier whose average July-September 2014 R-GPCD was 170 or more but less than 215 shall reduce its total potable water production by 32 percent for each month as compared to the amount used in the same month in (109) Each urban water supplier whose average July-September 2014 R-GPCD was 215 or more shall reduce its total potable water production by 36 percent for each month as compared to the amount used in the same month in (d)(1) Beginning June 1, 2015, each urban water supplier that does not submit a self-certification in compliance with section shall comply with the conservation standard specified in subdivision (c), with any modifications to the conservation standard pursuant to subdivision (f) applying beginning March 1, (2) Compliance with the requirements of this subdivision shall be measured monthly and assessed on a cumulative basis through October 2016January (e)(1) Each urban water supplier that provides potable water for commercial agricultural use meeting the definition of Government Code section 51201, subdivision (b), may subtract the amount of water provided for commercial agricultural use from its 6
165 potable water production total, provided that any urban water supplier that subtracts any water provided for commercial agricultural use from its total potable water production shall: (A) Impose reductions determined locally appropriate by the urban water supplier, after considering the applicable urban water supplier conservation standard specified in subdivision (c), for commercial agricultural users meeting the definition of Government Code section 51201, subdivision (b) served by the supplier; (B) Report its total potable water production pursuant to subdivision (b)(2) of this section, the total amount of water supplied for commercial agricultural use, and shall identify the reduction imposed on its commercial agricultural users and each recipient of potable water for commercial agricultural use; (C) Certify that the agricultural uses it serves meet the definition of Government Code section 51201, subdivision (b); and (D) Comply with the Agricultural Water Management Plan requirement of paragraph 12 of the April 1, 2015 Executive Order for all commercial agricultural water served by the supplier that is subtracted from its total potable water production. (2) Submitting any information pursuant to subdivision (e)(1)(b) or (C) of this section that is found to be materially false by the Board is a violation of this regulation, punishable by civil liability of up to five hundred dollars ($500) for each day in which the violation occurs. Every day that the error goes uncorrected constitutes a separate violation. Civil liability for the violation is in addition to, and does not supersede or limit, any other remedies, civil or criminal. (f) In consideration of the differences in climate affecting different parts of the state, growth experienced by urban areas and significant investments that have been made by some suppliers towards creating new, local, drought-resilient sources of potable water supply, an urban water supplier s conservation standard identified in subdivision (c) shall be reduced by an amount, not to exceed eight (8) percentage points total, as follows: (1) For an urban water supplier whose service area evapotranspiration (ETo) for the months of July through September exceeds the statewide average evapotranspiration, as determined by the Board, for the same months by five (5) percent or more, the supplier s conservation standard identified in subdivision (c) shall be reduced: (A) By two (2) percentage points if the supplier s service area evapotranspiration exceeds the statewide average by five (5) percent or more but less than ten (10) percent; (B) By three (3) percentage points if the supplier s service area evapotranspiration exceeds the statewide average by ten (10) percent or more but less than twenty (20) percent; (C) By four (4) percentage points if the supplier s service area evapotranspiration exceeds the statewide average by twenty (20) percent or more. (D) Statewide average evapotranspiration is calculated as the arithmetic mean of all urban water suppliers service area default evapotranspiration values for the months of July through September. Default service area evapotranspiration will be based on the California Irrigation Management System (CIMIS) ETo Zones Map zone for which the supplier s service area has the greatest area of overlap. In lieu of applying its default service area evapotranspiration, a supplier may use specific data from CIMIS stations within its service area that have at least a five-year period of record, or a three year continuous period of record, to identify a more specifically-applicable evapotranspiration 7
166 for its service area. If no CIMIS station exists within the supplier s service area, a weather station of comparable accuracy, meeting the preceding period of record requirements, may be used. To qualify for the in-lieu climate adjustment, the supplier shall submit the following data to the Board by March 15, 2016 for each station: station ID; station location; and monthly average evapotranspiration, in inches per month, for July, August, and September for either the five-year period of record or the three-year continuous period of record. (2) To account for water efficient growth experienced in the state since 2013, urban water suppliers conservation standards shall be reduced by the product of the percentage change in potable water production since 2013 and the percentage reduction in potable water use required pursuant to subdivision (c), rounded to the nearest whole percentage point. Change in potable water production since 2013 shall be calculated as the sum of the following: (A) The number of additional permanent residents served since January 1, 2013, multiplied by the average residential water use per person for that supplier s service area during the months of February through October, 2015, in gallons; and (B) The number of new commercial, industrial and institutional connections since January 1, 2013, multiplied by the average commercial, industrial and institutional water use per connection for that supplier s service area during the months of February through October, 2015, in gallons. (C) To qualify for the growth credit the supplier shall submit to the Board the following data by March 15, 2016: the number of additional permanent residents served since January 1, 2013 and the number of new commercial, industrial and institutional connections since January 1, (3) For an urban water supplier that supplies, contracts for, or otherwise financially invests in, water from a new local, drought-resilient source of supply, the use of which does not reduce the water available to another legal user of water or the environment, the conservation standard identified in subdivision (c) shall be reduced: (A) By one (1) percentage point if the supplier s qualifying source of supply is one (1) percent or more but less than two (2) percent of the supplier s total potable water production; (B) By two (2) percentage points if the supplier s qualifying source of supply is two (2) percent or more but less than three (3) percent of the supplier s total potable water production; (C) By three (3) percentage points if the supplier s qualifying source of supply is three (3) percent or more but less than four (4) percent of the supplier s total potable water production; (D) By four (4) percentage points if the supplier s qualifying source of supply is four (4) percent or more but less than five (5) percent of the supplier s total potable water production; (E) By five (5) percentage points if the supplier s qualifying source of supply is five (5) percent or more but less than six (6) percent of the supplier s total potable water production; (F) By six (6) percentage points if the supplier s qualifying source of supply is six (6) percent or more but less than seven (7) percent of the supplier s total potable water production; 8
167 (G) By seven (7) percentage points if the supplier s qualifying source of supply is seven (7) percent or more but less than eight (8) percent of the supplier s total potable water production; (H) By eight (8) percentage points if the supplier s qualifying source of supply is eight (8) percent or more of the supplier s total potable water production. (I) To qualify for this reduction the supplier must certify, and provide documentation to the Board upon request demonstrating, the percent of its total potable water production that comes from a local, drought-resilient source of supply developed after 2013, the supplier s investment in that local, drought-resilient source of supply, and that the use of that supply does not reduce the water available to another legal user of water or the environment. To qualify for this reduction an urban water supplier shall submit the required certification to the Board by March 15, (J) Certifications that do not meet the requirements of subdivision (f)(3)(i), including certifications for which documentation does not support that the source of supply is a local, drought-resilient source of supply, the use of which does not reduce the water available to another legal user of water or the environment, will be rejected. Submitting a certification or supporting documentation pursuant to subdivision (f)(3)(i) that is found to be materially false by the Board is a violation of this regulation, punishable by civil liability of up to five hundred dollars ($500) for each day in which the violation occurs. Every day that the error goes uncorrected constitutes a separate violation. Civil liability for the violation is in addition to, and does not supersede or limit, any other remedies, civil or criminal. (4) No urban water supplier s conservation standard pursuant to this section shall drop below eight (8) percent as a consequence of the reductions identified in this subdivision. No reduction pursuant to this subdivision shall be applied to any urban water supplier whose conservation standard is four (4) percent based on subdivision (c)(2). (g)(1) To prevent waste and unreasonable use of water and to promote water conservation, each distributor of a public water supply that is not an urban water supplier shall take one or more of the following actions: (1) Provide prompt notice to a customer whenever the supplier obtains information that indicates that a leak may exist within the end-user s exclusive control; and (A) Limit outdoor irrigation of ornamental landscapes or turf with potable water by the persons it serves to no more than two days per week; or (B) Reduce by 25 percent its total potable water production relative to the amount produced in (2) Each distributor of a public water supply that is not an urban water supplier shall submit Submit a report by September December 15, 2016, on a form provided by the Board, that either confirms compliance with subdivision (g)(1)(a) or identifies total potable water production, by month, from December, 2015 through AugustNovember, 2016, and total potable water production, by month, for the same months in 2013, and any actions taken by the supplier to encourage or require its customers to conserve water. 9
168 Authority: Section , Water Code. References: Article X, Section 2, California Constitution; Sections 102, 104, 105, 275, 350, 1846, and 10632, Water Code; Light v. State Water Resources Control Board (2014) 226 Cal.App.4th Sec Additional Conservation Tools. (a)(1) To prevent the waste and unreasonable use of water and to promote conservation, when a water supplier does not meet its conservation standard required by section or section 865 the Executive Director, or the Executive Director s designee, may issue conservation orders requiring additional actions by the supplier to come into compliance with its conservation standard. (2) A decision or order issued under this article by the Board or an officer or employee of the Board is subject to reconsideration under article 2 (commencing with section 1122) of chapter 4 of part 1 of division 2 of the Water Code. (b) The Executive Director, or his designee, may issue an informational order requiring water suppliers, or commercial, industrial or institutional properties that receive any portion of their supply from a source other than a water supplier subject to section or 865, to submit additional information relating to water production, water use or water conservation. The failure to provide the information requested within 30 days or any additional time extension granted is a violation subject to civil liability of up to $500 per day for each day the violation continues pursuant to Water Code section (c) Orders issued under previous versions of this subdivisionsection shall remain in effect and shall be enforceable as if adopted under this version. Changes in the requirements of this article do not operate to void or excuse noncompliance with orders issued before those requirements were changed. Authority: Section , Water Code. References: Article X, Section 2, California Constitution; Sections 100, 102, 104, 105, 174, 186, 187, 275, 350, 1051, 1122, 1123, 1825, 1846, and 10632, Water Code; Light v. State Water Resources Control Board (2014) 226 Cal.App.4th
169 Appendix C SFPUC Request for 10 Percent Voluntary Conservation
170
171 San Francisco Water ower Sewer Operator of the Hetch Hetchy Regional Water System 525 Golden Gate Avenue, 12th Floor San Francisco, CA T F TTY TO: FROM: SFPUC Wholesale Customers Steven R. Ritchie, Assistant General Manager, Water DATE: January 31, 2014 RE: Initial Water Supply Availability Estimate Due to the historically dry conditions of calendar year 2013 and water year (WY) 2014, the SFPUC has announced a 10 percent voluntary reduction in water use throughout the SFPUC service area. We believe that a voluntary reduction is a prudent course of action to preserve water supplies in storage that will help us all in subsequent years if drought conditions persist. Based on historical precipitation patterns, the SFPUC typically receives nearly two thirds of its precipitation for the water year from December through March. However, the SFPUC watersheds received minimal rainfall in December and January. The plot below provides precipitation at Hetch Hetchy through January 30, Edwin M. Lee Mayor Vince Courtney President Oct Nov Dec Jan Feb Mar Apr May Jun Jul Aug Sep Ann Moller Caen WYI977 \\>t Year. WY19S3 Median VVY2013 VVY20U The lack of rainfall at Hetch Hetchy in January has moved WY2014 to conditions at or below that of WY1977, one of the driest years on record for Hetch Hetchy and all of California. While the recent rain event at the end of January brought precipitation back to tracking WY1977, without additional precipitation WY2014 may still end up drier than WY1977. In addition to the lack of precipitation, there is little to no snowpack in the Hetch Hetchy watershed. Vice President Franceses Vietor Commissioner Anson Moran Commissioner Art Torres Commissioner Harlan L. Kelly, Jr. General Manager Services of the San Francisco Public Utilities Commission
172 As a result of current reservoir storage, current snowpack, forecasted reservoir inflow and projected customer demands provided by BAWSCA to the SFPUC on January 30, 2014, the SFPUC is requesting its customers reduce their projected water use by 10 percent this year. Our customers have continued to demonstrate a commitment to water conservation and adopting best practices for water use. We also know that our customers have a proven track record of doing their part to conserve even more during droughts. We will provide additional information regarding the hydrologic conditions next week and at the Wholesale Customer meeting on February 13, We also encourage you to visit our website at where you can find information regarding water use reductions, track water consumption, reservoir storage, inflow and precipitation data. cc: Nicole Sandkulla, CEO/General Manager, BAWSCA


173 NEWS ADVISORY (Advisory No. 2-14) FOR IMMEDIATE RELEASE Contact: Tyrone Jue ; (cell) or 525 Golden Gate Avenue, 12th Floor San Francisco, CA T F TTY Tuesday, January 28, 2014 SFPUC General Manager Harlan Kelly s Statement on Voluntary, 10% Water Conservation Request SAN FRANCISCO, CA San Francisco Public Utilities Commission General Manager Harlan Kelly issued the following statement today regarding a request for customers to voluntarily curtail water use by 10%. On Friday, January 31 st, the San Francisco Public Utilities Commission will ask customers of the Hetch Hetchy Regional Water System to voluntarily curtail water consumption by at least 10%. Over the next few days, I will be working closely with Mayor Ed Lee, San Francisco city departments and our Bay Area wholesale customers to develop strategies to meet this water conservation goal. I believe voluntary water conservation efforts are the best way to avert mandatory cutbacks and other water restrictions should drought conditions persist. A formal announcement and media availability will take place on Friday. Details will be made available in a press advisory the day prior. The SFPUC provides reliable, high quality drinking water to 2.6 million people in San Francisco, San Mateo, Santa Clara and Alameda Counties. As always, the SFPUC encourages our customers to conserve water. Here are some helpful tips to conserve water around the house. 1. Turn off the faucet when you are brushing your teeth or doing the dishes - save 2 gallons per minute. 2. Take shorter showers. Each minute you cut saves 2.5 gallons. Make sure you or your property owner have installed a high-efficiency showerhead. 3. Operate your clothes and dishwashers with full loads only, even if the machine has an adjustable load setting. 4. Use a broom to clean sidewalks, driveways and pavement instead of using a hose. 5. Reduce outdoor watering needs by planting species appropriate for the Bay Area s dry climate. 6. Water during the cool part of the day. Reduce evaporation by watering lawns and plants only at night or early morning before dawn. 7. Detect leaks. Do you hear the toilet running or your faucet dripping? Contact the SFPUC or your local water agency for information on locating your water meter and detecting plumbing leaks using meter readings. Conducting a dye-test in toilet tanks can identify costly silent leaks. 8. Install aerators on bathroom and kitchen sinks to reduce indoor water use by about 4%. - more -
174 9. Many Bay Area water utilities provide a number of efficient conservation plumbing fixtures for free. The SFPUC provides free faucet aerators, lowflow showerheads and garden spray nozzles to San Francisco residents. Pickup in person with proof of address at 525 Golden Gate Avenue, San Francisco Monday through Friday, 8:00 a.m. 5:00 p.m. 10. Replace your old toilet, the largest water user inside your home. New highefficiency toilet models flush at 1.3 gallons or less compared to older models, which use up to 7 gallons per flush. Bay Area water agencies offer cash rebates for the purchase of select high-efficiency toilets. 11. Replace your clothes washer, the second largest water user in your home. High efficiency clothes washers can reduce water and energy use by 40%. Bay Area water agencies offer cash rebates for the purchase of select high-efficiency clothes washers. Updates and additional information will be available at sfwater.org/supplyupdate. ###
175 Appendix D SFPUC Minimum Purchase Waivers
176
177 San Francisco Water Power Sewer Operator of the Hetch Hetchy Regional Water System 525 Golden Gate Avenue, 13th Floor San Francisco, CA T F TTY March 7, 2014 Ms. Nicole Sandkulla Chief Executive Officer/ General Manager Bay Area Water Supply and Conservation Agency 155 Bovet Road, Suite 650 San Mateo, CA Re: Waiver of Minimum Purchase Requirements During Drought (WSA Section 3.07) Dear Ms. Sandkulla: The SFPUC has called for voluntary 10% rationing from its wholesale and retail customers. The Commission has not adopted a resolution to this effect, but the matter was discussed during my water supply update at the Commission hearing on January 14, 2014 and again on February 25, 2014, and has been widely publicized in the news media and on the Commission's website. In response to our request for 10% voluntary conservation, I received an message on January 28, 2014 from Gregg A. Hosfeldt, Assistant Public Works Director of the City of Mountain View, and a letter dated January 30, 2014 from Mansour Nasser, Water and Sewer Division Manager for the City of Sunnyvale. Mr. Hosfeldt and Mr. Nasser each requested a waiver of their respective minimum purchase volumes in the event that their customers respond to our request for voluntary 10% conservation and their total FY water purchases fall below the minimum purchase volumes listed in Attachment E of the 2009 Water Supply Agreement (WSA). As you know, Mountain View and Sunnyvale, along with the City of Milpitas and the Alameda County Water District (ACWD), have minimum purchase (take or pay) requirements under section 3.07 and Attachment E of the WSA. WSA section 3.07.C provides that the minimum purchase requirements...will be waived during a Drought or other period of water shortage if the water San Francisco makes available to these Wholesale Customers is less than its minimum purchase quantity. Mr. Nasser's letter points out that the Commission has not adopted mandatory rationing that would trigger application of the Water Shortage Plan (WSA Attachment H), such that each wholesale customer would have a "Tier 2" allocation that would establish the amount of water that the SFPUC "makes available" to the four wholesale customers with minimum purchase requirements. Edwin M. Lee Mayor Vince Courtney President Ann Mailer Caen Vice President Francesca Vietor Commissioner Anson Moran Commissioner Art Torres Commissioner Harlan L. Kelly, Jr. General Manager Services of the San Francisco Public Utilities Commission

178 We continue to monitor the water supply situation. Given the dry conditions to date we continue to urge all Regional Water System customers to voluntarily conserve 10% over the coming year. Following our April 15 final determination of the available water supply under the terms of the Water Shortage Plan, we will ask the Commission to adopt a resolution that either continues to urge voluntary conservation or imposes mandatory rationing. In the latter case, the waiver of minimum purchase requirements would be required under WSA section 7.03C to the extent that the Tier 2 allocations "made available" to customers with minimum purchase requirements are less than the amounts shown in WSA Attachment E. If mandatory rationing is required by the SFPUC, the required waiver would most likely extend to water deliveries through FY , because it may be necessary to continue conservation efforts in the event that the drought continues in water year commencing on October 1, Requiring wholesale customers to meet their minimum purchase requirements when we have asked for a voluntary 10% reduction in demand sends the wrong message to these customers and the public at large. Despite the absence of Tier 2 allocations arising from mandatory rationing at the present time, the SFPUC agrees to a one time waiver of the minimum purchase requirements of Mountain View, Sunnyvale, Milpitas, and the ACWD for up to 10% of their minimum purchase requirements as shown in the following table: Customer Minimum Purchase Volume Adjusted Minimum Purchase Volume Sunnyvale mgd mgd Mountain mgd mgd View Milpitas mgd mgd ACWD mgd mgd The waiver offer in this letter will be ratified as part of the future commission action following the April 15 final declaration of available water supply and is subject to the following conditions: 1. Purchase of less than adjusted minimum purchase volumes shown in the table would still be subject to the take or pay requirements of WSA section 3.07, as measured by the difference between metered volumes purchased and the adjusted minimum purchase volumes. 2. The waiver applies only to water deliveries over the course of FY (July 1, 2013 to June 30, 2014), and shall not be construed as precedent for waivers during future droughts that do not result in a call for mandatory rationing. 3. The adjusted minimum purchase volumes shown in the table will be superseded in the event that the SFPUC adopts mandatory rationing, in which case the amount "made available" to these customers under the Tier 2 allocation process by BAWSCA will control. 4. If the Tier 2 allocations "made available" by the SFPUC as a result of mandatory rationing exceed the volumes shown in the table (e.g. 95% of the 2
179 contractual minimum), the SFPUC will continue to honor the 10% waiver shown in the table for the remainder of FY If the total estimated volume of water stored in the Regional Water System increases by April 15, 2014 such that the SFPUC rescinds the call for voluntary rationing, the SFPUC will continue to honor the 10% waiver shown in the table for the remainder of FY The SFPUC reserves the right to adjust the final Wholesale Revenue Requirement for FY to the extent that it can demonstrate that the waiver caused financial harm to retail customers due to corresponding adjustment of the retail/wholesale proportional use ratio that underlies the allocation of most capital costs and O&M expenses in the WSA. The amount of such adjustments would be subject to negotiation with BAWSCA as part of the wholesale customer review process in WSA section Thank you for working with us to preserve water supplies available to the Regional Water System in the face of unusually dry conditions. Very truly yours, Steven R. Ritchie Assistant General Manager, Water Enterprise cc: Commission members H. Kelly T. Rydstrom C. Perl E. Levin J. Milstein W. Wadlow, ACWD G. Hosfeldt, City of Mountain View M. Nasser, City of Sunnyvale J. Moneda, City of Milpitas
180
181 C-\n Pranricrn G o l d e n G a t e A v e n u e. 1 3 t h F o o r OCll I I railuloccj San Francisco, CA Water Power Sewer Operator of the Hetch Hetchy Regional Water System TTY Operator of the Ht July 2, 2014 T F Ms. Nicole Sandkulla Chief Executive Officer/ General Manager Bay Area Water Supply and Conservation Agency 155 Bovet Road, Suite 650 San Mateo, CA Re: Waiver of Minimum Purchase Requirements During Drought (WSA Section 3.07) Dear Ms. Sandkulla: This letter is in follow up to my correspondence of March 7, 2014 extending a waiver of the minimum purchase requirements for ACWD, Milpitas, Mountain View, and Sunnyvale for FY 2013/14 as a result of the drought. As you know, SFPUC continues to call for voluntary 10% rationing from its wholesale and retail customers. As a result, we are extending the waiver of minimum purchase requirements under WSA section 3.07 for those customers through FY 2014/15 on the same terms set forth in the March 7 letter. Further details are provided below. To date, the Commission has not adopted mandatory rationing that would trigger application of the Water Shortage Plan (WSA Attachment H), such that each wholesale customer would have a "Tier 2" allocation that would establish the amount of water that the SFPUC "makes available" to the four wholesale customers with minimum purchase requirements. We continue to monitor the water supply situation carefully, but we do not foresee moving to mandatory rationing in the immediate future. Though the March 7 th letter stated that the waiver offer would be ratified as part of a Commission action, we don't think that formal Commission action is necessary given that mandatory rationing will not be imposed. Given the continuing call for a 10% reduction, I am extending the waiver of the minimum purchase requirements of Mountain View, Sunnyvale, Milpitas, and the ACWD for up to 10% of their minimum purchase requirements through FY 2014/15 as shown in the following table: Customer Minimum Purchase Volume Adjusted Minimum Purchase Volume Sunnyvale mgd mgd Mountain View mgd mgd Milpitas mgd mgd ACWD mgd mgd Edwin M. Lee Mayor Vince Courtney President Ann MoIlerCaen Vice President Francesca Vietor Commissioner Anson Moran Commissioner Art Torres Commissioner Harlan L. Kelly, Jr. General Manager The waiver offer in this letter is subject to the following conditions: Services of the San Francisco Public Utilities Commission
182 1. Purchase of less than adjusted minimum purchase volumes shown in the table will not be subject to the take or pay requirements of WSA section 3.07 provided that purchase of less than the adjusted minimums is due to additional demand reduction efforts (e.g. conservation and recycling) in the service areas of the wholesale customers subject to WSA section Purchases of less than the adjusted minimums shown in the table that are due to purchase of other sources of water (e.g. State Water Project purchases or water transfers) shall continue to be subject to the take or pay requirements of WSA section The waiver applies only to water deliveries over the course of FY and (July 1, 2013 to June 30, 2015), and shall not be construed as precedent for waivers during future droughts that do not result in a call for mandatory rationing. 3. The adjusted minimum purchase volumes shown in the table will be superseded in the event that the SFPUC adopts mandatory rationing, in which case the amount "made available" to these customers will be under the Tier 2 allocation process controlled by BAWSCA. 4. If the Tier 2 allocations "made available" by the SFPUC as a result of mandatory rationing exceed the volumes shown in the table (e.g. 95% of the contractual minimum), the SFPUC will continue to honor the 10% waiver shown in the table for the remainder of FY Ifthe total estimated volume of water stored in the Regional Water System increases such that the SFPUC rescinds the call for voluntary rationing, the SFPUC will continue to honor the 10% waiver shown in the table for the remainder of FY The SFPUC reserves the right to adjust the final Wholesale Revenue Requirement for FY and FY to the extent that it can demonstrate that the waiver caused financial harm to retail customers due to corresponding adjustment of the retail/wholesale proportional use ratio that underlies the allocation of most capital costs and O & M expenses in the WSA. The amount of such adjustments would be subject to negotiation with BAWSCA as part of the wholesale customer review process in WSA section Thank you for working with us to preserve water supplies available to the Regional Water System in the face of unusually dry conditions. Very.truly yours, Steven R. Ritchie Assistant General Manager, Water Enterprise Commission members H. Kelly T. Rydstrom C. Perl E. Levin D. Briggs J. Milstein W. Wadlow, ACWD G. Hosfeldt, City of Mountain View M. Nasser, City of Sunnyvale J. Moneda, City of Milpitas
183 San Francisco Water Power Sewer Operator of the Hetch Hetchy Regional Water System 525 Golden Gate Avenue, 13th Floor San Francisco, CA T F TTY April 15, 2015 Ms. Nicole Sandkulla Chief Executive Officer/ General Manager Bay Area Water Supply and Conservation Agency 155 Bovet Road, Suite 650 San Mateo, CA Re: Waiver of Minimum Purchase Requirements During Drought (WSA Section 3.07) Dear Ms. Sandkulla: As you know, on top of the SFPUC's call for voluntary 10% water use reduction from its wholesale and retail customers as a result of the ongoing drought, the State Water Board is poised to require further water use reduction. Last year, the SFPUC extended a waiver of the minimum purchase requirements for ACWD, Milpitas, Mountain View, and Sunnyvale. Through this letter, we are further extending the waiver of minimum purchase requirements under WSA section 3.07 for those customers through FY Further details are provided below. To date, the Commission has not adopted mandatory rationing that would trigger application of the Water Shortage Plan (WSA Attachment H), such that each wholesale customer would have a "Tier 2" allocation that would establish the amount of water that the SFPUC "makes available" to the four wholesale customers with minimum purchase requirements under WSA section 3.07.C. We continue to monitor the water supply situation carefully, but we do not foresee moving to mandatory rationing pursuant to the WSA in the immediate future. However, we recognize the State Water Resources Control Board will likely mandate rationing at the state level that would force certain Wholesale Customers to reduce sales more than 10%. We are waiving minimum purchase requirements in that case as well, as long as the reduced purchases are due to an overall net decrease in demand, as further described under the first bullet, below. The waiver offer in this letter is subject to the following conditions: 1. Purchase of less than the minimum purchase volumes shown in WSA Attachment E will not be subject to the take or pay requirements of WSA section 3.07 provided that purchase of less than the minimum purchase volumes is due to net demand reduction efforts in the service areas of the wholesale customers subject to WSA section Purchases of less than the adjusted minimums shown in WSA Attachment E that are due to purchase of other sources of water that result in a net increase of total demand (e.g. State Water Edwin M. Lee Mayor Ann MollerCaen President Francesca Vietor Vice President Vince Courtney Commissioner Anson Moran Commissioner Ike Kwon Commissioner Harlan L. Kelly, Jr. General Manager Services ofthe San Francisco Public Utilities Commission
184 Project purchases or water transfers) shall continue to be subject to the take or pay requirements of WSA section The waiver applies only to water deliveries over the course of FY FY , and FY (July 1, 2015 through June 20, 2016) and shall not be construed as precedent for waivers during future droughts that do not result in a call for mandatory rationing. 3. In the event that the SFPUC adopts mandatory rationing, the amount "made available" to these customers will be under the Tier 2 allocation process initially determined by BAWSCA, as may be subject to modification for higher per capita water users under the State's forthcoming emergency regulations responding to Governor Brown's April 1, 2015 Order B If the total estimated volume of water stored in the Regional Water System increases such that the SFPUC rescinds the call for voluntary rationing, the SFPUC will continue to honor the minimum purchases waiver for the remainder of FY The SFPUC reserves the right to adjust the final Wholesale Revenue Requirement for FY , FY , and FY to the extent that it can demonstrate that the waiver caused financial harm to retail customers due to corresponding adjustment of the retail/wholesale proportional use ratio that underlies the allocation of most capital costs and O & M expenses in the WSA. The amount of such adjustments would be subject to negotiation with BAWSCA as part of the wholesale customer review process in WSA section Thank you for working with us to preserve water supplies available to the Regional Water System in the face of unusually dry conditions. Very truly yours, Steven R. Ritchie Assistant General Manager, Water cc: Commission members H. Kelly C. Perl E. Levin D. Briggs J. Milstein R. Shaver, ACWD G. Hosfeldt, City of Mountain View M. Nasser, City of Sunnyvale S. Machida, City of Milpitas
185
186
187 Appendix E SFPUC April 2017 Final Water Supply Availability Estimate
188
189 San Francisco Water 1,1wer Sewer Operator of the Hetch Hetchy Regional Water System 525 Golden Gate Avenue, 13th Floor San Francisco, CA T F m TO: FROM: SFPUC Wholesale Customers Steven R. Ritchie, Assistant General 1\4anager, Water DATE: April 4, 2017 RE: Final Water Supply Availability Estimate This memo provides an update on the water supply availability estimate provided March 1st, 2017 and the current hydrologic conditions. The plots below provide precipitation at Hetch Hetchy and snowpack in the watershed through April 2nd, As the plots show, the Hetch Hetchy watershed has experienced exceptionally wet conditions to date. While we are still waiting on some high elevation snow measurement data, the preliminary April 1 snow course index is about 175% of median April 1st snowpack. Precipitation at Hetch Hetchy - Water Year (i) LI 180 > 4( 160 Median Dry 13.W _ ; a a c r, x :** 11' Oct Nov Dec Jan Feb Mar Apr May Jun Jul Aug Sep. Edwin M. Lee Mayor Anson Moran President Ike Kwon Vice President Ann Moller Caen Commissioner Francesca Vietor Commissioner Vince Courtney Commissioner Harlan L. Kelly, Jr. General Manager Services of the San Francisco Public Utilities Commission
190 , % of Median April 1 Snowpack Conditions Ill li Median WY 2017 c WY WY 2015 WY ' * * * 2017 Snow Course Index WY 1983 O - * * * 1983 Snow Course Index..) i Y r, I * 80 15_ 60 \ 20 tit 0 c? 0 tt, O '...ji -,.\-..._ CO CV 0, C < < < O 9 7 CO 4 8 ti; ) et 4, Water available to San Francisco under the Raker Act has well exceeded what was needed in order to ensure filling the entire water system by July 1, The SFPUC has received 1,651,000 acre-feet of water available to San Francisco as of April 2nd, as shown in the plot below. Tuolumne River Water Available to San Francisco: 1800 Water Year 2017 o 1400 UI 1600 fa 1200 to ( Amount Needed to Achieve Full Storage on July 1, 2017 WY2014 Actual WY2015 Actual - WY2016 Actual Y Actual 600 <LI a) co 200 ( Oct Nov Dec Jan Feb Mar Apr May Jun Jul 2
191 As previously indicated in the March 1St water supply availability estimate, the SFPUC water system will fill this year. The SFPUC will be able to meet 100% of its customers' needs this year. There is no need to continue requesting voluntary reductions in any part of the service area. As always, our customers' commitments to water conservation ensure our ability to carryover water in our reservoirs from one year to the next. This commitment results in improved water supply reliability and reduces the risk of water shortages in the event that next year is dry. All of the users of our water system benefit from the continuation of wise water use. Finally, we will no longer waive the minimum purchase requirements effective July 1, After that date, purchases of less than the minimums shown in WSA Attachment E will be subject to the take or pay requirements of WSA section cc.: Nicole Sandkulla, CEO/General Manager, BAWSCA 3
192
193 Appendix F SFPUC and BAWSCA Regional Drought Campaign Artwork
194

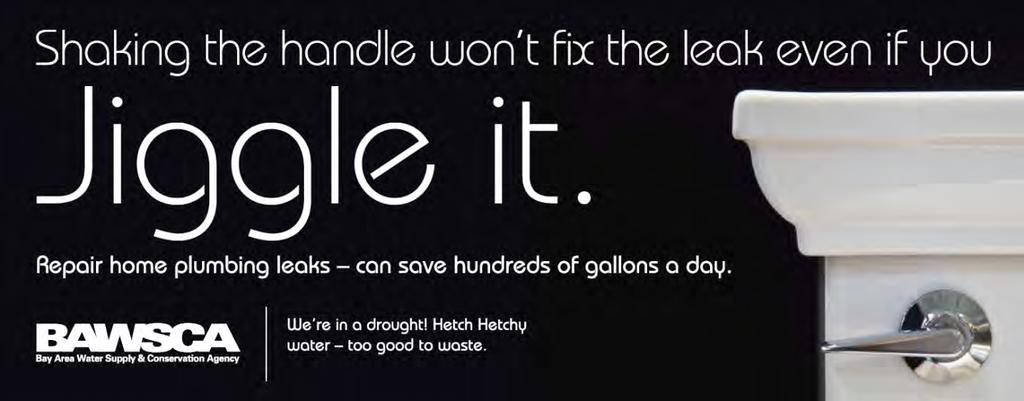

195 2014 SFPUC-BAWSCA Regional Drought Messaging Campaign Artwork
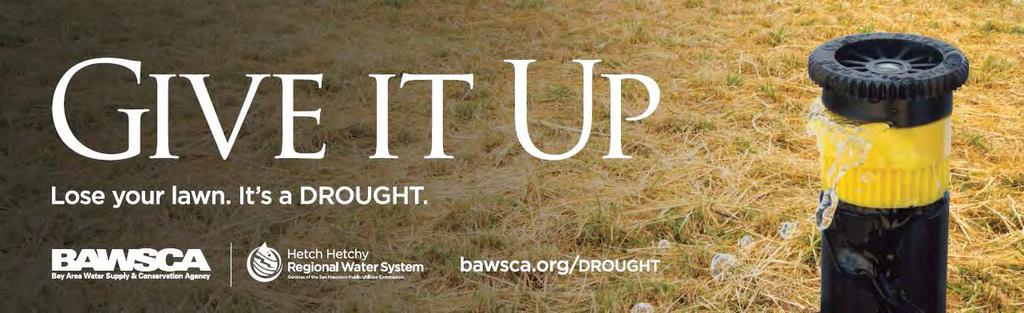
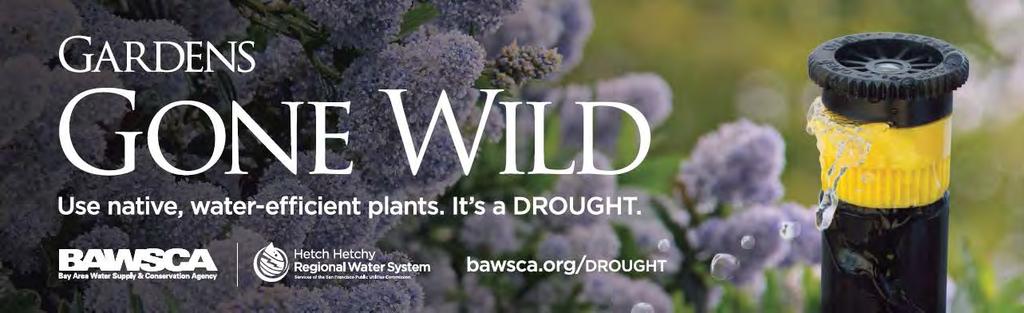


196 2015 SFPUC-BAWSCA Regional Drought Messaging Campaign Artwork

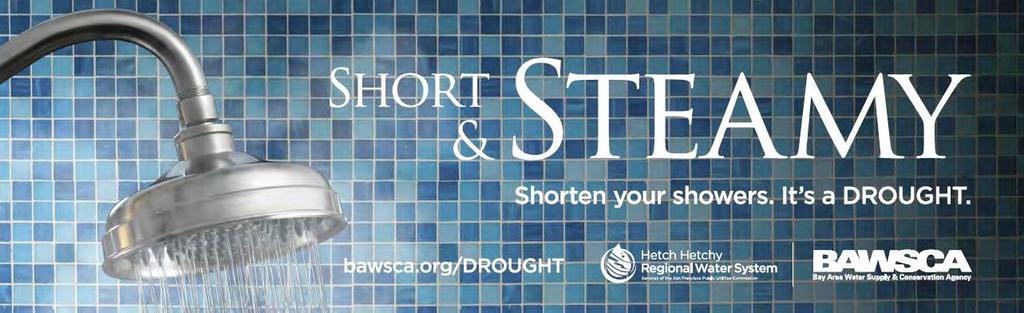
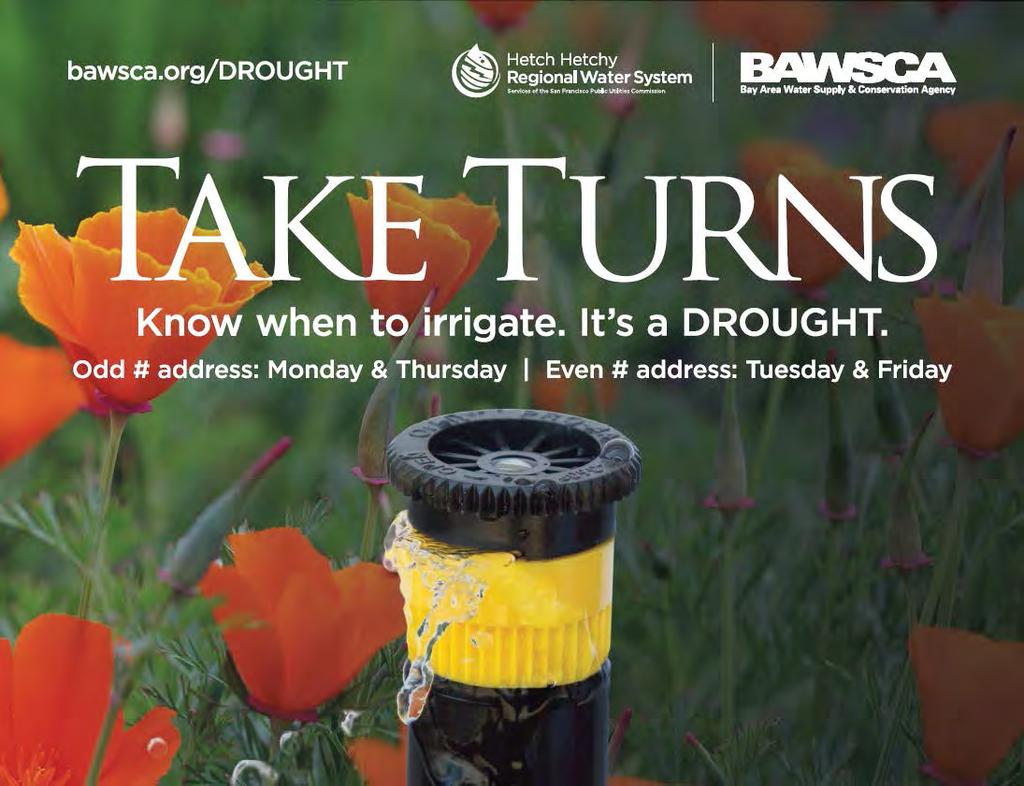
197
198
199 Appendix G Regional Drought Messaging Material Graphics
200


201


202


203
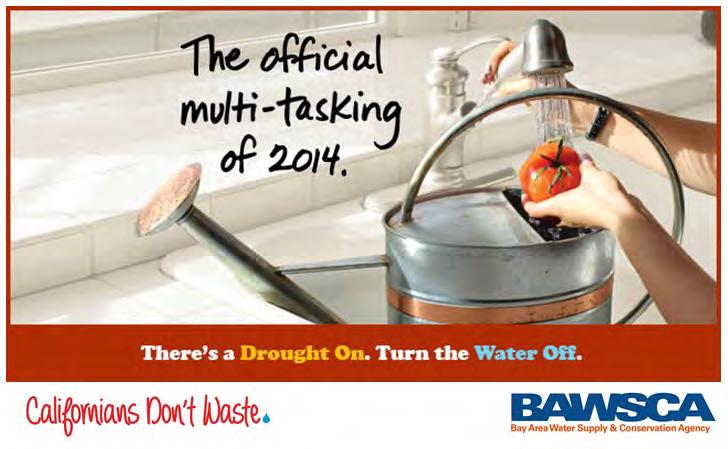
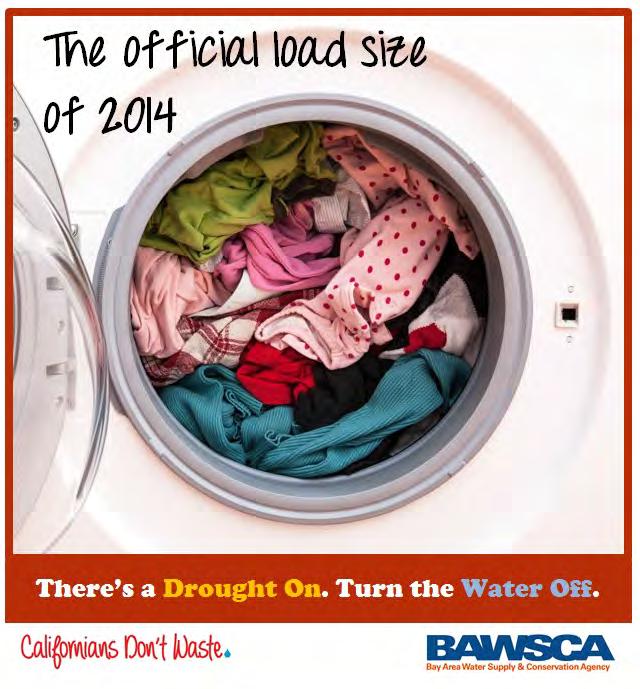
204
205 Appendix H Technical Memorandum: BAWSCA EBMUD Pilot Water Transfer Phase II Plan
206
207 Technical Memorandum: BAWSCA-EBMUD Pilot Water Transfer Phase II Pilot Plan Background and Introduction The Long-Term Reliable Water Supply Strategy Phase IIA Report (Strategy Phase IIA Report) (BAWSCA, 2012) identified water transfers from sources (sellers) outside the BAWSCA service area as a promising option to address the dry year reliability needs of the BAWSCA member agencies. The initial analysis done in the Strategy Phase IIA Report estimated that the costs of pilot water transfer are lower compared to other alternative supplies, resulting from the fact that a water transfer utilizes existing infrastructure and is a supply that is obtained only in dry years. A key recommendation presented in the Strategy Phase IIA Report was that the Bay Area Water Supply and Conservation Agency (BAWSCA) develop a plan for a pilot water transfer with either the East Bay Municipal Utility District (EBMUD) or the Santa Clara Valley Water District (SCVWD). In May 2012, EBMUD identified water projects to meet its future dry year water supply needs including the newly completed Freeport Regional Water Project (FRWP) that diverts water from the Sacramento River and conveys it to EBMUD s service area. As shown on Figure 1, a water transfer involving EBMUD and BAWSCA would involve purchasing water from a willing seller, diverting the water using the FRWP intake, conveying the water through the FRWP facilities, the US Bureau of Reclamation s (USBR) Folsom South Canal, and EBMUD s raw water and treated water distribution systems, and delivering the transfer water to the BAWSCA service area via the San Francisco Public Utilities Commission-EBMUD-City of Hayward Intertie (Hayward Intertie), located in the City of Hayward (Hayward), which is jointly owned by EBMUD and the San Francisco Public Utilities Commission (SFPUC). Transfer water delivered from EBMUD through the Hayward Intertie would be directly used by Hayward in lieu of taking delivery of a like amount of water from the San Francisco Regional Water System (SFRWS) (EBMUD and BAWSCA 2013). BAWSCA staff met with potential sellers north of the Delta in 2013, 2014, and 2015, which has led to detailed discussion of a 1,000-AF pilot transfer with Yuba County Water Agency (YCWA). The Pilot Plan In September 2012, EBMUD and BAWSCA entered into a Memorandum of Understanding to prepare the BAWSCA EBMUD Short-Term Pilot Water Transfer Plan (Pilot Plan; EBMUD and BAWSCA, 2013). The purpose of the Pilot Plan was to evaluate the feasibility of partnering as buyers on long-term water transfer projects to improve future water supply reliability for the respective agencies. The Pilot Plan, published in September 2013, studied the potential to conduct a one-year pilot water transfer of 1,000 AF in a future dry-year when EBMUD is planning to operate the Freeport Regional Water Project (FRWP). The Pilot Plan concluded that a short-term pilot water transfer would be both feasible and beneficial for BAWSCA and EBMUD. Conducting a one-year pilot water transfer with a willing seller would provide important information needed to evaluate the costs and benefits of a long-term water transfer partnership. The Pilot Plan develops the basics of the pilot water transfer timing, rate, duration, potential costs, necessary agreements and approvals, and next steps. The Pilot Plan also evaluated the 1
208 Phase II Pilot Plan Memorandum BAWSCA, July 2015 feasibility of partnering on long-term water transfer projects to improve future water supply reliability for both agencies. The Pilot Plan (EBMUD and BAWSCA 2013) identified the following five key agreements necessary to conduct the Pilot Water Transfer: Water Purchase Agreement: Agreement for the purchase of water from willing seller; BAWSCA-EBMUD Wheeling Agreement: Agreement outlines the terms and conditions for EBMUD to wheel the transfer water, secured and purchased by BAWSCA, through EBMUD and USBR facilities to the Hayward Intertie; Hayward Intertie Pilot Transfer Agreement: Three-party agreement that defines the terms for the use of Hayward Intertie for the Pilot Water Transfer among EBMUD, SFPUC, Hayward, and BAWSCA; BAWSCA-Hayward Agreement: Agreement outlines the procedures for documenting and reimbursing Hayward for appropriate costs incurred to implement the transfer and identifies terms of use for Hayward s system beyond the EBMUD point of delivery; BAWSCA-SFPUC Agreement: Agreement outlines the operational and water accounting guidelines between BAWSCA and SFPUC for conveying purchased water to member agencies by in-lieu means through the San Francisco Regional Water System (RWS). Each of the agreements above will be discussed in detail throughout this Memorandum. Phase II of the Pilot Plan In January 2014, BAWSCA and EBMUD signed the Memorandum of Understanding between East Bay Municipal Utility District and the Bay Area Water Supply and Conservation Agency for the Development of the Second Phase of a Short-Term Pilot Water Transfer Plan (Phase II MOU) to implement the second phase (Phase II) of the Pilot Plan. Phase II of the Pilot Plan has included drafting, revising and finalizing necessary agreements between BAWSCA, YCWA, EBMUD, Hayward, and the SFPUC; preparing environmental compliance documentation; and ongoing coordination between BAWSCA and each of the other agencies involved in the pilot. As presented in the Pilot Plan (EBMUD and BAWSCA 2013), the three key components of Phase II were to be: 1) Identify a willing seller to participate in the pilot water transfer; 2) Engage the other key stakeholders in the planning process for the pilot water transfer, including Hayward, SFPUC, and regulatory agencies; and 3) Develop a plan a schedule and plan to pursue the necessary agreements and prepare documentation for environmental approvals necessary to engage in a pilot water transfer. BAWSCA and EBMUD began these tasks shortly after publication of the Pilot Plan in 2013, and anticipated that it would take approximately one year to complete the agreements between (1) BAWSCA and SFPUC and (2) BAWSCA and Hayward. Concurrently, it was anticipated that the Hayward Intertie Agreement could be amended to accommodate the pilot water transfer. The Pilot Plan anticipated that finalizing a water purchase agreement and the BAWSCA-EBMUD wheeling agreement and preparing documentation necessary for environmental review and regulatory agency 2
209 Phase II Pilot Plan Memorandum BAWSCA, July 2015 approvals would be pursued in a drought year, when it was anticipated that EBMUD would operate the FRWP (EBMUD and BAWSCA 2013). Instead, right after the start of Phase II, it became clear that drought conditions were worsening such that EBMUD would be initiating the use of the FRWP immediately. As such, all of the documentation needed to implement the pilot transfer has been pursued concurrently. The drought has changed the course of work during Phase II: it has motivated progress towards completing agreements and environmental compliance, but it has also highlighted some further challenges for water transfer implementation. This Technical Memorandum presents the progress and the results achieved to date towards the implementation of a pilot transfer during Phase II of the Pilot Plan. Overview of Agreements and Environmental Compliance Table 1 provides a list of the required agreements, environmental compliance, and regulatory approvals that are required for implementation of the pilot water transfer. Progress on each of these items during Phase II is presented in the subsequent sections. Table 1. Summary of Key Institutional Agreements, Environmental Compliance, and Regulatory Approvals Needed to Implement a BAWSCA-EBMUD Pilot Water Transfer. Action Needed for Pilot Transfer Implementation Primary Responsible Party Transfer Agreements Water Transfer Agreement with Seller EBMUD- BAWSCA Wheeling Agreement BAWSCA-SFPUC Pilot Transfer Agreement Internal Agreements and Arrangements to Distribute Water to BAWSCA Agencies BAWSCA- Hayward Pilot Transfer Agreement Required Required Required Required Required BAWSCA / Seller EBMUD / BAWSCA BAWSCA / SFPUC BAWSCA BAWSCA / Hayward 3
210 Phase II Pilot Plan Memorandum BAWSCA, July 2015 Action Needed for Pilot Transfer Implementation Primary Responsible Party Hayward Intertie Hayward Intertie Operating Agreement (2007) Updated Intertie Operations Plan Environmental Compliance Amendment required to allow for one-year pilot test (4) May be needed to define operations specific to the pilot EBMUD / SFPUC / Hayward EBMUD / SFPUC / Hayward State Resource Laws CEQA exemption(s) Seller / BAWSCA Federal Resource Laws Compliance with NEPA, ESA (2) USBR / BAWSCA / EBMUD Regulatory Agency Approvals State Water Resources Control Board (SWRCB) Temporary Change in Place of Use Order Required (3) Seller / BAWSCA SWRCB DDW Permit Required EBMUD / BAWSCA United States Bureau of Reclamation (USBR) Required for Warren Act contract USBR / BAWSCA Water Transfer Agreement with Yuba County Water Agency The Pilot Plan (EBMUD and BAWSCA 2013) reviewed a number of potential water transfer partners with water supplies available for potential transfer and recommended that BAWSCA and EBMUD meet with both Yuba County Water Agency and the Placer County Water Agency to discuss potential participation in the pilot water transfer. EBMUD had preliminary discussions with both agencies related to their own interests in acquiring transfer supplies. In the course of those discussions, EBMUD determined that YCWA was interested in participating in a pilot water transfer with BAWSCA by selling BAWSCA a small quantity of transfer water. In December 2013, BAWSCA met with representatives of YCWA in a joint meeting with EBMUD. Both YCWA and BAWSCA confirmed their interest in partnering on a pilot water transfer and agreed to continue discussions about the potential for a pilot transfer in The Pilot Plan (EBMUD and BAWSCA 2013) provides a detailed description of the Lower Yuba River Accord (Yuba Accord), but some background is included here for context. The Yuba Accord is a 17-party agreement that resolves decades of disputes over instream flow issues associated with operation of the Yuba Project in a way that protects and enhances lower Yuba River fisheries, improves water supply reliability and provides revenues for local flood control and water supply projects. The Yuba Accord was implemented in 2008 and corresponded with the addition of the State Water Project (SWP) and Central Valley Project (CVP) service areas as approved places of use to YCWA s water rights through the year The Yuba Accord originally included the Delta export pumps as the approved points of 4
211 Phase II Pilot Plan Memorandum BAWSCA, July 2015 rediversion, but in March 2014, YCWA added the FRWP intake as a point of rediversion for the YCWA water rights. The Yuba Accord includes a fisheries agreement and seven conjunctive use agreements, together which establish an integrated surface water and groundwater management program for the districts served by YCWA. The Yuba Accord also included a water purchase agreement that creates a long-term water transfer program, under which water can be transferred to the environment and a group of SWP and CVP contractors during drought conditions. This water purchase agreement specified the timing and pricing of YCWA water transfer supplies through In December 2014, YCWA entered into a new agreement with a group of SWP and CVP contractors to stipulate timing and pricing of YCWA water transfer supplies through After YCWA added the FRWP intake as a point of rediversion, BAWSCA conferenced with EBMUD and YCWA. BAWSCA met with YCWA again in May 2014, December 2014, and May 2015 and confirmed continued interest by both parties to continue to partner on a pilot water transfer. A draft Temporary Transfer Petition (TTP) to the State Water Resources Control Board (SWRCB) and associated forms for the pilot water transfer has been prepared and reviewed by YCWA and BAWSCA. A draft water transfer agreement prepared in June 2014 included terms proposed by YCWA for the purchase and delivery of pilot water transfer supplies. In March 2015, YCWA entered into a water transfer agreement with Dublin San Ramon Water Services District (DSRSD). DSRSD proposed to purchase water from YCWA in the spring of 2015, wheel the water through the EBMUD service area, store the water in EBMUD s local reservoirs, and have the water delivered during the late summer and early fall. Because this was the first time that YCWA had entered into a water transfer agreement for water that would travel through the FRWP, the agreement built upon the draft that YCWA and BAWSCA were working from in 2014 and also made some significant progress and changes in terms. YCWA sent the signed YCWA-DSRSD water transfer agreement to BAWSCA for reference in moving forward on a water transfer agreement between YCWA and BAWSCA. In the spring of 2015, YCWA revised the draft TTP for the BAWSCA pilot water transfer to reflect changed conditions in the Yuba Accord over the past year. The progress on the Temporary Transfer Petition puts BAWSCA and YCWA in a good position to submit this paperwork when both parties are ready to sign a water transfer agreement. An overview of the terms of the TTP and the draft water transfer agreement is provide below. Figure 2 shows the dates of key meetings between BAWSCA and YCWA. Overview of Terms of the Temporary Transfer Petition and the Water Transfer Agreement with Yuba County Water Agency The draft TTP and water transfer agreement that BAWSCA and YCWA are currently negotiating contain specific information and terms related to the following elements: Water rights, Timing, Roles and responsibilities for required regulatory approvals and environmental documentation, Cost reimbursement agreements, Notification requirements, 5
212 Phase II Pilot Plan Memorandum BAWSCA, July 2015 The point of delivery, and Other details of implementation. The draft water transfer agreement specifies that YCWA, as the seller of water, is the agency responsible for obtaining regulatory approvals and environmental documentation from the origin of the transfer water to the point of delivery. BAWSCA is responsible for all regulatory approvals and environmental documentation from the point of delivery to the place of use, the BAWSCA service area. In addition, the draft water transfer agreement specifies that BAWSCA must pay a reimbursement cost to YCWA for the work on obtaining regulatory approvals and environmental documentation for the pilot water transfer. As described in the Pilot Plan (EBMUD and BAWSCA 2013), the reimbursement cost is a normal term of a water transfer agreement. The Yuba Accord supplies that YCWA proposes to sell to BAWSCA currently only have an authorized place of use in the service areas of the SWP and CVP. While some BAWSCA member agencies do have rights to use SWP and/or CVP supplies, the SWRCB would need to issue a Temporary Transfer Order (TTO) to temporarily change the place of use of the YCWA transfer supplies to incorporate the entire BAWSCA service area to enable the rest of the member agencies to access the transfer supplies. The draft water transfer agreement contains terms that stipulate that YCWA would submit the TTP to the SWRCB requesting the TTO. Both agencies would have the opportunity to review the TTO before moving forward with a pilot water transfer. The draft water transfer agreement anticipates that the TTP would be valid for up to one year to allow more flexibility in implementing a pilot. In addition, the parties could potentially request this timeframe to start at some point in the future rather than upon submittal of the TTP, further extending the timeframe. Lessons Learned and Outstanding Issues The following list presents a summary of the lessons and outstanding issues for the water transfer agreement: The price of transfer supplies has increased, with asking prices from YCWA as high as $500 per acre-foot during times of extreme drought. Recent changes to the Yuba Accord are requiring additional work by BAWSCA and YCWA to ensure that all BAWSCA member agencies can access transfer supplies. Due to scheduling constraints regarding the availability of YCWA supplies, allowing for a broad window for scheduling delivery of pilot transfers supplies would increase the likelihood of success of a transfer. Under the terms of both the original and recently renegotiated water transfer agreements with SWP and CVP contractors under the Yuba Accord, the price of water transfer supplies would fluctuate depending on the type of water year (i.e., wet or dry) and thus the value of these supplies to potential purchasers. The Pilot Plan (EBMUD and BAWSCA 2013) recognized this variability in price and estimated that the cost of transfer water would range between $75 and $275 per acre-foot, depending on water supply conditions. With the unprecedented drought conditions, prices for transfer water have increased significantly and the recently renegotiated transfer agreement under the Yuba Accord included changes to the price schedule. While the pilot transfer under discussion would not be subject to the new terms, 6
213 Phase II Pilot Plan Memorandum BAWSCA, July 2015 the prices proposed by YCWA in 2014 and 2015 reflect the unprecedented demand for transfer supplies with asking prices from YCWA as high as $500 per acre-foot during times of extreme drought. One other change to the transfer agreements under the Yuba Accord was to specify who had rights to purchase Yuba Accord transfer water during different months of the year. This change specifies that agencies with SWP and CVP rights that participate in the Yuba Accord are only allowed to purchase transfer water from July 1 through September 31, and other agencies would be allowed to purchase during other times of the year when Yuba Accord water was available to transfer. BAWSCA has some member agencies in each of these categories, and thus special arrangements would need to be made for some of the member agencies to receive the Yuba Accord transfer water at any time of the year. This issue still needs to be resolved, but BAWSCA and YCWA are committed to coming up with solutions to facilitate a pilot water transfer to all of the BAWSCA member agencies. Work done during Phase II has identified many potential scheduling constraints regarding the availability of YCWA supplies that add complexity to the transfer. The broader window to schedule supplies afforded by both a one-year TTP and a potentially delayed submittal of the TTP would increase the likelihood of success for a pilot water transfer. The work done during Phase II has put BAWSCA in the position to enter into a water purchase agreement with YCWA when conditions for pilot water transfer implementation are right. EBMUD-BAWSCA Wheeling Agreement In October 2013 EBMUD and BAWSCA began drafting a Scope of Work for Phase II of the Pilot Plan. BAWSCA and EBMUD confirmed in a meeting in November 2013 that both parties intended to continue devoting effort to the implementation of a pilot water transfer. In January 2014 BAWSCA and EBMUD signed a second MOU to implement the Phase II of the Pilot Plan, which has included preparation of the draft wheeling agreement between EBMUD and BAWSCA. Meetings between BAWSCA and EBMUD about key aspects of the wheeling agreement have taken place in Phase II as shown in Figure 3. Overview of Terms of the Draft Wheeling Agreement with EBMUD During the pilot water transfer, EBMUD would transport (or wheel) BAWSCA-purchased transfer water through the EBMUD transmission and water treatment system. A wheeling agreement between BAWSCA and EBMUD is needed to define: The quantity of the transfer, The timing, Notification requirements, Roles and responsibilities for required regulatory approvals and environmental documentation, Cost reimbursement agreements, The point of delivery, and Key operational considerations of the pilot water transfer. EBMUD and BAWSCA drafted a draft wheeling agreement for the Pilot Plan, and the agencies have worked to refine the terms of this agreement during Phase II. A wheeling agreement between EBMUD and DSRSD, signed in March 2015, has informed the EBMUD-BAWSCA wheeling agreement, as EBMUD dedicated significant technical, operational and legal staff resources towards the completion of that 7
214 Phase II Pilot Plan Memorandum BAWSCA, July 2015 agreement with DSRSD. BAWSCA and EBMUD are still in negotiations on the terms of the draft wheeling agreement, but a general description of the terms is provided herein. The draft wheeling agreement includes the following components: Specifies the quantity of transfer water to be wheeled through the EBMUD system for BAWSCA, Details the route that the water will travel through the EBMUD system, Specifies the treatment that the water will receive before delivery to the Hayward Intertie, Names the point of delivery as the Hayward Intertie, Specifies procedures for notification by both parties, and Sets out the terms by which either party can modify, adjust, suspend or terminate the wheeling operations. The draft wheeling agreement also specifies roles and responsibilities of both parties related to the environmental compliance and regulatory approvals needed to complete the pilot water transfer. In addition to specifying which party would be responsible for securing and preparing documentation, the wheeling agreement discusses cost reimbursement for environmental compliance and regulatory approval activities. The estimated costs of wheeling water through the EBMUD system are also included in the draft wheeling agreement. After actual implementation of a pilot water transfer, BAWSCA would be responsible for reimbursing actual costs expended by EBMUD to transfer water to the BAWSCA service area. The wheeling agreement will specify what types of costs are reimbursable by BAWSCA to EBMUD and will specify estimated ranges for these costs. BAWSCA intends to implement the pilot water transfer during a time that EBMUD is already operating the FWRP to deliver their own supplemental supplies, so the significant costs for FWRP startup and shutdown would be shared between the two agencies. Lessons Learned and Outstanding Issues The following list presents a summary of the lessons learned and outstanding issues for the wheeling agreement: The timing of the use of EBMUD s FWRP operations has been variable and not as anticipated during Phase I of the Pilot Plan process. EBMUD water treatment plants need to be upgraded to be able to treat water at a rate to more closely match demands to prevent local reservoirs from filling too quickly. Access to storage would greatly improve the viability of water transfers to BAWSCA, but it is uncertain that BAWSCA could use EBMUD facilities for water storage. The historic drought conditions created difficulty for agencies in getting Warren Act contracts for use of the Folsom South Canal. Access to capacity in EBMUD s system is a serious issue in drought years, as EBMUD may need to use the entire capacity of the FRWP to deliver their own supplies. During the extreme drought conditions, BAWSCA and EBMUD could be competing for the purchase of the same water supplies. The timing of EBMUD s FWRP operations has turned out to be different than originally assumed when putting together the Pilot Plan. The Pilot Plan (EBMUD and BAWSCA 2013) had stated that the FRWP 8
215 Phase II Pilot Plan Memorandum BAWSCA, July 2015 operations would be timed to begin in October of a dry year, with planning beginning in approximately April of the same year, after a water year had been determined to be dry. However, after the Pilot Plan was released, EBMUD realized that the FRWP would need to operate in April every three years, beginning in April 2014, to test the fish screens on the FRWP and meet regulatory compliance obligations. This mandate provides a regular opportunity for FRWP operations and a potential water transfer between EBMUD and BAWSCA. For the mandated testing in April 2014, EBMUD took the opportunity to combine the fish screen testing with the delivery of drought supplies from the CVP and some additional transfer water through the FRWP to the EBMUD service area. EBMUD identified challenges during this initial operation of FRWP that have provided key information for both their future operation and the pilot water transfer. EBMUD is required to treat all water that passes through the FRWP in a conventional water treatment plant. Currently, EBMUD only has two of these facilities, which are located at the EBMUD terminal reservoirs. During EBMUD s spring-summer 2014 operation of FRWP, they experienced some operational difficulty due to the treatment plants abilities to only treat at two specific flow rates. EBMUD found that the local reservoirs where the FRWP supplies must be delivered were filling too fast due to this inflexibility in water treatment rate, thus prompting EBMUD slow down the diversion from the FRWP. EBMUD has proposed upgrading these facilities to add operational flexibility and address this issue. It should be noted that EBMUD did not receive any taste or odor complaints from customers during the period that FRWP water was being delivered. To move water to the EBMUD service area from the FRWP, EBMUD must move Sacramento River water through a portion of the USBR s Folsom South Canal. A Warren Act Contract with the USBR is required to move non-cvp/usbr water through the Folsom South Canal. In 2014 and 2015, EBMUD obtained Warren Act contracts to move non-cvp/usbr transfer water into the EBMUD service area, in addition to EBMUD s CVP contract drought-year supplies. A Warren Act Contract between BAWSCA and the USBR is necessary to implement this pilot water transfer. According to EBMUD, due to the historic drought conditions, the environmental compliance requirements have increased substantially, increasing costs of environmental review and analysis for these contracts. EBMUD and BAWSCA contemplated implementing the pilot water transfer in the spring of 2014, but the timeframe for completing all of the agreements, gaining all of the regulatory approvals, and fulfilling all environmental compliance obligations was too short. At the end of Phase I of the Pilot Plan, BAWSCA and EBMUD forecasted that the Phase II work of working on agreements would take at least six months to one year, or more. On April 15, 2015, EBMUD began operation of the FRWP with the intention of delivering at least 65,000 acre feet of supplemental supplies to the EBMUD service area. EBMUD has declared a Stage IV drought, their most critical category. EBMUD intends to operate the FRWP to deliver their own supplemental supplies through the balance of As they started their FRWP operation, EBMUD informed BAWSCA that it would not have any additional capacity to wheel water for BAWSCA for the rest of calendar year In addition, EBMUD was looking to purchase available supplies north of the delta on the Sacramento River, including any available YCWA supplies. 9
216 Phase II Pilot Plan Memorandum BAWSCA, July 2015 EBMUD and BAWSCA have made much progress during Phase II on a draft wheeling agreement to define the operational and cost reimbursement terms. Issues remaining to be resolved include potential capacity issues, prioritization and availability of supply. Hayward Intertie Pilot Transfer Agreement The Hayward Intertie is a set of pipeline and pump station facilities that connects the water systems of EBMUD and SFPUC in the City of Hayward. Use of the Hayward Intertie is governed by the First Amended Joint Exercise of Powers Agreement Between the City and County of San Francisco Public Utilities Commission, East Bay Municipal Utility District, and City of Hayward for Long Term Operation and Maintenance of the Emergency/Maintenance Water System Intertie Project" (Hayward Intertie Agreement). The three party agreement between EBMUD, SFPUC and Hayward currently only covers the use of the intertie for emergencies and planned outages, thus would need to be amended to enable use of the Hayward Intertie to convey transfer water to BAWSCA for the pilot water transfer. The definition of emergency does not provide for the use of the Hayward Intertie to transfer or exchange water to address water shortages. The proposed action by EBMUD, SFPUC, Hayward, and BAWSCA is to create a new agreement specifically for the pilot water transfer, in addition to the Hayward Intertie Agreement. The meetings to exclusively discuss the Hayward Intertie pilot transfer agreement during Phase II of the Pilot Plan are shown in Figure 4. It should be noted that updates on and discussion about the Hayward Intertie pilot transfer agreement also took place at meetings between BAWSCA and each of the other parties, and those meetings are captured in the other sections of this document. In October 2013, EBMUD, SFPUC and Hayward met to discuss the issues related to the use of the Hayward Intertie for the pilot transfer. During that initial meeting, the three parties agreed to draft principles for an agreement that will allow BAWSCA s use of the Hayward Intertie for the BAWSCA/EBMUD pilot water transfer. EBMUD asked each agency to draft a set of intertie principles that would then be used to construct the Hayward Intertie pilot transfer agreement. In early January 2014, EBMUD and SFPUC compiled their principles and sent them to BAWSCA. BAWSCA compiled additional principles and transmitted them to the group in mid-january. Hayward compiled additional principles in early February 2014 and sent them to the group. At the first meeting between all four parties on March 3, 2014, the group discussed the full set of intertie principles drafted by all parties and agreed to modifying and consolidating some of the principles. During this meeting, EBMUD agreed to use the principles to prepare a three-party intertie agreement specifically to authorize and conduct the pilot water transfer. The parties also agreed that the intertie agreement would be between EBMUD, SFPUC and Hayward and would reference the other agreements that BAWSCA had with EBMUD, SFPUC, and Hayward. In addition, the parties agreed that an operations plan for the intertie would need to be developed for the pilot water transfer. Subsequent meetings focused mainly on operational aspects of the Hayward Intertie pilot transfer agreement and included mostly operational staff from the agencies. The meetings of the four parties also included some discussion of the California Environmental Quality Act (CEQA) compliance. A full summary of the CEQA discussions is provided below in the Regulatory Agency Approvals and Environmental Compliance section. 10
217 Phase II Pilot Plan Memorandum BAWSCA, July 2015 EBMUD has stated that the Hayward Intertie pilot transfer agreement will be completed after all the other agreements that BAWSCA has to complete with EBMUD, SFPUC and Hayward are completed. The Hayward Intertie pilot transfer agreement will reference each of these agreements and also contain the revised intertie operations plan. Overview of Terms of the Draft Hayward Intertie Pilot Transfer Agreement The Hayward Intertie Operating Agreement specifies the following terms: Limits the use of the Hayward Intertie to emergency situations and planned outages, Prohibits use of the Hayward Intertie to supply water during drought conditions, Defines the roles and responsibilities of each party, Specifies cost share allocations and ownership of the facilities between SFPUC and EBMUD, and Governs the operations and maintenance of the Hayward Intertie. The draft Hayward Intertie pilot transfer agreement will be written to allow a one-time use of the Hayward Intertie for delivering the pilot transfer water, and includes the following list of selected principles: SFPUC, EBMUD, and Hayward shall remain the sole parties in the intertie operating agreement (JPA) and the terms and conditions of JPA shall remain in full force and effect notwithstanding the project specific stand-alone agreement. The project specific stand-alone operating agreement shall be limited to the proposed pilot transfer for a limited duration and for purposes of the pilot only. The project specific pilot transfer operating plan (or agreement) should be prepared and outline the roles and responsibilities of the partners who will operate, including the chain of command and authorities. The Hayward Intertie pilot transfer agreement will reflect these and the other terms as agreed to by the three parties to the Hayward Intertie. Lessons Learned and Outstanding Issues The following list presents a summary of the lessons and outstanding issues for the Hayward Intertie pilot transfer agreement: Because BAWSCA is not a party to the Hayward Intertie Agreement, BAWSCA will not be a party to the Hayward Intertie pilot transfer agreement. The Hayward Intertie facilities receives regular maintenance to be able to be used in an emergency, but requires several days to prepare for use, once an emergency occurs. Flushing of the intertie pipeline prior to the pilot may be needed to scour sediments that have settled in the little-used portions of the pipe. The intertie facilities may require an upgrade to facilitate flushing of sediments prior to the pilot water transfer. The need for flushing may be able to be avoided if scouring velocities in the pipeline are not reached. This could be achieved by slowing ramping up flows during the pilot water transfer operation, but the maximum flow velocity could result in scour. 11
218 Phase II Pilot Plan Memorandum BAWSCA, July 2015 Cost for flushing and reimbursement parameters for flushing are still under discussion by the parties. Discussions about use of the Hayward Intertie for the pilot water transfer have spurred conversations about the adequacy of the current maintenance plan for the intertie. Prior to Phase II of the Pilot Plan, it was unclear whether BAWSCA would be a party to the Hayward Intertie pilot transfer agreement. Because BAWSCA is not a party to the existing Hayward Intertie Agreement, and BAWSCA does not own or operate the Hayward Intertie, it was decided that the Hayward Intertie pilot transfer agreement should not include BAWSCA. Instead, the Hayward Intertie pilot transfer agreement will reference the other agreements that will govern the implementation of the pilot water transfer that BAWSCA will have with the owners and operators of the Hayward Intertie. Many of the discussions regarding the use of the Hayward intertie for the pilot water transfer have focused on the state of the Hayward Intertie facilities when not in use and the potential need for flushing the intertie pipelines that connect EBMUD and Hayward. Discussions about flushing the intertie pipeline, located in the northern part of Hayward, have been ongoing throughout Phase I and Phase II of the Pilot Plan process. During Phase II, technical staff from the agencies that own and operate the intertie engaged in dialogue about the potential need for flushing prior to the pilot water transfer, how that flushing could occur, how to operate the intertie during the pilot water transfer in a manner that would potentially avoid the need for flushing, potential infrastructure changes needed on the intertie pipeline to facilitate proper flushing, how much of the pipeline would need flushing, and potential changes to regular maintenance of the intertie. Technical staff involved in the discussions included the staff at Hayward that is responsible for operating the intertie and the EBMUD and SFPUC operational staff who have experience with previous uses of the intertie. The water in the large, 42-inch intertie pipeline currently only has a small amount of flow in it traveling at a low velocity, which allows for settling of any sediments to the bottom of the pipe. When the pilot water transfer occurs, the flow in the pipe would be increased to a level such that scouring could occur along the pipes edges, loosening any sediments that have accumulated along the bottom of the pipe. These sediments could then be suspended in the water delivered to water customers in Hayward. To prevent sediments from being introduced into the water delivered to Hayward s water customers, a couple of strategies have been suggested. The first strategy, and the solution originally preferred by Hayward, is to flush the intertie pipelines prior to the water transfer. The second strategy would be to run the pilot water transfer at a flow that would be small enough to not scour the walls of the pipelines and avoid loosening any sediments deposited on the edges. To do this, the operators would need to (1) slowly ramp up the flow rate in the intertie pipeline and (2) keep the flow rate low enough that the sediments would not become suspended into the flow. Operators have expressed some concerns about the ramp-up method, citing that the flow necessary to meet the demands in Hayward during the pilot water transfer could necessitate a flow rate in the intertie pipeline that is high enough to suspend sediments that are in the bottom of the pipe. If flushing is to occur prior to the pilot water transfer, Hayward staff has pointed out that the current design of the intertie pipeline does not allow for adequate draining of water from the pipe to achieve the desired scour and flushing of sediments from the pipe. Hayward staff has suggested some infrastructure improvements to the pipe to accommodate the flushing. In addition, Hayward staff has 12
219 Phase II Pilot Plan Memorandum BAWSCA, July 2015 also designed a plan to discharge the flushing water into a creek that drains to the San Francisco Bay, to avoid any flooding of the Hayward stormwater discharge system. A prior attempt to flush the intertie pipeline resulted in flooding in Hayward that should be avoided in the future. During Phase II of the Pilot Plan, BAWSCA and the other pilot water transfer partners have been investigating the costs of flushing the intertie pipeline including the cost of the water that would be flushed into the Bay, the cost of labor to perform the flushing, the cost of the electricity for pumping, and any costs associated with upgraded infrastructure for flushing and related discharge into a creek. BAWSCA has been working with the other parties to both correctly determine the costs of flushing and also to determine who should be responsible for paying the costs for flushing and intertie pipeline infrastructure upgrades. These flushing-related costs and responsibilities for reimbursement are still under discussion by the parties at this time. During Phase II, BAWSCA has gained much understanding of how the Hayward Intertie functions and how it is maintained. As the owners of the intertie, EBMUD and SFPUC pay to maintain the intertie on an annual basis, according to the current agreement and maintenance plan. As the operator of the intertie, Hayward performs the maintenance activities, as required, and is then reimbursed by EBMUD and SFPUC. The intertie operations discussion that has occurred as a part of Phase II has been beneficial in identifying potential areas of improvement in the annual maintenance of the intertie. EBMUD, SFPUC and Hayward are currently in discussion about what changes in maintenance could be done on the intertie to assure that it is ready in the event there is an emergency. These changes would also likely benefit the planned operation of the intertie for the pilot water transfer. BAWSCA - Hayward Pilot Transfer Agreement BAWSCA and Hayward will enter into a cost allocation and operations agreement to conduct the pilot water transfer that specifies the terms of the use of Hayward s facilities, the operation of those facilities and the associated cost reimbursement during the pilot. BAWSCA has been meeting with Hayward throughout Phase II of the Pilot Plan to discuss these terms. A list of meetings between BAWSCA and Hayward during Phase II is presented in Figure 5. Early in the Phase II process, Hayward expressed their major concerns to BAWSCA about the pilot water transfer, including: Pilot water transfer water will be of a different quality than the San Francisco Regional Water System supplies that Hayward normally receives during certain times of year. o Concerns related to customer complaints and public relations issues about this different water quality for both residential and commercial customers. Hayward will rely solely on pumped water during the pilot water transfer, which is different than the normal case of water being delivered almost completely by gravity. o Concerns related to costs to keep water pressures up in Hayward during the pilot water transfer. o Concerns related to Hayward water system pressures being different than usual. Liability issues in the event that something happens during the pilot water transfer. The potential that additional environmental documentation could be required to use the intertie to execute a pilot water transfer. 13
220 Phase II Pilot Plan Memorandum BAWSCA, July 2015 BAWSCA has taken steps to address each of these concerns with Hayward. To review these issues, and others, BAWSCA and Hayward drafted a cooperative agreement in June 2014 to examine issues of concern related to the pilot water transfer. BAWSCA and Hayward formally signed the Cooperative Agreement between Hayward and BAWSCA for Preliminary Planning and Analysis for Development of a Short-Term Pilot Water Transfer Plan (Cooperative Agreement) in February To examine potential water quality issues related to the pilot water transfer water, BAWSCA worked with EBMUD to identify the anticipated water quality of the supply delivered through the Hayward Intertie during the pilot water transfer. The water quality has been found to be very similar to the supplies from the SFPUC local reservoirs, which (1) is delivered to BAWSCA member agencies periodically throughout any given year and (2) meets all water quality regulatory guidelines. As stated in the Cooperative Agreement, BAWSCA is committed to helping Hayward identify and assess the impacts of water quality changes on the Hayward water customers, particularly the industrial sector. The Cooperative Agreement also specifies that BAWSCA and Hayward will work together on a public communications plan. This public communications plan will establish effective communications to Hayward s residential, commercial, and industrial water customers regarding the use of the Hayward Intertie and potential changes in water quality, including potential impacts and benefits to all Hayward water customers. In regards to the concerns about impacts to Hayward s water system operations during the pilot water transfer, including potential changes to the existing water pressures and resultant fire flow capacity in Hayward, BAWSCA and Hayward have partnered on an investigation of hydraulic pressures in the Hayward system during the pilot water transfer. The goal of this analysis is to identify areas in the water system that could be vulnerable to lower pressures and that might need to be monitored during the pilot water transfer. Hayward s consultant, West Yost and Associates, finished their preliminary analysis in April of 2015 and Hayward and BAWSCA are still reviewing the results. In regards to Hayward s concern that potential additional environmental compliance documentation could be required to use the Hayward Intertie for the pilot water transfer, BAWSCA and EBMUD organized meetings and distributed information about the California Environmental Quality Act (CEQA) compliance for the pilot water transfer and the relationship with the Hayward Intertie Operating Agreement. Further description of the CEQA discussions and activities during Phase II is provided below in the Environmental Compliance and Regulatory Approvals section. Lessons Learned and Outstanding Issues A key lesson learned in the process of developing an understanding of the implementation of water transfers is that sometimes the process unfolds slowly. In June 2014, BAWSCA started engaging Hayward in weekly meetings to increase the frequency of the discussions and allow the time for getting all of the issues identified and fully discussed. Entering into the Cooperative Agreement has focused the discussions between BAWSCA and Hayward and has highlighted the areas that need to be worked through prior to the implementation of a pilot water transfer that involves Hayward. Early on, BAWSCA and Hayward came to agreement on the operational costs during the pilot water transfer that BAWSCA will reimburse Hayward for after the pilot water transfer has been implemented. However, BAWSCA and Hayward have spent time in over 10 different in-person meetings discussing the potential terms of wheeling cost reimbursement and are currently still in discussion on these terms for 14
221 Phase II Pilot Plan Memorandum BAWSCA, July 2015 implementation of the pilot. BAWSCA and Hayward are continuing to work on this issue to come to agreement on acceptable terms for both parties. BAWSCA - SFPUC Pilot Transfer Agreement To execute the pilot water transfer, BAWSCA and the SFPUC need an agreement in place to specify how costs will be allocated under the 2009 Water Supply Agreement (WSA) between San Francisco and the Wholesale Customers. The WSA provides for a detailed cost allocation methodology whereby all costs of the SFRWS are allocated between the San Francisco Retail Customers and the Wholesale Customers, primarily based on proportionate annual water use. Because the pilot water transfer will introduce new water into the SFRWS, an agreement needs to be put in place to specify how this water will be treated with respect to the WSA. Meetings between BAWSCA and SFPUC about key aspects of the BAWSCA SFPUC pilot transfer agreement have taken place in Phase II as shown in Figure 6. In person meetings between the SFPUC and BAWSCA have been few, as the staff for both agencies came to agreement on most of the terms quickly. Overview of Terms of the Draft BAWSCA - SFPUC Pilot Transfer Agreement The draft BAWSCA-SFPUC pilot transfer agreement formalizes: The allocation of SFRWS costs, Outlines notification procedures, Specifies the water accounting procedures in the case of both voluntary water use reductions and mandatory water use reduction on the SFRWS, and Identifies the responsibilities of each agency. SFPUC and BAWSCA have agreed that during voluntary water use reductions declared by the SFPUC, the transfer water would be considered SFRWS water and would be considered part of the total volume of water delivered to the Wholesale Customers in a year. During mandatory water use reductions declared by the SFPUC, the share of pilot transfer water allocated to each Wholesale Customer would be added to each Wholesale Customers monthly budgets. During the month of the pilot water transfer, the transfer water would be the first water used by each Wholesale Customer for the purposes of water accounting as described in the WSA. BAWSCA would provide to the SFPUC the allocated amounts of transfer water that will be delivered to each Wholesale Customer during the pilot water transfer. The Wholesale Customers would be billed, as usual, for the total SFRWS water that was used during that month, including the pilot transfer supplies. BAWSCA staff have proposed to split pilot transfer supplemental supplies and costs among all of the member agencies in proportion to the water each agency used during that time. The J Table from the WSA that is used to calculate total water used in the SFRWS for each year would include the transfer supplies for the year in which the pilot water transfer occurred. The transfer supplies would be included in the calculation of the Wholesale Revenue Requirement, as well. The draft BAWSCA-SFPUC pilot transfer agreement contains examples of how both the J Table and the Wholesale Revenue Requirement would be calculated during the pilot water transfer. 15
222 Phase II Pilot Plan Memorandum BAWSCA, July 2015 Lessons Learned and Outstanding Issues BAWSCA and SFPUC were able to come to agreement on most of the terms related to the pilot water transfer after only a couple of meetings. Both the SFPUC and BAWSCA were committed to resolving the details of accounting and cost allocation for both voluntary and mandatory water use reduction scenarios. Further work would need to be done to implement a pilot water transfer when the SFRWS was not in a water use reduction condition. In addition, BAWSCA will continue the discussion of water storage with San Francisco, for potential longer term water transfer agreements. Regulatory Agency Approvals and Environmental Compliance As presented in Table 1 and described throughout this memorandum, BAWSCA will need to (1) obtain several regulatory agency approvals to implement the pilot water transfer, and (2) ensure that the proper environmental compliance analysis and documentation is submitted. The Pilot Plan (EBMUD and BAWSCA 2013) provides a very detailed explanation of each of the following. Regulatory Agency Approvals State Water Resources Control Board The SWRCB will need to issue a Temporary Transfer Order (TTO) to add portions of the BAWSCA service area to the authorized place of use for YCWA transfer supplies. BAWSCA has worked with YCWA to draft the required documentation for the Temporary Transfer Petition (TTP) to the SWRCB. Typically, the TTP would be submitted when a water transfer was being scheduled. BAWSCA and YCWA may submit the TTP prior to the scheduling of the pilot water transfer, asking the SWRCB to approve the TTP for some time in the future, when the pilot transfer would be more likely to occur. BAWSCA and YCWA intend to ask that the SWRCB issue a TTO that is valid for up to one year to provide a flexible window for implementation of the pilot water transfer. The SWRCB Division of Drinking Water (DDW) also needs to issue a permit that allows the conveyance path of the source water to be changed and allow the source water to be used in a different area. The CVP supplies diverted at FRWP are approved for use in EBMUD s service area through a permit from the DDW. For any other transfer water that EBMUD purchases, EBMUD needs to obtain a DDW permit for use of that source water in the EBMUD service area. Discussions during Phase II indicate that the language in a DDW permit issued to EBMUD could be broad enough to cover BAWSCA s transfer, as well. Bureau of Reclamation Use of the FRWP to convey any non-cvp transfer water from the Sacramento River Valley through EBMUD facilities and USBR s Folsom South Canal to the BAWSCA service area will require a Warren Act contract. The USBR enters into Warren Act contracts when entities desire to use CVP facilities to transfer non-cvp water. The USBR must also perform or approve National Environmental Policy Act (NEPA) analysis to support these contracts. Throughout Phase II of the Pilot Plan, BAWSCA and EBMUD had ongoing discussions about the process of obtaining a Warren Act contract to move YCWA supplies into the BAWSCA service area. In 2014 and 2015, EBMUD obtained Warren Act contracts to move transfer water into the EBMUD service area, in addition to EBMUD s CVP contract drought-year supplies. According to EBMUD, due to the historic drought conditions, the environmental compliance requirements have increased substantially, increasing costs of environmental review and analysis. 16
223 Phase II Pilot Plan Memorandum BAWSCA, July 2015 Because EBMUD has an existing relationship with the USBR through their CVP contract, EBMUD has been the sole point of contact to the USBR about the pilot water transfer during Phase II. BAWSCA intends to engage directly with the USBR once the pilot water transfer is scheduled for implementation to pursue the Warren Act contract or start NEPA documentation. Environmental Compliance State Resource Laws The California Environmental Quality Act (CEQA) is a statute that requires state and local agencies to identify and analyze the significant environmental impacts of their actions and to avoid or mitigate those impacts, if feasible. A public agency must comply with CEQA when it undertakes a project. A project is a discretionary activity undertaken by the public agency, which may cause either a direct physical change in the environment or a reasonably foreseeable indirect change in the environment. A public agency is required to comply with CEQA to complete a water transfer, but a temporary one-year water transfer involving post-1914 surface water rights is exempt from this requirement. CEQA compliance strategies have been discussed by BAWSCA and the other parties throughout the Phase II process. At the first meeting of the four parties to discuss the Hayward Intertie pilot transfer agreement on March 3, 2014, the parties first discussed together the strategy for CEQA compliance. The Pilot Plan (EBMUD and BAWSCA 2013) presented a list of potential exemptions that could be used for implementation of the pilot water transfer. In particular, Water Code Section 1729 provides that temporary changes in the point of diversion, place of use, or purpose of use due to a transfer or exchange of water or water rights pursuant to Water Code Section 1725 are exempt from the requirements of CEQA. There are also other reasons that the pilot water transfer would be exempt from environmental review under CEQA. The four parties discussed these exemptions on March 3, 2014, and BAWSCA agreed to perform further research into which exemptions would be the most applicable and then share the findings with the group. Subsequently, BAWSCA sent out an to all of the parties in June 2014 listing the most applicable exemptions for the pilot water transfer. On November 21, 2014, BAWSCA convened a conference call of all of the parties and associated legal counsel to discuss these exemptions and the strategy for implementation. The parties are poised to move forward when the pilot water transfer is implemented. Federal Resource Laws The pilot water transfer must also comply with federal resource laws, including National Environmental Policy Act (NEPA) and the Endangered Species Act (ESA). NEPA environmental review and analysis is required to obtain a Warren Act Contract from the USBR as described above. Some consultation with other resource agencies may need to occur to comply with the Endangered Species Act. BAWSCA and EBMUD have had discussions about NEPA compliance throughout Phase II. Due to the historic drought conditions, NEPA and ESA compliance have required additional effort. Summary and Conclusions BAWSCA has learned a considerable amount about the implementation of water transfers during Phase II process. The conclusions from Phase II are the following: 17
224 Phase II Pilot Plan Memorandum BAWSCA, July 2015 The timing of the use of EBMUD s Freeport Regional Water Project (FRWP) operations is not as predictable as thought during Phase I of the Pilot Plan. Access to capacity is a serious issue in drought years, as EBMUD may need to use the entire capacity of the FRWP to deliver their own supplies. During the extreme drought conditions, sellers may have less supply to sell, increasing the competition for purchase of transfer water and increasing the price of transfer water. Transfer water is only available at certain times of the year, and the availability of transfer water changes with type of water year (i.e., wet or dry), adding complexity to scheduling a water transfer to BAWSCA. Access to storage would greatly improve the viability of water transfers to BAWSCA. The historic drought conditions created difficulty for agencies in getting Warren Act contracts for use of the Folsom South Canal and have increased the requirements for both state and federal environmental compliance analysis. Improving the regular maintenance of Hayward Intertie and upgrading the intertie infrastructure for emergency use would provide benefits for a water transfer program. BAWSCA and Hayward agree that both parties would benefit from the information gained during implementation of a pilot water transfer. Negotiations between BAWSCA and Hayward about the pilot water transfer have proceeded slower than were anticipated at the outset of Phase II. Hayward has significant concerns about a pilot water transfer that are currently being investigated by Hayward and BAWSCA. BAWSCA and SFPUC have developed a framework for accounting for water supply within the SFRWS that BAWSCA obtains independent of the SFPUC. BAWSCA is continuing to pursue a pilot water transfer with EBMUD for implementation in spring 2016, at the earliest. BAWSCA has also been continuing discussions with the Santa Clara Valley Water District (SCVWD) on pursuing a pilot water transfer. In July 2014, BAWSCA and SCVWD finalized the Memorandum of Understanding Agreement A3754M between the Santa Clara Valley Water District and the Bay Area Water Supply and Conservation Agency, which lays out the tasks, roles, and responsibilities for the development of a short-term pilot water transfer plan. This plan would provide vital information on partnering for future long-term and/or dry year transfers. Staffing issues at SCVWD have delayed the progress of the work on a pilot water transfer between BAWSCA and SCVWD. However, BAWSCA has been checking in regularly with SCVWD staff so that both parties can remain updated as to the status. In particular, BAWSCA has been in discussion about options for storing transfer water in the SCVWD groundwater aquifers, for use at a later date. BAWSCA has also been meeting with Contra Costa Water District about the potential for partnering with them on water transfers and storage in Los Vaqueros Reservoir. Lastly, BAWSCA has been meeting with ACWD to discuss potential water transfers, water storage, and water exchange concepts that would take advantage of ACWD s existing facilities and its access to Delta supplies through the South Bay Aqueduct. 18
225 Phase II Pilot Plan Memorandum BAWSCA, July 2015 References BAWSCA, Long-Term Reliable Water Supply Strategy Phase II A Final Report, July EBMUD and BAWSCA, BAWSCA-EBMUD Short-Term Pilot Water Transfer Plan, September

226 Phase II Pilot Plan Memorandum BAWSCA, July 2015 Figure 1. Map Showing the Existing Infrastructure that to Support a Pilot Water Transfer and the Direction of the Water Movement through EBMUD s System. 20
227 Phase II Pilot Plan Memorandum BAWSCA, July 2015 YCWA / EBMUD Wed 12/4/13 YCWA / EBMUD Wed 5/28/14 YCWA Wed 12/3/14 Start Wed 12/4/13 Finish Thu 5/7/15 YCWA / EBMUD Wed 3/26/14 YCWA / EBMUD Wed 12/3/14 YCWA / EBMUD Thu 5/7/15 Figure 2. BAWSCA Meetings with YCWA and YCWA and EBMUD during Phase II of the Pilot Plan. 21
228 Phase II Pilot Plan Memorandum BAWSCA, July 2015 EBMUD / Wheeling Agreement Tue 1/7/14 EBMUD / Wheeling Agreement Tue 8/5/14 EBMUD / Wheeling Agreement Mon 10/21/13 EBMUD / Wheeling Agreement Tue 1/21/14 Tour of Freeport Tue 4/15/14 EBMUD / Wheeling Agreement Tue 7/8/14 EBMUD / Wheeling Agreement Mon 12/22/14 EBMUD / Wheeling Agreement Wed 4/15/15 Start Mon 10/21/13 Finish Wed 4/15/15 EBMUD / Wheeling Agreement Tue 11/19/13 EBMUD / Wheeling Agreement Mon 1/13/14 EBMUD / Wheeling Agreement Wed 5/14/14 EBMUD / Wheeling Agreement Thu 7/10/14 EBMUD / Wheeling Agreement Fri 11/21/14 EBMUD / Wheeling Agreement Wed 3/25/15 EBMUD / Wheeling Agreement Wed 1/29/14 Figure 3. Meetings on the EBMUD-BAWSCA Wheeling Agreement during Phase II of the Pilot Plan. 22
229 Phase II Pilot Plan Memorandum BAWSCA, July 2015 EBMUD / SFPUC / Hayward - Intertie Agreement and Ops Thu 10/24/13 All / Intertie Ops Thu 4/3/14 All / Intertie Ops Wed 11/12/14 Start Thu 10/24/13 All / Intertie Agreement Mon 3/3/14 BAWSCA / SFPUC - Intertie Ops Tue 10/14/14 Finish Wed 11/12/14 Figure 4. Meetings on the Hayward Intertie Agreement and Operations Plan during Phase II of the Pilot Plan. 23
230 Phase II Pilot Plan Memorandum BAWSCA, July 2015 Hayward Thu 7/24/14 Hayward Thu 7/10/14 Hayward Tue 9/23/14 Hayward Mon 12/8/14 Hayward Mon 10/28/13 Hayward Thu 1/9/14 Hayward Thu 4/17/14 Hayward Tue 6/24/14 Hayward Mon 8/18/14 Hayward Mon 10/27/14 Hayward Mon 1/12/15 Hayward Mon 4/20/15 Start Mon 10/28/13 Finish Wed 7/8/15 Hayward Wed 11/13/13 Hayward Thu 2/6/14 Hayward Thu 5/8/14 Hayward Wed 7/2/14 Hayward Thu 9/4/14 Hayward Fri 11/7/14 Hayward Mon 1/12/15 Hayward Wed 7/8/15 Hayward Fri 7/18/14 Hayward Thu 8/7/14 Hayward Tue 10/14/14 Hayward Fri 12/19/14 Hayward Fri 1/30/15 Figure 5. Meetings between BAWSCA and Hayward during Phase II of the Pilot Plan. 24
231 Phase II Pilot Plan Memorandum BAWSCA, July 2015 SFPUC Mon 12/9/13 SFPUC Fri 2/28/14 Start Mon 12/9/13 Finish Mon 3/31/14 SFPUC Thu 1/23/14 SFPUC Mon 3/31/14 Figure 6. Meetings between BAWSCA and SFPUC on the BAWSCA-SFPUC Agreement during Phase II of the Pilot Plan. 25
232
233 Appendix I SFPUC Deliveries and Reduction Targets (January 2014 to April 2017)
234
235 Weekly Water Deliveries Total System Deliveries Calendar Years: Source: Regional Water System Meters, Weekly Delivery Report Data Compiled by: SFPUC, Hydrology and Water Systems Group Data Copied on: 6/2/2017 SFPUC Regional Water System: Total System Deliveries on Weekly Basis [MGD] Report # Dates of Weekly Report Jan Jan Jan Jan Jan 29 Feb Feb Feb Feb Feb 26 Mar Mar Mar Mar Mar Apr Apr Apr Apr Apr 29 May May May May May 27 Jun Jun Jun Jun Jun July July July July July 29 Aug Aug Aug Aug Aug 26 Sept Sept Sept Sept
236 39 Sept Sep 30 Oct Oct Oct Oct Oct 28 Nov Nov Nov Nov Nov 25 Dec Dec Dec Dec Dec
237 Weekly Water Savings Total System Deliveries Calendar Years: Source: Regional Water System Meters, Weekly Delivery Report Data Compiled by: SFPUC, Hydrology and Water Systems Group Data Copied on: 6/2/2017 Target legend: 1st 10% Voluntary Reduction Period SWRCB Mandatory Reduction Period 2nd 10% Voluntary Reduction Period Also Note: 2013 Baseline Based on: 2013 Baseline: Total Usage based on Purchase Projections for FY13 14 (232 MGD Baseline, which includes CCWD Usage*) 2013 Baseline: Total Usage based on 2013 Deliveries per Delivery Report (226 MGD Baseline, which includes CCWD Usage*) 2013 Baseline: Total Usage based on 2013 Deliveries per Delivery Report (226 MGD Baseline, which includes CCWD Usage*) *RWS Delivery Report Data does not include CCWD usage in the Total Delivery values. Target Delivery values below are adjusted from 2013 Baselines to not include CCWD Usage either when considering target values. Target Delivery trends were developed from smoothed 2013 Baseline trends minus CCWD Usage. Report # Target Delivery (10% Voluntary Reduction) (MGD) SFPUC Regional Water System: Total System Delivery Targets and Cumulative Water Savings on Weekly Basis (Per Year) Cumulative Target Savings (MG) Cumulative Actual Savings (MG) Target Delivery (10% Voluntary Reduction then SWRCB Mandatory Reduction) (MGD) Cumulative Target Savings (MG) Cumulative Actual Savings (MG) Target Delivery (SWRCB Mandatory Reduction then 10% Voluntary Reduction) (MGD) Cumulative Target Savings (MG) Cumulative Actual Savings (MG) Target Delivery (10% Voluntary Reduction) (MGD) Cumulative Target Savings (MG) Cumulative Actual Savings (MG) Dates of Weekly Report 1 Jan Jan Jan Jan Jan 29 Feb Feb , ,028 7 Feb , ,282 8 Feb , ,543 9 Feb 26 Mar , , Mar , , Mar , , Mar ,109 2, , Mar ,244 2, , Apr ,276 2, ,010 2, Apr , ,430 3, Apr ,178 1, ,625 3, Apr , ,334 1, ,943 3, Apr 29 May , ,513 1, ,401 4, May , ,716 2, ,705 4, May , ,945 2, ,962 5, May , ,180 3, ,283 5, May 27 Jun , ,439 3, ,546 6, Jun ,379 1, ,794 4, ,756 6, Jun ,648 1, ,130 4, ,936 6, Jun ,919 1, ,540 5, ,184 7, Jun ,193 1, ,908 5, ,387 7, July ,468 2, ,278 6, ,591 7,803
238 Report # Dates of Weekly Report Target Delivery (10% Voluntary Reduction) (MGD) SFPUC Regional Water System: Total System Delivery Targets and Cumulative Water Savings on Weekly Basis (Per Year) Cumulative Target Savings (MG) Cumulative Actual Savings (MG) Target Delivery (10% Voluntary Reduction then SWRCB Mandatory Reduction) (MGD) Cumulative Target Savings (MG) Cumulative Actual Savings (MG) Target Delivery (SWRCB Mandatory Reduction then 10% Voluntary Reduction) (MGD) Cumulative Target Savings (MG) Cumulative Actual Savings (MG) 28 July ,745 2, ,657 7, ,802 8, July ,022 3, ,014 7, ,992 8, July ,300 3, ,377 8, ,185 8, July 29 Aug ,579 3, ,731 8, ,370 9, Aug ,857 4, ,990 9, ,459 9, Aug ,135 4, ,374 9, ,673 9, Aug ,411 5, ,726 10, ,859 10, Aug 26 Sept ,684 5, ,045 10, ,013 10, Sept ,953 6, ,407 10, ,215 10, Sept ,217 6, ,770 11, ,423 11, Sept ,455 6, ,157 11, ,661 11, Sept ,686 7, ,487 12, ,851 11, Sep 30 Oct ,891 7, ,889 12, ,128 12, Oct ,071 7, ,284 12, ,413 12, Oct ,228 8, ,634 13, ,675 12, Oct ,364 8, ,935 13, ,914 13, Oct 28 Nov ,479 8, ,199 13, ,144 13, Nov ,577 8, ,506 14, ,438 13, Nov ,657 8, ,734 14, ,671 14, Nov ,723 8, ,821 14, ,775 14, Nov 25 Dec ,788 8, ,866 15, ,841 14, Dec ,853 8, ,935 15, ,931 14, Dec ,917 9, ,954 15, ,971 15, Dec ,982 9, ,022 15, ,061 15, Dec ,065 9, ,032 16, ,099 15,675 Target Delivery (10% Voluntary Reduction) (MGD) Cumulative Target Savings (MG) Cumulative Actual Savings (MG)
239 Appendix J SWRCB Water Supplier Reporting Data (April 2017)
240
241 April 2017 SWRCB Water Supplier Reporting Data BAWSCA Agencies DRAFT FOR INTERNAL USE ONLY Supplier Name Reporting Month State mandated Conservation Standard (Jun 2015 Mar 2017) *Adjusted Mar 16 *Revised Jun 16 *Tentative Mar 17 *Rescinded Apr 17 CALCULATED Total Monthly Potable Water Production Reporting Month Gallons (Values calculated by Water Board staff. REPORTED Total Monthly Potable Water Production Reporting Month REPORTED Monthly Ag Use Reporting Month; converted to gallons.) CALCULATED Total Monthly Potable Water Production 2013 Gallons (Values calculated by Water Board staff. REPORTED Total Monthly Potable Water Production 2013 REPORTED Monthly Ag Use 2013; converted to gallons.) CALCULATED R GPCD Reporting Month (Values calculated by Water Board staff using methodology available at aterrights/water_issues/programs/ drought/docs/ws_tools/guidance_ estimate_res_gpcd.pdf) Coastside County Water District Apr 17 0% 41,330,000 62,550, Coastside County Water District Mar 17 0% 44,220,000 48,380, Coastside County Water District Feb 17 0% 28,400,000 45,630, Coastside County Water District Jan 17 0% 35,550,000 40,510, Coastside County Water District Dec 16 0% 43,780,000 55,880, Coastside County Water District Nov 16 0% 38,970,000 57,990, Coastside County Water District Oct 16 0% 59,290,000 68,720, Coastside County Water District Sep 16 0% 57,670,000 66,040, Coastside County Water District Aug 16 0% 68,970,000 84,560, Coastside County Water District Jul 16 0% 61,240,000 75,610, Coastside County Water District Jun 16 0% 67,230,000 69,550, Coastside County Water District May 16 8% 64,530,000 83,280, Coastside County Water District Apr 16 8% 43,580,000 62,550, Coastside County Water District Mar 16 8% 39,200,000 48,380, Coastside County Water District Feb 16 8% 38,379,310 45,630, Coastside County Water District Jan 16 8% 37,940,000 40,510, Coastside County Water District Dec 15 8% 38,180,000 55,880, Coastside County Water District Nov 15 8% 41,240,000 57,990, Coastside County Water District Oct 15 8% 56,600,000 68,720, Coastside County Water District Sep 15 8% 59,070,000 66,040, Coastside County Water District Aug 15 8% 62,000,000 84,560, Coastside County Water District Jul 15 8% 57,330,000 75,610, Coastside County Water District Jun 15 8% 56,870,000 69,550, Coastside County Water District May 15 NULL 44,190,000 56,000, Coastside County Water District Apr 15 NULL 48,880,000 62,550, Coastside County Water District Mar 15 NULL 48,890,000 48,380, Coastside County Water District Feb 15 NULL 50,330,000 45,630, Coastside County Water District Jan 15 NULL 53,780,000 40,510, Coastside County Water District Dec 14 NULL 39,110,000 51,100, Coastside County Water District Nov 14 NULL 46,370,000 57,990, Coastside County Water District Oct 14 NULL 57,130,000 68,720, Coastside County Water District Sep 14 NULL 60,230,000 71,880, Coastside County Water District Aug 14 NULL 74,890,000 84,560, Coastside County Water District Jul 14 NULL 74,760,000 75,610,
242 April 2017 SWRCB Water Supplier Reporting Data BAWSCA Agencies DRAFT FOR INTERNAL USE ONLY Supplier Name Reporting Month State mandated Conservation Standard (Jun 2015 Mar 2017) *Adjusted Mar 16 *Revised Jun 16 *Tentative Mar 17 *Rescinded Apr 17 CALCULATED Total Monthly Potable Water Production Reporting Month Gallons (Values calculated by Water Board staff. REPORTED Total Monthly Potable Water Production Reporting Month REPORTED Monthly Ag Use Reporting Month; converted to gallons.) CALCULATED Total Monthly Potable Water Production 2013 Gallons (Values calculated by Water Board staff. REPORTED Total Monthly Potable Water Production 2013 REPORTED Monthly Ag Use 2013; converted to gallons.) CALCULATED R GPCD Reporting Month (Values calculated by Water Board staff using methodology available at aterrights/water_issues/programs/ drought/docs/ws_tools/guidance_ estimate_res_gpcd.pdf) Coastside County Water District Jun 14 NULL 67,830,000 69,550, Burlingame City of Apr 17 0% 86,798, ,717, Burlingame City of Mar 17 0% 82,462, ,745, Burlingame City of Feb 17 0% 71,119,943 90,907, Burlingame City of Jan 17 0% 77,184,618 93,317, Burlingame City of Dec 16 0% 79,143, ,348, Burlingame City of Nov 16 0% 84,157, ,065, Burlingame City of Oct 16 0% 102,579, ,572, Burlingame City of Sep 16 0% 116,289, ,219, Burlingame City of Aug 16 0% 123,404, ,953, Burlingame City of Jul 16 0% 121,770, ,877, Burlingame City of Jun 16 0% 113,870, ,840, Burlingame City of May 16 16% 109,141, ,370, Burlingame City of Apr 16 16% 87,892, ,717, Burlingame City of Mar 16 16% 80,858, ,745, Burlingame City of Feb 16 16% 70,846,577 90,907, Burlingame City of Jan 16 16% 76,725,494 93,317, Burlingame City of Dec 15 16% 79,932, ,348, Burlingame City of Nov 15 16% 79,356, ,065, Burlingame City of Oct 15 16% 101,185, ,572, Burlingame City of Sep 15 16% 104,788, ,219, Burlingame City of Aug 15 16% 110,660, ,953, Burlingame City of Jul 15 16% 108,533, ,877, Burlingame City of Jun 15 16% 103,884, ,840, Burlingame City of May 15 NULL 107,013, ,370, Burlingame City of Apr 15 NULL 98,688, ,717, Burlingame City of Mar 15 NULL 100,158, ,745, Burlingame City of Feb 15 NULL 84,327,239 90,907, Burlingame City of Jan 15 NULL 90,806,569 93,317, Burlingame City of Dec 14 NULL 82,541, ,348, Burlingame City of Nov 14 NULL 91,220, ,065, Burlingame City of Oct 14 NULL 116,177, ,572, Burlingame City of Sep 14 NULL 118,498, ,219, Burlingame City of Aug 14 NULL 133,271, ,953,
243 April 2017 SWRCB Water Supplier Reporting Data BAWSCA Agencies DRAFT FOR INTERNAL USE ONLY Supplier Name Reporting Month State mandated Conservation Standard (Jun 2015 Mar 2017) *Adjusted Mar 16 *Revised Jun 16 *Tentative Mar 17 *Rescinded Apr 17 CALCULATED Total Monthly Potable Water Production Reporting Month Gallons (Values calculated by Water Board staff. REPORTED Total Monthly Potable Water Production Reporting Month REPORTED Monthly Ag Use Reporting Month; converted to gallons.) CALCULATED Total Monthly Potable Water Production 2013 Gallons (Values calculated by Water Board staff. REPORTED Total Monthly Potable Water Production 2013 REPORTED Monthly Ag Use 2013; converted to gallons.) CALCULATED R GPCD Reporting Month (Values calculated by Water Board staff using methodology available at aterrights/water_issues/programs/ drought/docs/ws_tools/guidance_ estimate_res_gpcd.pdf) Burlingame City of Jul 14 NULL 143,463, ,877, Burlingame City of Jun 14 NULL 124,497, ,840, Milpitas City of Apr 17 0% 196,707, ,946, Milpitas City of Mar 17 0% 205,867, ,839, Milpitas City of Feb 17 0% 172,186, ,692, Milpitas City of Jan 17 0% 188,082, ,896, Milpitas City of Dec 16 0% 193,625, ,500, Milpitas City of Nov 16 0% 204,685, ,735, Milpitas City of Oct 16 0% 250,015, ,603, Milpitas City of Sep 16 0% 269,568, ,477, Milpitas City of Aug 16 0% 295,286, ,810, Milpitas City of Jul 16 0% 289,602, ,707, Milpitas City of Jun 16 0% 250,703, ,646, Milpitas City of May 16 12% 247,323, ,347, Milpitas City of Apr 16 12% 212,761, ,946, Milpitas City of Mar 16 12% 207,525, ,839, Milpitas City of Feb 16 12% 178,762, ,025, Milpitas City of Jan 16 12% 192,627, ,896, Milpitas City of Dec 15 12% 199,073, ,500, Milpitas City of Nov 15 12% 199,937, ,735, Milpitas City of Oct 15 12% 263,642, ,487, Milpitas City of Sep 15 12% 261,271, ,944, Milpitas City of Aug 15 12% 255,659, ,707, Milpitas City of Jul 15 12% 277,985, ,707, Milpitas City of Jun 15 12% 252,314, ,646, Milpitas City of May 15 NULL 246,487, ,347, Milpitas City of Apr 15 NULL 237,561, ,839, Milpitas City of Mar 15 NULL 204,604, ,025, Milpitas City of Feb 15 NULL 215,503, ,896, Milpitas City of Jan 15 NULL 209,359, ,500, Milpitas City of Dec 14 NULL 217,783, ,735, Milpitas City of Nov 14 NULL 287,239, ,603, Milpitas City of Oct 14 NULL 264,857, ,393, Milpitas City of Sep 14 NULL 264,857, ,393,
244 April 2017 SWRCB Water Supplier Reporting Data BAWSCA Agencies DRAFT FOR INTERNAL USE ONLY Supplier Name Reporting Month State mandated Conservation Standard (Jun 2015 Mar 2017) *Adjusted Mar 16 *Revised Jun 16 *Tentative Mar 17 *Rescinded Apr 17 CALCULATED Total Monthly Potable Water Production Reporting Month Gallons (Values calculated by Water Board staff. REPORTED Total Monthly Potable Water Production Reporting Month REPORTED Monthly Ag Use Reporting Month; converted to gallons.) CALCULATED Total Monthly Potable Water Production 2013 Gallons (Values calculated by Water Board staff. REPORTED Total Monthly Potable Water Production 2013 REPORTED Monthly Ag Use 2013; converted to gallons.) CALCULATED R GPCD Reporting Month (Values calculated by Water Board staff using methodology available at aterrights/water_issues/programs/ drought/docs/ws_tools/guidance_ estimate_res_gpcd.pdf) Milpitas City of Aug 14 NULL 327,414, ,810, Milpitas City of Jul 14 NULL 334,751, ,707, Milpitas City of Jun 14 NULL 303,008, ,646, Mid Peninsula Water District Apr 17 0% 59,707,262 89,964, Mid Peninsula Water District Mar 17 0% 55,987,948 79,789, Mid Peninsula Water District Feb 17 0% 50,689,496 64,690, Mid Peninsula Water District Jan 17 0% 54,627,242 62,987, Mid Peninsula Water District Dec 16 0% 53,718,358 70,363, Mid Peninsula Water District Nov 16 0% 56,557,964 79,693, Mid Peninsula Water District Oct 16 0% 73,692,094 91,349, Mid Peninsula Water District Sep 16 0% 83,012, ,879, Mid Peninsula Water District Aug 16 0% 89,343, ,537, Mid Peninsula Water District Jul 16 0% 89,838, ,756, Mid Peninsula Water District Jun 16 0% 86,061, ,667, Mid Peninsula Water District May 16 20% 76,267, ,498, Mid Peninsula Water District Apr 16 20% 62,025,475 89,964, Mid Peninsula Water District Mar 16 20% 53,275,512 79,789, Mid Peninsula Water District Feb 16 20% 51,529,429 64,690, Mid Peninsula Water District Jan 16 20% 52,169,891 62,987, Mid Peninsula Water District Dec 15 20% 52,680,062 70,363, Mid Peninsula Water District Nov 15 20% 58,148,322 79,693, Mid Peninsula Water District Oct 15 20% 73,567,169 91,349, Mid Peninsula Water District Sep 15 20% 78,888, ,879, Mid Peninsula Water District Aug 15 20% 79,915, ,537, Mid Peninsula Water District Jul 15 20% 79,023, ,756, Mid Peninsula Water District Jun 15 20% 77,694, ,667, Mid Peninsula Water District May 15 NULL 73,163, ,498, Mid Peninsula Water District Apr 15 NULL 68,440,021 89,964, Mid Peninsula Water District Mar 15 NULL 77,020,177 79,789, Mid Peninsula Water District Feb 15 NULL 59,681,081 64,690, Mid Peninsula Water District Jan 15 NULL 61,609,558 62,987, Mid Peninsula Water District Dec 14 NULL 54,484,364 70,363, Mid Peninsula Water District Nov 14 NULL 64,833,662 79,693, Mid Peninsula Water District Oct 14 NULL 82,025,392 91,349,
245 April 2017 SWRCB Water Supplier Reporting Data BAWSCA Agencies DRAFT FOR INTERNAL USE ONLY Supplier Name Reporting Month State mandated Conservation Standard (Jun 2015 Mar 2017) *Adjusted Mar 16 *Revised Jun 16 *Tentative Mar 17 *Rescinded Apr 17 CALCULATED Total Monthly Potable Water Production Reporting Month Gallons (Values calculated by Water Board staff. REPORTED Total Monthly Potable Water Production Reporting Month REPORTED Monthly Ag Use Reporting Month; converted to gallons.) CALCULATED Total Monthly Potable Water Production 2013 Gallons (Values calculated by Water Board staff. REPORTED Total Monthly Potable Water Production 2013 REPORTED Monthly Ag Use 2013; converted to gallons.) CALCULATED R GPCD Reporting Month (Values calculated by Water Board staff using methodology available at aterrights/water_issues/programs/ drought/docs/ws_tools/guidance_ estimate_res_gpcd.pdf) Mid Peninsula Water District Sep 14 NULL 88,482, ,879, Mid Peninsula Water District Aug 14 NULL 96,441, ,537, Mid Peninsula Water District Jul 14 NULL 100,739, ,756, Mid Peninsula Water District Jun 14 NULL 104,524, ,667, Daly City City of Apr 17 0% 163,714, ,406, Daly City City of Mar 17 0% 179,878, ,126, Daly City City of Feb 17 4% 162,544, ,820, Daly City City of Jan 17 4% 160,989, ,820, Daly City City of Dec 16 4% 192,238, ,582, Daly City City of Nov 16 4% 168,471, ,595, Daly City City of Oct 16 4% 174,494, ,417, Daly City City of Sep 16 4% 185,617, ,502, Daly City City of Aug 16 4% 200,358, ,110, Daly City City of Jul 16 4% 180,445, ,783, Daly City City of Jun 16 4% 203,850, ,084, Daly City City of May 16 8% 182,119, ,618, Daly City City of Apr 16 8% 185,213, ,406, Daly City City of Mar 16 8% 190,279, ,126, Daly City City of Feb 16 8% 180,124, ,169, Daly City City of Jan 16 8% 174,515, ,820, Daly City City of Dec 15 8% 169,937, ,582, Daly City City of Nov 15 8% 185,492, ,595, Daly City City of Oct 15 8% 199,066, ,417, Daly City City of Sep 15 8% 195,234, ,502, Daly City City of Aug 15 8% 191,011, ,110, Daly City City of Jul 15 8% 193,239, ,783, Daly City City of Jun 15 8% 168,747, ,084, Daly City City of May 15 NULL 164,463, ,618, Daly City City of Apr 15 NULL 185,032, ,406, Daly City City of Mar 15 NULL 173,896, ,126, Daly City City of Feb 15 NULL 158,094, ,169, Daly City City of Jan 15 NULL 184,055, ,820, Daly City City of Dec 14 NULL 184,097, ,582, Daly City City of Nov 14 NULL 164,767, ,595,
246 April 2017 SWRCB Water Supplier Reporting Data BAWSCA Agencies DRAFT FOR INTERNAL USE ONLY Supplier Name Reporting Month State mandated Conservation Standard (Jun 2015 Mar 2017) *Adjusted Mar 16 *Revised Jun 16 *Tentative Mar 17 *Rescinded Apr 17 CALCULATED Total Monthly Potable Water Production Reporting Month Gallons (Values calculated by Water Board staff. REPORTED Total Monthly Potable Water Production Reporting Month REPORTED Monthly Ag Use Reporting Month; converted to gallons.) CALCULATED Total Monthly Potable Water Production 2013 Gallons (Values calculated by Water Board staff. REPORTED Total Monthly Potable Water Production 2013 REPORTED Monthly Ag Use 2013; converted to gallons.) CALCULATED R GPCD Reporting Month (Values calculated by Water Board staff using methodology available at aterrights/water_issues/programs/ drought/docs/ws_tools/guidance_ estimate_res_gpcd.pdf) Daly City City of Oct 14 NULL 191,169, ,417, Daly City City of Sep 14 NULL 181,482, ,502, Daly City City of Aug 14 NULL 196,340, ,110, Daly City City of Jul 14 NULL 206,614, ,783, Daly City City of Jun 14 NULL 194,480, ,084, San Jose City of Apr 17 0% 346,000, ,000, San Jose City of Mar 17 0% 331,000, ,000, San Jose City of Feb 17 0% 268,000, ,000, San Jose City of Jan 17 0% 310,000, ,000, San Jose City of Dec 16 0% 308,000, ,000, San Jose City of Nov 16 0% 355,000, ,000, San Jose City of Oct 16 0% 423,000, ,000, San Jose City of Sep 16 0% 543,000, ,000, San Jose City of Aug 16 0% 584,000, ,000, San Jose City of Jul 16 0% 582,000, ,000, San Jose City of Jun 16 0% 551,000, ,000, San Jose City of May 16 20% 459,000, ,000, San Jose City of Apr 16 20% 390,000, ,000, San Jose City of Mar 16 20% 322,000, ,000, San Jose City of Feb 16 20% 289,655, ,000, San Jose City of Jan 16 20% 312,000, ,000, San Jose City of Dec 15 20% 328,000, ,000, San Jose City of Nov 15 20% 341,000, ,000, San Jose City of Oct 15 20% 475,000, ,000, San Jose City of Sep 15 20% 508,000, ,000, San Jose City of Aug 15 20% 520,000, ,000, San Jose City of Jul 15 20% 528,000, ,000, San Jose City of Jun 15 20% 493,000, ,000, San Jose City of May 15 NULL 451,000, ,000, San Jose City of Apr 15 NULL 441,000, ,000, San Jose City of Mar 15 NULL 433,000, ,000, San Jose City of Feb 15 NULL 342,000, ,000, San Jose City of Jan 15 NULL 377,000, ,000, San Jose City of Dec 14 NULL 323,000, ,000,
247 April 2017 SWRCB Water Supplier Reporting Data BAWSCA Agencies DRAFT FOR INTERNAL USE ONLY Supplier Name Reporting Month State mandated Conservation Standard (Jun 2015 Mar 2017) *Adjusted Mar 16 *Revised Jun 16 *Tentative Mar 17 *Rescinded Apr 17 CALCULATED Total Monthly Potable Water Production Reporting Month Gallons (Values calculated by Water Board staff. REPORTED Total Monthly Potable Water Production Reporting Month REPORTED Monthly Ag Use Reporting Month; converted to gallons.) CALCULATED Total Monthly Potable Water Production 2013 Gallons (Values calculated by Water Board staff. REPORTED Total Monthly Potable Water Production 2013 REPORTED Monthly Ag Use 2013; converted to gallons.) CALCULATED R GPCD Reporting Month (Values calculated by Water Board staff using methodology available at aterrights/water_issues/programs/ drought/docs/ws_tools/guidance_ estimate_res_gpcd.pdf) San Jose City of Nov 14 NULL 403,000, ,000, San Jose City of Oct 14 NULL 555,000, ,000, San Jose City of Sep 14 NULL 590,000, ,000, San Jose City of Aug 14 NULL 690,000, ,000, San Jose City of Jul 14 NULL 728,000, ,000, San Jose City of Jun 14 NULL 699,000, ,000, Alameda County Water District Apr 17 0% 879,000,000 1,296,000, Alameda County Water District Mar 17 0% 837,000,000 1,116,000, Alameda County Water District Feb 17 0% 728,000, ,000, Alameda County Water District Jan 17 0% 818,000, ,000, Alameda County Water District Dec 16 0% 846,000,000 1,039,000, Alameda County Water District Nov 16 0% 870,000,000 1,161,000, Alameda County Water District Oct 16 0% 1,122,000,000 1,445,000, Alameda County Water District Sep 16 0% 1,281,000,000 1,548,000, Alameda County Water District Aug 16 0% 1,349,000,000 1,742,000, Alameda County Water District Jul 16 0% 1,352,000,000 1,798,000, Alameda County Water District Jun 16 0% 1,236,000,000 1,733,000, Alameda County Water District May 16 16% 1,073,000,000 1,612,000, Alameda County Water District Apr 16 16% 884,000,000 1,296,000, Alameda County Water District Mar 16 16% 834,000,000 1,116,000, Alameda County Water District Feb 16 16% 761,793, ,000, Alameda County Water District Jan 16 16% 803,000, ,000, Alameda County Water District Dec 15 16% 822,000,000 1,039,000, Alameda County Water District Nov 15 16% 864,000,000 1,161,000, Alameda County Water District Oct 15 16% 1,079,000,000 1,445,000, Alameda County Water District Sep 15 16% 1,131,000,000 1,548,000, Alameda County Water District Aug 15 16% 1,159,000,000 1,742,000, Alameda County Water District Jul 15 16% 1,147,000,000 1,798,000, Alameda County Water District Jun 15 16% 1,068,000,000 1,677,000, Alameda County Water District May 15 NULL 1,013,700,000 1,312,000, Alameda County Water District Apr 15 NULL 957,000,000 1,296,000, Alameda County Water District Mar 15 NULL 961,000,000 1,116,000, Alameda County Water District Feb 15 NULL 795,200, ,600, Alameda County Water District Jan 15 NULL 858,700, ,200,
248 April 2017 SWRCB Water Supplier Reporting Data BAWSCA Agencies DRAFT FOR INTERNAL USE ONLY Supplier Name Reporting Month State mandated Conservation Standard (Jun 2015 Mar 2017) *Adjusted Mar 16 *Revised Jun 16 *Tentative Mar 17 *Rescinded Apr 17 CALCULATED Total Monthly Potable Water Production Reporting Month Gallons (Values calculated by Water Board staff. REPORTED Total Monthly Potable Water Production Reporting Month REPORTED Monthly Ag Use Reporting Month; converted to gallons.) CALCULATED Total Monthly Potable Water Production 2013 Gallons (Values calculated by Water Board staff. REPORTED Total Monthly Potable Water Production 2013 REPORTED Monthly Ag Use 2013; converted to gallons.) CALCULATED R GPCD Reporting Month (Values calculated by Water Board staff using methodology available at aterrights/water_issues/programs/ drought/docs/ws_tools/guidance_ estimate_res_gpcd.pdf) Alameda County Water District Dec 14 NULL 809,100,000 1,038,500, Alameda County Water District Nov 14 NULL 903,000,000 1,161,000, Alameda County Water District Oct 14 NULL 1,143,900,000 1,444,600, Alameda County Water District Sep 14 NULL 1,221,000,000 1,548,000, Alameda County Water District Aug 14 NULL 1,326,800,000 1,742,200, Alameda County Water District Jul 14 NULL 1,401,200,000 1,798,000, California Water Service Company Bear Apr 17 2% 203,103, ,987, California Water Service Company Bear Mar 17 2% 155,756, ,859, California Water Service Company Bear Feb 17 2% 115,970, ,339, California Water Service Company Bear Jan 17 2% 133,110, ,414, California Water Service Company Bear Dec 16 2% 136,955, ,007, California Water Service Company Bear Nov 16 2% 174,330, ,456, California Water Service Company Bear Oct 16 2% 289,127, ,289, California Water Service Company Bear Sep 16 2% 413,407, ,676, California Water Service Company Bear Aug 16 2% 446,709, ,728, California Water Service Company Bear Jul 16 2% 456,550, ,464, California Water Service Company Bear Jun 16 2% 411,811, ,893, California Water Service Company Bear May 16 36% 322,886, ,652, California Water Service Company Bear Apr 16 36% 221,253, ,150, California Water Service Company Bear Mar 16 36% 148,164, ,859, California Water Service Company Bear Feb 16 36% 134,812, ,339, California Water Service Company Bear Jan 16 36% 132,002, ,414, California Water Service Company Bear Dec 15 36% 141,224, ,007, California Water Service Company Bear Nov 15 36% 181,759, ,456, California Water Service Company Bear Oct 15 36% 327,578, ,289, California Water Service Company Bear Sep 15 36% 360,489, ,676, California Water Service Company Bear Aug 15 36% 379,225, ,728, California Water Service Company Bear Jul 15 36% 371,633, ,464, California Water Service Company Bear Jun 15 36% 336,376, ,893, California Water Service Company Bear May 15 NULL 324,385, ,652, California Water Service Company Bear Apr 15 NULL 290,268, ,150, California Water Service Company Bear Mar 15 NULL 292,744, ,859, California Water Service Company Bear Feb 15 NULL 186,061, ,274, California Water Service Company Bear Jan 15 NULL 197,465, ,251,
249 April 2017 SWRCB Water Supplier Reporting Data BAWSCA Agencies DRAFT FOR INTERNAL USE ONLY Supplier Name Reporting Month State mandated Conservation Standard (Jun 2015 Mar 2017) *Adjusted Mar 16 *Revised Jun 16 *Tentative Mar 17 *Rescinded Apr 17 CALCULATED Total Monthly Potable Water Production Reporting Month Gallons (Values calculated by Water Board staff. REPORTED Total Monthly Potable Water Production Reporting Month REPORTED Monthly Ag Use Reporting Month; converted to gallons.) CALCULATED Total Monthly Potable Water Production 2013 Gallons (Values calculated by Water Board staff. REPORTED Total Monthly Potable Water Production 2013 REPORTED Monthly Ag Use 2013; converted to gallons.) CALCULATED R GPCD Reporting Month (Values calculated by Water Board staff using methodology available at aterrights/water_issues/programs/ drought/docs/ws_tools/guidance_ estimate_res_gpcd.pdf) California Water Service Company Bear Dec 14 NULL 153,150, ,040, California Water Service Company Bear Nov 14 NULL 237,545, ,424, California Water Service Company Bear Oct 14 NULL 412,527, ,191, California Water Service Company Bear Sep 14 NULL 450,652, ,676, California Water Service Company Bear Aug 14 NULL 519,407, ,891, California Water Service Company Bear Jul 14 NULL 548,407, ,431, California Water Service Company Bear Jun 14 NULL 523,643, ,959, Hillsborough Town of Apr 17 0% 54,406, ,092, Hillsborough Town of Mar 17 0% 36,213,195 67,714, Hillsborough Town of Feb 17 0% 27,508,862 56,685, Hillsborough Town of Jan 17 0% 27,004,675 40,536, Hillsborough Town of Dec 16 0% 27,353,268 60,401, Hillsborough Town of Nov 16 0% 39,646,753 71,358, Hillsborough Town of Oct 16 0% 43,627, ,394, Hillsborough Town of Sep 16 0% 104,323, ,338, Hillsborough Town of Aug 16 0% 133,095, ,644, Hillsborough Town of Jul 16 0% 113,098, ,279, Hillsborough Town of Jun 16 0% 118,574, ,914, Hillsborough Town of May 16 36% 99,769, ,596, Hillsborough Town of Apr 16 36% 57,756, ,092, Hillsborough Town of Mar 16 36% 39,266,743 67,714, Hillsborough Town of Feb 16 36% 31,290,342 56,685, Hillsborough Town of Jan 16 36% 25,130,057 40,536, Hillsborough Town of Dec 15 36% 30,030,545 60,401, Hillsborough Town of Nov 15 36% 37,888,083 71,358, Hillsborough Town of Oct 15 36% 72,038, ,394, Hillsborough Town of Sep 15 36% 85,808, ,338, Hillsborough Town of Aug 15 36% 97,938, ,644, Hillsborough Town of Jul 15 36% 90,868, ,279, Hillsborough Town of Jun 15 36% 94,386, ,914, Hillsborough Town of May 15 NULL 71,364, ,596, Hillsborough Town of Apr 15 NULL 75,576, ,092, Hillsborough Town of Mar 15 NULL 69,298,784 67,714, Hillsborough Town of Feb 15 NULL 45,419,470 56,685,
250 April 2017 SWRCB Water Supplier Reporting Data BAWSCA Agencies DRAFT FOR INTERNAL USE ONLY Supplier Name Reporting Month State mandated Conservation Standard (Jun 2015 Mar 2017) *Adjusted Mar 16 *Revised Jun 16 *Tentative Mar 17 *Rescinded Apr 17 CALCULATED Total Monthly Potable Water Production Reporting Month Gallons (Values calculated by Water Board staff. REPORTED Total Monthly Potable Water Production Reporting Month REPORTED Monthly Ag Use Reporting Month; converted to gallons.) CALCULATED Total Monthly Potable Water Production 2013 Gallons (Values calculated by Water Board staff. REPORTED Total Monthly Potable Water Production 2013 REPORTED Monthly Ag Use 2013; converted to gallons.) CALCULATED R GPCD Reporting Month (Values calculated by Water Board staff using methodology available at aterrights/water_issues/programs/ drought/docs/ws_tools/guidance_ estimate_res_gpcd.pdf) Hillsborough Town of Jan 15 NULL 42,460,925 40,536, Hillsborough Town of Dec 14 NULL 37,350,982 60,401, Hillsborough Town of Nov 14 NULL 33,284,571 71,358, Hillsborough Town of Oct 14 NULL 86,897, ,394, Hillsborough Town of Sep 14 NULL 103,773, ,338, Hillsborough Town of Aug 14 NULL 117,878, ,644, Hillsborough Town of Jul 14 NULL 145,875, ,279, Hillsborough Town of Jun 14 NULL 133,587, ,914, Hayward City of Apr 17 0% 342,080, ,481, Hayward City of Mar 17 0% 343,089, ,027, Hayward City of Feb 17 0% 272,475, ,776, Hayward City of Jan 17 0% 334,510, ,533, Hayward City of Dec 16 0% 343,301, ,892, Hayward City of Nov 16 0% 346,927, ,829, Hayward City of Oct 16 0% 415,506, ,303, Hayward City of Sep 16 0% 511,728, ,563, Hayward City of Aug 16 0% 453,989, ,217, Hayward City of Jul 16 0% 436,459, ,265, Hayward City of Jun 16 0% 461,675, ,574, Hayward City of May 16 8% 339,760, ,819, Hayward City of Apr 16 8% 324,030, ,481, Hayward City of Mar 16 8% 324,708, ,027, Hayward City of Feb 16 8% 277,395, ,776, Hayward City of Jan 16 8% 312,992, ,533, Hayward City of Dec 15 8% 332,867, ,892, Hayward City of Nov 15 8% 343,251, ,829, Hayward City of Oct 15 8% 390,048, ,303, Hayward City of Sep 15 8% 546,475, ,563, Hayward City of Aug 15 8% 357,442, ,217, Hayward City of Jul 15 8% 452,507, ,265, Hayward City of Jun 15 8% 386,343, ,574, Hayward City of May 15 NULL 367,344, ,819, Hayward City of Apr 15 NULL 397,857, ,481, Hayward City of Mar 15 NULL 347,598, ,003,
251 April 2017 SWRCB Water Supplier Reporting Data BAWSCA Agencies DRAFT FOR INTERNAL USE ONLY Supplier Name Reporting Month State mandated Conservation Standard (Jun 2015 Mar 2017) *Adjusted Mar 16 *Revised Jun 16 *Tentative Mar 17 *Rescinded Apr 17 CALCULATED Total Monthly Potable Water Production Reporting Month Gallons (Values calculated by Water Board staff. REPORTED Total Monthly Potable Water Production Reporting Month REPORTED Monthly Ag Use Reporting Month; converted to gallons.) CALCULATED Total Monthly Potable Water Production 2013 Gallons (Values calculated by Water Board staff. REPORTED Total Monthly Potable Water Production 2013 REPORTED Monthly Ag Use 2013; converted to gallons.) CALCULATED R GPCD Reporting Month (Values calculated by Water Board staff using methodology available at aterrights/water_issues/programs/ drought/docs/ws_tools/guidance_ estimate_res_gpcd.pdf) Hayward City of Feb 15 NULL 355,092, ,905, Hayward City of Jan 15 NULL 420,595, ,417, Hayward City of Dec 14 NULL 313,293, ,892, Hayward City of Nov 14 NULL 406,228, ,829, Hayward City of Oct 14 NULL 486,945, ,303, Hayward City of Sep 14 NULL 454,640, ,563, Hayward City of Aug 14 NULL 520,751, ,217, Hayward City of Jul 14 NULL 506,345, ,265, Hayward City of Jun 14 NULL 493,329, ,574, California Water Service Company Mid P Apr 17 0% 292,419, ,703, California Water Service Company Mid P Mar 17 0% 274,725, ,794, California Water Service Company Mid P Feb 17 0% 239,728, ,451, California Water Service Company Mid P Jan 17 0% 263,907, ,928, California Water Service Company Mid P Dec 16 0% 265,373, ,200, California Water Service Company Mid P Nov 16 0% 279,743, ,551, California Water Service Company Mid P Oct 16 0% 349,443, ,121, California Water Service Company Mid P Sep 16 0% 411,517, ,187, California Water Service Company Mid P Aug 16 0% 438,498, ,638, California Water Service Company Mid P Jul 16 0% 443,060, ,930, California Water Service Company Mid P Jun 16 0% 421,553, ,044, California Water Service Company Mid P May 16 16% 380,692, ,854, California Water Service Company Mid P Apr 16 16% 313,273, ,703, California Water Service Company Mid P Mar 16 16% 270,424, ,794, California Water Service Company Mid P Feb 16 16% 246,343, ,451, California Water Service Company Mid P Jan 16 16% 255,630, ,928, California Water Service Company Mid P Dec 15 16% 263,613, ,200, California Water Service Company Mid P Nov 15 16% 286,814, ,551, California Water Service Company Mid P Oct 15 16% 362,835, ,121, California Water Service Company Mid P Sep 15 16% 378,606, ,154, California Water Service Company Mid P Aug 15 16% 396,887, ,638, California Water Service Company Mid P Jul 15 16% 398,092, ,930, California Water Service Company Mid P Jun 15 16% 370,167, ,044, California Water Service Company Mid P May 15 NULL 371,894, ,854, California Water Service Company Mid P Apr 15 NULL 348,432, ,703,
252 April 2017 SWRCB Water Supplier Reporting Data BAWSCA Agencies DRAFT FOR INTERNAL USE ONLY Supplier Name Reporting Month State mandated Conservation Standard (Jun 2015 Mar 2017) *Adjusted Mar 16 *Revised Jun 16 *Tentative Mar 17 *Rescinded Apr 17 CALCULATED Total Monthly Potable Water Production Reporting Month Gallons (Values calculated by Water Board staff. REPORTED Total Monthly Potable Water Production Reporting Month REPORTED Monthly Ag Use Reporting Month; converted to gallons.) CALCULATED Total Monthly Potable Water Production 2013 Gallons (Values calculated by Water Board staff. REPORTED Total Monthly Potable Water Production 2013 REPORTED Monthly Ag Use 2013; converted to gallons.) CALCULATED R GPCD Reporting Month (Values calculated by Water Board staff using methodology available at aterrights/water_issues/programs/ drought/docs/ws_tools/guidance_ estimate_res_gpcd.pdf) California Water Service Company Mid P Mar 15 NULL 362,868, ,794, California Water Service Company Mid P Feb 15 NULL 286,618, ,794, California Water Service Company Mid P Jan 15 NULL 307,929, ,895, California Water Service Company Mid P Dec 14 NULL 276,322, ,200, California Water Service Company Mid P Nov 14 NULL 325,525, ,583, California Water Service Company Mid P Oct 14 NULL 416,112, ,990, California Water Service Company Mid P Sep 14 NULL 439,247, ,317, California Water Service Company Mid P Aug 14 NULL 487,147, ,801, California Water Service Company Mid P Jul 14 NULL 508,328, ,767, California Water Service Company Mid P Jun 14 NULL 504,418, ,946, California Water Service Company South Apr 17 0% 157,646, ,057, California Water Service Company South Mar 17 0% 161,850, ,174, California Water Service Company South Feb 17 0% 151,716, ,957, California Water Service Company South Jan 17 0% 151,716, ,085, California Water Service Company South Dec 16 0% 161,524, ,278, California Water Service Company South Nov 16 0% 159,015, ,224, California Water Service Company South Oct 16 0% 189,547, ,306, California Water Service Company South Sep 16 0% 201,408, ,614, California Water Service Company South Aug 16 0% 207,111, ,473, California Water Service Company South Jul 16 0% 205,612, ,574, California Water Service Company South Jun 16 0% 203,754, ,896, California Water Service Company South May 16 8% 195,185, ,463, California Water Service Company South Apr 16 8% 176,220, ,057, California Water Service Company South Mar 16 8% 165,174, ,174, California Water Service Company South Feb 16 8% 149,536, ,957, California Water Service Company South Jan 16 8% 159,471, ,085, California Water Service Company South Dec 15 8% 161,231, ,278, California Water Service Company South Nov 15 8% 171,300, ,224, California Water Service Company South Oct 15 8% 203,591, ,306, California Water Service Company South Sep 15 8% 200,105, ,614, California Water Service Company South Aug 15 8% 205,058, ,473, California Water Service Company South Jul 15 8% 206,883, ,574, California Water Service Company South Jun 15 8% 194,631, ,896, California Water Service Company South May 15 NULL 197,922, ,463,
253 April 2017 SWRCB Water Supplier Reporting Data BAWSCA Agencies DRAFT FOR INTERNAL USE ONLY Supplier Name Reporting Month State mandated Conservation Standard (Jun 2015 Mar 2017) *Adjusted Mar 16 *Revised Jun 16 *Tentative Mar 17 *Rescinded Apr 17 CALCULATED Total Monthly Potable Water Production Reporting Month Gallons (Values calculated by Water Board staff. REPORTED Total Monthly Potable Water Production Reporting Month REPORTED Monthly Ag Use Reporting Month; converted to gallons.) CALCULATED Total Monthly Potable Water Production 2013 Gallons (Values calculated by Water Board staff. REPORTED Total Monthly Potable Water Production 2013 REPORTED Monthly Ag Use 2013; converted to gallons.) CALCULATED R GPCD Reporting Month (Values calculated by Water Board staff using methodology available at aterrights/water_issues/programs/ drought/docs/ws_tools/guidance_ estimate_res_gpcd.pdf) California Water Service Company South Apr 15 NULL 192,252, ,057, California Water Service Company South Mar 15 NULL 200,919, ,174, California Water Service Company South Feb 15 NULL 170,420, ,892, California Water Service Company South Jan 15 NULL 197,465, ,150, California Water Service Company South Dec 14 NULL 172,375, ,376, California Water Service Company South Nov 14 NULL 180,847, ,387, California Water Service Company South Oct 14 NULL 220,275, ,209, California Water Service Company South Sep 14 NULL 226,792, ,647, California Water Service Company South Aug 14 NULL 241,130, ,636, California Water Service Company South Jul 14 NULL 251,557, ,411, California Water Service Company South Jun 14 NULL 246,669, ,962, East Palo Alto, City of Mar 17 8% 38,413,216 54,601, East Palo Alto, City of Feb 17 8% 36,006,732 30,614, East Palo Alto, City of Jan 17 8% 41,314,909 60,088, East Palo Alto, City of Dec 16 8% 40,735,917 37,553, East Palo Alto, City of Nov 16 8% 40,403,034 66,277, East Palo Alto, City of Oct 16 8% 46,311,896 66,277, East Palo Alto, City of Sep 16 8% 54,925,714 71,661, East Palo Alto, City of Aug 16 8% 49,840,457 53,555, East Palo Alto, City of Jul 16 8% 54,679,605 76,480, East Palo Alto, City of Jun 16 8% 48,609,164 49,239, East Palo Alto, City of May 16 8% 40,881,039 60,088, East Palo Alto, City of Apr 16 8% 44,289,912 36,163, East Palo Alto, City of Mar 16 8% 36,786,203 49,436, East Palo Alto, City of Feb 16 8% 34,966,631 30,614, East Palo Alto, City of Jan 16 8% 39,674,431 60,088, East Palo Alto, City of Dec 15 8% 36,623,127 37,553, East Palo Alto, City of Nov 15 8% 40,043,969 66,277, East Palo Alto, City of Oct 15 8% 49,946,681 66,277, East Palo Alto, City of Sep 15 8% 45,321,475 71,661, East Palo Alto, City of Aug 15 8% 50,794,971 53,555, East Palo Alto, City of Jul 15 8% 47,514,016 76,480, East Palo Alto, City of Jun 15 8% 43,640,603 49,239, East Palo Alto, City of May 15 NULL 45,467,345 60,088,
254 April 2017 SWRCB Water Supplier Reporting Data BAWSCA Agencies DRAFT FOR INTERNAL USE ONLY Supplier Name Reporting Month State mandated Conservation Standard (Jun 2015 Mar 2017) *Adjusted Mar 16 *Revised Jun 16 *Tentative Mar 17 *Rescinded Apr 17 CALCULATED Total Monthly Potable Water Production Reporting Month Gallons (Values calculated by Water Board staff. REPORTED Total Monthly Potable Water Production Reporting Month REPORTED Monthly Ag Use Reporting Month; converted to gallons.) CALCULATED Total Monthly Potable Water Production 2013 Gallons (Values calculated by Water Board staff. REPORTED Total Monthly Potable Water Production 2013 REPORTED Monthly Ag Use 2013; converted to gallons.) CALCULATED R GPCD Reporting Month (Values calculated by Water Board staff using methodology available at aterrights/water_issues/programs/ drought/docs/ws_tools/guidance_ estimate_res_gpcd.pdf) East Palo Alto, City of Apr 15 NULL 28,782,047 36,163, East Palo Alto, City of Mar 15 NULL 48,977,205 49,436, East Palo Alto, City of Feb 15 NULL 28,601,766 30,614, East Palo Alto, City of Jan 15 NULL 41,511,647 51,396, East Palo Alto, City of Dec 14 NULL 33,199,436 37,554, East Palo Alto, City of Nov 14 NULL 62,258,546 66,277, East Palo Alto, City of Oct 14 NULL 36,644,596 43,429, East Palo Alto, City of Sep 14 NULL 66,126,842 71,661, East Palo Alto, City of Aug 14 NULL 44,128,557 53,555, East Palo Alto, City of Jul 14 NULL 65,217,084 76,480, East Palo Alto, City of Jun 14 NULL 45,190,806 49,239, Westborough Water District Apr 17 0% 17,214,919 27,535, Westborough Water District Mar 17 0% 18,674,369 20,096, Westborough Water District Feb 17 0% 20,594,618 21,200, Westborough Water District Jan 17 0% 14,801,704 26,546, Westborough Water District Dec 16 0% 21,370,348 25,750, Westborough Water District Nov 16 0% 24,634,847 26,861, Westborough Water District Oct 16 0% 17,715,366 35,118, Westborough Water District Sep 16 0% 22,048,831 35,118, Westborough Water District Aug 16 0% 27,698,868 27,668, Westborough Water District Jul 16 0% 19,252,613 31,812, Westborough Water District Jun 16 0% 21,495,273 27,774, Westborough Water District May 16 8% 24,081,288 30,971, Westborough Water District Apr 16 8% 20,703,086 27,535, Westborough Water District Mar 16 8% 21,545,392 20,096, Westborough Water District Feb 16 8% 16,218,282 21,200, Westborough Water District Jan 16 8% 18,889,060 26,546, Westborough Water District Dec 15 8% 22,113,912 25,750, Westborough Water District Nov 15 8% 20,265,475 26,861, Westborough Water District Oct 15 8% 21,208,769 34,835, Westborough Water District Sep 15 8% 24,714,888 35,118, Westborough Water District Aug 15 8% 25,122,577 27,668, Westborough Water District Jul 15 8% 16,537,184 31,812, Westborough Water District Jun 15 8% 25,673,891 27,774,
255 April 2017 SWRCB Water Supplier Reporting Data BAWSCA Agencies DRAFT FOR INTERNAL USE ONLY Supplier Name Reporting Month State mandated Conservation Standard (Jun 2015 Mar 2017) *Adjusted Mar 16 *Revised Jun 16 *Tentative Mar 17 *Rescinded Apr 17 CALCULATED Total Monthly Potable Water Production Reporting Month Gallons (Values calculated by Water Board staff. REPORTED Total Monthly Potable Water Production Reporting Month REPORTED Monthly Ag Use Reporting Month; converted to gallons.) CALCULATED Total Monthly Potable Water Production 2013 Gallons (Values calculated by Water Board staff. REPORTED Total Monthly Potable Water Production 2013 REPORTED Monthly Ag Use 2013; converted to gallons.) CALCULATED R GPCD Reporting Month (Values calculated by Water Board staff using methodology available at aterrights/water_issues/programs/ drought/docs/ws_tools/guidance_ estimate_res_gpcd.pdf) Westborough Water District May 15 NULL 20,254,255 30,971, Westborough Water District Apr 15 NULL 27,831,273 27,535, Westborough Water District Mar 15 NULL 21,717,444 20,096, Westborough Water District Feb 15 NULL 21,006,795 21,200, Westborough Water District Jan 15 NULL 20,298,390 26,546, Westborough Water District Dec 14 NULL 22,806,608 25,750, Westborough Water District Nov 14 NULL 20,372,447 26,861, Westborough Water District Oct 14 NULL 26,582,026 34,835, Westborough Water District Sep 14 NULL 22,827,553 35,118, Westborough Water District Aug 14 NULL 27,000,187 27,668, Westborough Water District Jul 14 NULL 27,115,387 31,812, Westborough Water District Jun 14 NULL 25,767,397 27,774, Mountain View City of Apr 17 0% 155,431, ,278, Mountain View City of Mar 17 0% 202,027, ,186, Mountain View City of Feb 17 0% 153,476, ,422, Mountain View City of Jan 17 0% 168,139, ,174, Mountain View City of Dec 16 0% 189,319, ,613, Mountain View City of Nov 16 0% 186,387, ,322, Mountain View City of Oct 16 0% 233,635, ,897, Mountain View City of Sep 16 0% 312,491, ,705, Mountain View City of Aug 16 0% 325,199, ,787, Mountain View City of Jul 16 0% 318,030, ,483, Mountain View City of Jun 16 0% 292,940, ,448, Mountain View City of May 16 16% 256,119, ,506, Mountain View City of Apr 16 16% 217,017, ,278, Mountain View City of Mar 16 16% 194,859, ,186, Mountain View City of Feb 16 16% 168,319, ,422, Mountain View City of Jan 16 16% 147,936, ,174, Mountain View City of Dec 15 16% 191,274, ,613, Mountain View City of Nov 15 16% 173,678, ,322, Mountain View City of Oct 15 16% 257,096, ,897, Mountain View City of Sep 15 16% 260,029, ,705, Mountain View City of Aug 15 16% 260,681, ,787, Mountain View City of Jul 15 16% 307,277, ,483,
256 April 2017 SWRCB Water Supplier Reporting Data BAWSCA Agencies DRAFT FOR INTERNAL USE ONLY Supplier Name Reporting Month State mandated Conservation Standard (Jun 2015 Mar 2017) *Adjusted Mar 16 *Revised Jun 16 *Tentative Mar 17 *Rescinded Apr 17 CALCULATED Total Monthly Potable Water Production Reporting Month Gallons (Values calculated by Water Board staff. REPORTED Total Monthly Potable Water Production Reporting Month REPORTED Monthly Ag Use Reporting Month; converted to gallons.) CALCULATED Total Monthly Potable Water Production 2013 Gallons (Values calculated by Water Board staff. REPORTED Total Monthly Potable Water Production 2013 REPORTED Monthly Ag Use 2013; converted to gallons.) CALCULATED R GPCD Reporting Month (Values calculated by Water Board staff using methodology available at aterrights/water_issues/programs/ drought/docs/ws_tools/guidance_ estimate_res_gpcd.pdf) Mountain View City of Jun 15 16% 271,108, ,448, Mountain View City of May 15 NULL 272,411, ,506, Mountain View City of Apr 15 NULL 245,366, ,278, Mountain View City of Mar 15 NULL 246,343, ,186, Mountain View City of Feb 15 NULL 195,836, ,422, Mountain View City of Jan 15 NULL 209,522, ,174, Mountain View City of Dec 14 NULL 183,128, ,613, Mountain View City of Nov 14 NULL 202,353, ,322, Mountain View City of Oct 14 NULL 306,952, ,897, Mountain View City of Sep 14 NULL 303,041, ,705, Mountain View City of Aug 14 NULL 367,560, ,787, Mountain View City of Jul 14 NULL 381,572, ,483, Mountain View City of Jun 14 NULL 381,246, ,448, Estero Municipal Improvement District Apr 17 0% 112,474, ,984, Estero Municipal Improvement District Mar 17 0% 93,408, ,193, Estero Municipal Improvement District Feb 17 0% 73,018,847 99,365, Estero Municipal Improvement District Jan 17 0% 74,612,945 81,302, Estero Municipal Improvement District Dec 16 0% 85,408,083 67,475, Estero Municipal Improvement District Nov 16 0% 96,129, ,077, Estero Municipal Improvement District Oct 16 0% 83,264, ,865, Estero Municipal Improvement District Sep 16 0% 133,275, ,786, Estero Municipal Improvement District Aug 16 0% 167,973, ,264, Estero Municipal Improvement District Jul 16 0% 145,556, ,875, Estero Municipal Improvement District Jun 16 0% 156,473, ,342, Estero Municipal Improvement District May 16 12% 146,689, ,833, Estero Municipal Improvement District Apr 16 12% 110,089, ,984, Estero Municipal Improvement District Mar 16 12% 94,079, ,193, Estero Municipal Improvement District Feb 16 12% 77,572,574 99,365, Estero Municipal Improvement District Jan 16 12% 71,938,660 81,302, Estero Municipal Improvement District Dec 15 12% 77,941,777 67,475, Estero Municipal Improvement District Nov 15 12% 81,259, ,077, Estero Municipal Improvement District Oct 15 12% 109,831, ,865, Estero Municipal Improvement District Sep 15 12% 124,938, ,786, Estero Municipal Improvement District Aug 15 12% 137,845, ,264,
257 April 2017 SWRCB Water Supplier Reporting Data BAWSCA Agencies DRAFT FOR INTERNAL USE ONLY Supplier Name Reporting Month State mandated Conservation Standard (Jun 2015 Mar 2017) *Adjusted Mar 16 *Revised Jun 16 *Tentative Mar 17 *Rescinded Apr 17 CALCULATED Total Monthly Potable Water Production Reporting Month Gallons (Values calculated by Water Board staff. REPORTED Total Monthly Potable Water Production Reporting Month REPORTED Monthly Ag Use Reporting Month; converted to gallons.) CALCULATED Total Monthly Potable Water Production 2013 Gallons (Values calculated by Water Board staff. REPORTED Total Monthly Potable Water Production 2013 REPORTED Monthly Ag Use 2013; converted to gallons.) CALCULATED R GPCD Reporting Month (Values calculated by Water Board staff using methodology available at aterrights/water_issues/programs/ drought/docs/ws_tools/guidance_ estimate_res_gpcd.pdf) Estero Municipal Improvement District Jul 15 12% 131,148, ,875, Estero Municipal Improvement District Jun 15 12% 147,439, ,342, Estero Municipal Improvement District May 15 NULL 119,908, ,833, Estero Municipal Improvement District Apr 15 NULL 137,410, ,984, Estero Municipal Improvement District Mar 15 NULL 118,578, ,193, Estero Municipal Improvement District Feb 15 NULL 97,361,205 64,456, Estero Municipal Improvement District Jan 15 NULL 84,740,073 93,917, Estero Municipal Improvement District Dec 14 NULL 90,934,691 94,067, Estero Municipal Improvement District Nov 14 NULL 74,523, ,077, Estero Municipal Improvement District Oct 14 NULL 133,445, ,865, Estero Municipal Improvement District Sep 14 NULL 133,120, ,786, Estero Municipal Improvement District Aug 14 NULL 148,682, ,780, Estero Municipal Improvement District Jul 14 NULL 157,988, ,928, Estero Municipal Improvement District Jun 14 NULL 156,642, ,797, Sunnyvale City of Apr 17 0% 407,965, ,487, Sunnyvale City of Mar 17 0% 388,740, ,024, Sunnyvale City of Feb 17 5% 307,277, ,977, Sunnyvale City of Jan 17 5% 343,773, ,346, Sunnyvale City of Dec 16 5% 348,009, ,168, Sunnyvale City of Nov 16 5% 357,459, ,350, Sunnyvale City of Oct 16 5% 464,989, ,185, Sunnyvale City of Sep 16 5% 560,985, ,342, Sunnyvale City of Aug 16 5% 601,847, ,087, Sunnyvale City of Jul 16 5% 582,622, ,346, Sunnyvale City of Jun 16 5% 551,340, ,861, Sunnyvale City of May 16 16% 480,956, ,761, Sunnyvale City of Apr 16 16% 422,955, ,487, Sunnyvale City of Mar 16 16% 360,717, ,024, Sunnyvale City of Feb 16 16% 317,761, ,977, Sunnyvale City of Jan 16 16% 317,705, ,346, Sunnyvale City of Dec 15 16% 341,166, ,168, Sunnyvale City of Nov 15 16% 359,414, ,350, Sunnyvale City of Oct 15 16% 317,705, ,346, Sunnyvale City of Sep 15 16% 481,934, ,342,
258 April 2017 SWRCB Water Supplier Reporting Data BAWSCA Agencies DRAFT FOR INTERNAL USE ONLY Supplier Name Reporting Month State mandated Conservation Standard (Jun 2015 Mar 2017) *Adjusted Mar 16 *Revised Jun 16 *Tentative Mar 17 *Rescinded Apr 17 CALCULATED Total Monthly Potable Water Production Reporting Month Gallons (Values calculated by Water Board staff. REPORTED Total Monthly Potable Water Production Reporting Month REPORTED Monthly Ag Use Reporting Month; converted to gallons.) CALCULATED Total Monthly Potable Water Production 2013 Gallons (Values calculated by Water Board staff. REPORTED Total Monthly Potable Water Production 2013 REPORTED Monthly Ag Use 2013; converted to gallons.) CALCULATED R GPCD Reporting Month (Values calculated by Water Board staff using methodology available at aterrights/water_issues/programs/ drought/docs/ws_tools/guidance_ estimate_res_gpcd.pdf) Sunnyvale City of Aug 15 16% 479,001, ,087, Sunnyvale City of Jul 15 16% 495,620, ,346, Sunnyvale City of Jun 15 16% 452,607, ,861, Sunnyvale City of May 15 NULL 465,967, ,761, Sunnyvale City of Apr 15 NULL 432,404, ,487, Sunnyvale City of Mar 15 NULL 457,169, ,024, Sunnyvale City of Feb 15 NULL 345,076, ,977, Sunnyvale City of Jan 15 NULL 385,808, ,967, Sunnyvale City of Dec 14 NULL 328,132, ,168, Sunnyvale City of Nov 14 NULL 406,010, ,350, Sunnyvale City of Oct 14 NULL 566,003, ,185, Sunnyvale City of Sep 14 NULL 559,161, ,342, Sunnyvale City of Aug 14 NULL 651,702, ,087, Sunnyvale City of Jul 14 NULL 679,074, ,346, San Bruno City of Apr 17 0% 61,561,683 79,402, San Bruno City of Mar 17 0% 71,974,566 95,443, San Bruno City of Feb 17 0% 65,235,366 84,024, San Bruno City of Jan 17 0% 76,717,216 93,602, San Bruno City of Dec 16 0% 66,156,966 82,938, San Bruno City of Nov 16 0% 84,140, ,460, San Bruno City of Oct 16 0% 84,753,538 98,171, San Bruno City of Sep 16 0% 99,915, ,427, San Bruno City of Aug 16 0% 87,136, ,314, San Bruno City of Jul 16 0% 98,930, ,030, San Bruno City of Jun 16 0% 80,402, ,690, San Bruno City of May 16 8% 82,876, ,240, San Bruno City of Apr 16 8% 68,514,826 79,402, San Bruno City of Mar 16 8% 70,090,971 95,443, San Bruno City of Feb 16 8% 64,340,825 84,024, San Bruno City of Jan 16 8% 77,033,642 93,602, San Bruno City of Dec 15 8% 68,509,590 82,938, San Bruno City of Nov 15 8% 82,816, ,460, San Bruno City of Oct 15 8% 78,848,416 98,171, San Bruno City of Sep 15 8% 91,233, ,427,
259 April 2017 SWRCB Water Supplier Reporting Data BAWSCA Agencies DRAFT FOR INTERNAL USE ONLY Supplier Name Reporting Month State mandated Conservation Standard (Jun 2015 Mar 2017) *Adjusted Mar 16 *Revised Jun 16 *Tentative Mar 17 *Rescinded Apr 17 CALCULATED Total Monthly Potable Water Production Reporting Month Gallons (Values calculated by Water Board staff. REPORTED Total Monthly Potable Water Production Reporting Month REPORTED Monthly Ag Use Reporting Month; converted to gallons.) CALCULATED Total Monthly Potable Water Production 2013 Gallons (Values calculated by Water Board staff. REPORTED Total Monthly Potable Water Production 2013 REPORTED Monthly Ag Use 2013; converted to gallons.) CALCULATED R GPCD Reporting Month (Values calculated by Water Board staff using methodology available at aterrights/water_issues/programs/ drought/docs/ws_tools/guidance_ estimate_res_gpcd.pdf) San Bruno City of Aug 15 8% 85,194, ,314, San Bruno City of Jul 15 8% 89,057, ,030, San Bruno City of Jun 15 8% 74,617, ,690, San Bruno City of May 15 NULL 90,273, ,240, San Bruno City of Apr 15 NULL 68,514,826 79,402, San Bruno City of Mar 15 NULL 81,500,260 95,443, San Bruno City of Feb 15 NULL 72,278,275 84,024, San Bruno City of Jan 15 NULL 80,723,034 93,602, San Bruno City of Dec 14 NULL 67,953,039 82,938, San Bruno City of Nov 14 NULL 92,422,566 96,034, San Bruno City of Oct 14 NULL 86,892,966 98,171, San Bruno City of Sep 14 NULL 110,924, ,584, San Bruno City of Aug 14 NULL 104,139, ,314, San Bruno City of Jul 14 NULL 116,691, ,599, San Bruno City of Jun 14 NULL 117,594, ,596, Santa Clara City of Apr 17 0% 447,500, ,000, Santa Clara City of Mar 17 0% 408,500, ,400, Santa Clara City of Feb 17 0% 351,500, ,700, Santa Clara City of Jan 17 0% 347,700, ,300, Santa Clara City of Dec 16 0% 405,900, ,400, Santa Clara City of Nov 16 0% 406,000, ,700, Santa Clara City of Oct 16 0% 469,800, ,200, Santa Clara City of Sep 16 0% 577,600, ,100, Santa Clara City of Aug 16 0% 576,900, ,700, Santa Clara City of Jul 16 0% 596,700, ,200, Santa Clara City of Jun 16 0% 542,400, ,500, Santa Clara City of May 16 16% 481,800, ,700, Santa Clara City of Apr 16 16% 413,200, ,000, Santa Clara City of Mar 16 16% 401,300, ,400, Santa Clara City of Feb 16 16% 365,544, ,700, Santa Clara City of Jan 16 16% 341,400, ,300, Santa Clara City of Dec 15 16% 395,100, ,400, Santa Clara City of Nov 15 16% 368,000, ,700, Santa Clara City of Oct 15 16% 529,400, ,200,
260 April 2017 SWRCB Water Supplier Reporting Data BAWSCA Agencies DRAFT FOR INTERNAL USE ONLY Supplier Name Reporting Month State mandated Conservation Standard (Jun 2015 Mar 2017) *Adjusted Mar 16 *Revised Jun 16 *Tentative Mar 17 *Rescinded Apr 17 CALCULATED Total Monthly Potable Water Production Reporting Month Gallons (Values calculated by Water Board staff. REPORTED Total Monthly Potable Water Production Reporting Month REPORTED Monthly Ag Use Reporting Month; converted to gallons.) CALCULATED Total Monthly Potable Water Production 2013 Gallons (Values calculated by Water Board staff. REPORTED Total Monthly Potable Water Production 2013 REPORTED Monthly Ag Use 2013; converted to gallons.) CALCULATED R GPCD Reporting Month (Values calculated by Water Board staff using methodology available at aterrights/water_issues/programs/ drought/docs/ws_tools/guidance_ estimate_res_gpcd.pdf) Santa Clara City of Sep 15 16% 539,300, ,100, Santa Clara City of Aug 15 16% 517,200, ,700, Santa Clara City of Jul 15 16% 574,500, ,200, Santa Clara City of Jun 15 16% 499,000, ,500, Santa Clara City of May 15 NULL 505,700, ,700, Santa Clara City of Apr 15 NULL 497,800, ,000, Santa Clara City of Mar 15 NULL 501,100, ,400, Santa Clara City of Feb 15 NULL 399,600, ,700, Santa Clara City of Jan 15 NULL 415,200, ,400, Santa Clara City of Dec 14 NULL 356,900, ,400, Santa Clara City of Nov 14 NULL 464,500, ,700, Santa Clara City of Oct 14 NULL 589,900, ,200, Santa Clara City of Sep 14 NULL 554,700, ,100, Santa Clara City of Aug 14 NULL 678,900, ,700, Santa Clara City of Jul 14 NULL 671,800, ,200, Santa Clara City of Jun 14 NULL 618,000, ,500, Menlo Park City of Apr 17 0% 54,019,823 86,774, Menlo Park City of Mar 17 0% 43,059,366 76,365, Menlo Park City of Feb 17 0% 38,661,569 60,699, Menlo Park City of Jan 17 0% 40,058,182 46,177, Menlo Park City of Dec 16 0% 49,096,145 69,067, Menlo Park City of Nov 16 0% 53,968,956 90,577, Menlo Park City of Oct 16 0% 83,251, ,280, Menlo Park City of Sep 16 0% 103,741, ,961, Menlo Park City of Aug 16 0% 100,503, ,849, Menlo Park City of Jul 16 0% 112,294, ,169, Menlo Park City of Jun 16 0% 87,068, ,588, Menlo Park City of May 16 16% 68,984, ,773, Menlo Park City of Apr 16 16% 60,152,353 86,774, Menlo Park City of Mar 16 16% 44,849,455 76,365, Menlo Park City of Feb 16 16% 40,686,907 60,699, Menlo Park City of Jan 16 16% 43,648,831 46,059, Menlo Park City of Dec 15 16% 46,632,810 68,862, Menlo Park City of Nov 15 16% 58,149,818 90,311,
261 April 2017 SWRCB Water Supplier Reporting Data BAWSCA Agencies DRAFT FOR INTERNAL USE ONLY Supplier Name Reporting Month State mandated Conservation Standard (Jun 2015 Mar 2017) *Adjusted Mar 16 *Revised Jun 16 *Tentative Mar 17 *Rescinded Apr 17 CALCULATED Total Monthly Potable Water Production Reporting Month Gallons (Values calculated by Water Board staff. REPORTED Total Monthly Potable Water Production Reporting Month REPORTED Monthly Ag Use Reporting Month; converted to gallons.) CALCULATED Total Monthly Potable Water Production 2013 Gallons (Values calculated by Water Board staff. REPORTED Total Monthly Potable Water Production 2013 REPORTED Monthly Ag Use 2013; converted to gallons.) CALCULATED R GPCD Reporting Month (Values calculated by Water Board staff using methodology available at aterrights/water_issues/programs/ drought/docs/ws_tools/guidance_ estimate_res_gpcd.pdf) Menlo Park City of Oct 15 16% 86,361, ,020, Menlo Park City of Sep 15 16% 81,389, ,592, Menlo Park City of Aug 15 16% 86,102, ,350, Menlo Park City of Jul 15 16% 96,691, ,169, Menlo Park City of Jun 15 16% 77,956, ,174, Menlo Park City of May 15 NULL 86,865, ,062, Menlo Park City of Apr 15 NULL 78,671,127 86,774, Menlo Park City of Mar 15 NULL 63,983,875 76,526, Menlo Park City of Feb 15 NULL 56,618,556 60,699, Menlo Park City of Jan 15 NULL 63,572,447 46,059, Menlo Park City of Dec 14 NULL 47,123,532 68,862, Menlo Park City of Nov 14 NULL 85,206,857 90,311, Menlo Park City of Oct 14 NULL 83,573, ,020, Menlo Park City of Sep 14 NULL 81,598, ,592, Menlo Park City of Aug 14 NULL 112,931, ,350, Menlo Park City of Jul 14 NULL 122,845, ,169, Menlo Park City of Jun 14 NULL 115,624, ,174, North Coast County Water District Apr 17 0% 65,658,764 97,187, North Coast County Water District Mar 17 0% 62,104,769 70,194, North Coast County Water District Feb 17 0% 56,823,522 57,294, North Coast County Water District Jan 17 0% 62,180,322 61,671, North Coast County Water District Dec 16 0% 61,658,930 81,137, North Coast County Water District Nov 16 0% 62,191,019 63,449, North Coast County Water District Oct 16 0% 66,105,351 71,109, North Coast County Water District Sep 16 0% 71,420,260 84,956, North Coast County Water District Aug 16 0% 72,203, ,482, North Coast County Water District Jul 16 0% 71,550, ,032, North Coast County Water District Jun 16 0% 71,034,265 97,643, North Coast County Water District May 16 8% 69,812, ,308, North Coast County Water District Apr 16 8% 61,769,642 97,187, North Coast County Water District Mar 16 8% 56,920,769 70,194, North Coast County Water District Feb 16 8% 52,817,936 57,294, North Coast County Water District Jan 16 8% 50,043,927 57,294, North Coast County Water District Dec 15 8% 66,320,790 82,264,
262 April 2017 SWRCB Water Supplier Reporting Data BAWSCA Agencies DRAFT FOR INTERNAL USE ONLY Supplier Name Reporting Month State mandated Conservation Standard (Jun 2015 Mar 2017) *Adjusted Mar 16 *Revised Jun 16 *Tentative Mar 17 *Rescinded Apr 17 CALCULATED Total Monthly Potable Water Production Reporting Month Gallons (Values calculated by Water Board staff. REPORTED Total Monthly Potable Water Production Reporting Month REPORTED Monthly Ag Use Reporting Month; converted to gallons.) CALCULATED Total Monthly Potable Water Production 2013 Gallons (Values calculated by Water Board staff. REPORTED Total Monthly Potable Water Production 2013 REPORTED Monthly Ag Use 2013; converted to gallons.) CALCULATED R GPCD Reporting Month (Values calculated by Water Board staff using methodology available at aterrights/water_issues/programs/ drought/docs/ws_tools/guidance_ estimate_res_gpcd.pdf) North Coast County Water District Nov 15 8% 56,166,732 63,449, North Coast County Water District Oct 15 8% 73,450,473 88,647, North Coast County Water District Sep 15 8% 58,725,070 84,956, North Coast County Water District Aug 15 8% 76,845, ,482, North Coast County Water District Jul 15 8% 77,707, ,032, North Coast County Water District Jun 15 8% 78,060,717 97,643, North Coast County Water District May 15 NULL 59,165,673 70,859, North Coast County Water District Apr 15 NULL 72,516,156 74,991, North Coast County Water District Mar 15 NULL 55,681,995 58,661, North Coast County Water District Feb 15 NULL 70,310,151 76,254, North Coast County Water District Jan 15 NULL 53,539,574 57,294, North Coast County Water District Dec 14 NULL 71,237,735 81,441, North Coast County Water District Nov 14 NULL 61,261,714 75,578, North Coast County Water District Oct 14 NULL 78,407,813 88,647, North Coast County Water District Sep 14 NULL 85,532,260 84,956, North Coast County Water District Aug 14 NULL 96,039, ,482, North Coast County Water District Jul 14 NULL 94,909, ,032, North Coast County Water District Jun 14 NULL 102,094,878 97,643, Millbrae City of Apr 17 0% 48,556,052 54,843, Millbrae City of Mar 17 0% 42,395,096 55,337, Millbrae City of Feb 17 0% 42,101,112 50,816, Millbrae City of Jan 17 0% 47,746,660 45,515, Millbrae City of Dec 16 0% 49,576,395 65,444, Millbrae City of Nov 16 0% 46,665,725 73,323, Millbrae City of Oct 16 0% 62,575,294 77,137, Millbrae City of Sep 16 0% 80,357,984 93,246, Millbrae City of Aug 16 0% 69,010,036 88,809, Millbrae City of Jul 16 0% 75,146,306 94,211, Millbrae City of Jun 16 0% 66,193,621 80,380, Millbrae City of May 16 16% 52,124,260 76,072, Millbrae City of Apr 16 16% 51,953,704 54,843, Millbrae City of Mar 16 16% 46,715,844 55,337, Millbrae City of Feb 16 16% 40,347,446 50,816, Millbrae City of Jan 16 16% 51,938,743 45,515,
263 April 2017 SWRCB Water Supplier Reporting Data BAWSCA Agencies DRAFT FOR INTERNAL USE ONLY Supplier Name Reporting Month State mandated Conservation Standard (Jun 2015 Mar 2017) *Adjusted Mar 16 *Revised Jun 16 *Tentative Mar 17 *Rescinded Apr 17 CALCULATED Total Monthly Potable Water Production Reporting Month Gallons (Values calculated by Water Board staff. REPORTED Total Monthly Potable Water Production Reporting Month REPORTED Monthly Ag Use Reporting Month; converted to gallons.) CALCULATED Total Monthly Potable Water Production 2013 Gallons (Values calculated by Water Board staff. REPORTED Total Monthly Potable Water Production 2013 REPORTED Monthly Ag Use 2013; converted to gallons.) CALCULATED R GPCD Reporting Month (Values calculated by Water Board staff using methodology available at aterrights/water_issues/programs/ drought/docs/ws_tools/guidance_ estimate_res_gpcd.pdf) Millbrae City of Dec 15 16% 48,360,810 65,444, Millbrae City of Nov 15 16% 58,145,330 73,323, Millbrae City of Oct 15 16% 57,708,468 77,137, Millbrae City of Sep 15 16% 64,992,997 93,246, Millbrae City of Aug 15 16% 68,600,104 88,809, Millbrae City of Jul 15 16% 64,563,616 94,211, Millbrae City of Jun 15 16% 57,654,608 80,380, Millbrae City of May 15 NULL 60,723,117 76,072, Millbrae City of Apr 15 NULL 54,653,423 54,843, Millbrae City of Mar 15 NULL 48,268,800 55,337, Millbrae City of Feb 15 NULL 46,038,857 50,816, Millbrae City of Jan 15 NULL 51,911,813 45,515, Millbrae City of Dec 14 NULL 43,850,057 65,444, Millbrae City of Nov 14 NULL 62,128,706 73,323, Millbrae City of Oct 14 NULL 70,595,158 77,137, Millbrae City of Sep 14 NULL 78,600,810 93,246, Millbrae City of Aug 14 NULL 89,401,932 88,809, Millbrae City of Jul 14 NULL 77,528,852 94,211, Millbrae City of Jun 14 NULL 83,211,055 80,380, Palo Alto City of Apr 17 0% 283,006, ,624, Palo Alto City of Mar 17 0% 218,574, ,321, Palo Alto City of Feb 17 0% 154,778, ,406, Palo Alto City of Jan 17 0% 161,277, ,684, Palo Alto City of Dec 16 0% 174,049, ,941, Palo Alto City of Nov 16 0% 203,696, ,489, Palo Alto City of Oct 16 0% 243,430, ,154, Palo Alto City of Sep 16 0% 308,900, ,450, Palo Alto City of Aug 16 0% 383,010, ,841, Palo Alto City of Jul 16 0% 365,572, ,968, Palo Alto City of Jun 16 0% 383,062, ,468, Palo Alto City of May 16 24% 315,517, ,394, Palo Alto City of Apr 16 24% 254,631, ,624, Palo Alto City of Mar 16 24% 237,276, ,266, Palo Alto City of Feb 16 24% 178,158, ,406,
264 April 2017 SWRCB Water Supplier Reporting Data BAWSCA Agencies DRAFT FOR INTERNAL USE ONLY Supplier Name Reporting Month State mandated Conservation Standard (Jun 2015 Mar 2017) *Adjusted Mar 16 *Revised Jun 16 *Tentative Mar 17 *Rescinded Apr 17 CALCULATED Total Monthly Potable Water Production Reporting Month Gallons (Values calculated by Water Board staff. REPORTED Total Monthly Potable Water Production Reporting Month REPORTED Monthly Ag Use Reporting Month; converted to gallons.) CALCULATED Total Monthly Potable Water Production 2013 Gallons (Values calculated by Water Board staff. REPORTED Total Monthly Potable Water Production 2013 REPORTED Monthly Ag Use 2013; converted to gallons.) CALCULATED R GPCD Reporting Month (Values calculated by Water Board staff using methodology available at aterrights/water_issues/programs/ drought/docs/ws_tools/guidance_ estimate_res_gpcd.pdf) Palo Alto City of Jan 16 24% 172,575, ,777, Palo Alto City of Dec 15 24% 202,511, ,828, Palo Alto City of Nov 15 24% 167,451, ,241, Palo Alto City of Oct 15 24% 232,110, ,234, Palo Alto City of Sep 15 24% 290,560, ,164, Palo Alto City of Aug 15 24% 306,808, ,520, Palo Alto City of Jul 15 24% 300,817, ,700, Palo Alto City of Jun 15 24% 331,975, ,645, Palo Alto City of May 15 NULL 262,000, ,147, Palo Alto City of Apr 15 NULL 300,811, ,180, Palo Alto City of Mar 15 NULL 284,942, ,266, Palo Alto City of Feb 15 NULL 225,353, ,406, Palo Alto City of Jan 15 NULL 203,086, ,777, Palo Alto City of Dec 14 NULL 216,546, ,828, Palo Alto City of Nov 14 NULL 177,283, ,241, Palo Alto City of Oct 14 NULL 303,268, ,154, Palo Alto City of Sep 14 NULL 345,555, ,164, Palo Alto City of Aug 14 NULL 365,887, ,520, Palo Alto City of Jul 14 NULL 440,684, ,700, Palo Alto City of Jun 14 NULL 408,333, ,645, Redwood City City of Apr 17 0% 252,207, ,392, Redwood City City of Mar 17 0% 187,077, ,337, Redwood City City of Feb 17 0% 173,283, ,540, Redwood City City of Jan 17 0% 193,806, ,818, Redwood City City of Dec 16 0% 166,631, ,054, Redwood City City of Nov 16 0% 191,378, ,596, Redwood City City of Oct 16 0% 205,976, ,394, Redwood City City of Sep 16 0% 266,395, ,548, Redwood City City of Aug 16 0% 270,687, ,438, Redwood City City of Jul 16 0% 306,366, ,138, Redwood City City of Jun 16 0% 300,994, ,315, Redwood City City of May 16 8% 257,425, ,698, Redwood City City of Apr 16 8% 206,208, ,392, Redwood City City of Mar 16 8% 209,479, ,337,
265 April 2017 SWRCB Water Supplier Reporting Data BAWSCA Agencies DRAFT FOR INTERNAL USE ONLY Supplier Name Reporting Month State mandated Conservation Standard (Jun 2015 Mar 2017) *Adjusted Mar 16 *Revised Jun 16 *Tentative Mar 17 *Rescinded Apr 17 CALCULATED Total Monthly Potable Water Production Reporting Month Gallons (Values calculated by Water Board staff. REPORTED Total Monthly Potable Water Production Reporting Month REPORTED Monthly Ag Use Reporting Month; converted to gallons.) CALCULATED Total Monthly Potable Water Production 2013 Gallons (Values calculated by Water Board staff. REPORTED Total Monthly Potable Water Production 2013 REPORTED Monthly Ag Use 2013; converted to gallons.) CALCULATED R GPCD Reporting Month (Values calculated by Water Board staff using methodology available at aterrights/water_issues/programs/ drought/docs/ws_tools/guidance_ estimate_res_gpcd.pdf) Redwood City City of Feb 16 8% 186,538, ,540, Redwood City City of Jan 16 8% 158,294, ,818, Redwood City City of Dec 15 8% 168,670, ,054, Redwood City City of Nov 15 8% 186,597, ,596, Redwood City City of Oct 15 8% 217,791, ,394, Redwood City City of Sep 15 8% 252,728, ,548, Redwood City City of Aug 15 8% 226,044, ,438, Redwood City City of Jul 15 8% 292,563, ,138, Redwood City City of Jun 15 8% 234,653, ,315, Redwood City City of May 15 NULL 234,334, ,698, Redwood City City of Apr 15 NULL 225,208, ,392, Redwood City City of Mar 15 NULL 245,515, ,337, Redwood City City of Feb 15 NULL 189,306, ,540, Redwood City City of Jan 15 NULL 193,527, ,818, Redwood City City of Dec 14 NULL 173,091, ,054, Redwood City City of Nov 14 NULL 186,719, ,596, Redwood City City of Oct 14 NULL 198,514, ,394, Redwood City City of Sep 14 NULL 250,462, ,548, Redwood City City of Aug 14 NULL 322,462, ,438, Redwood City City of Jul 14 NULL 316,816, ,138, Redwood City City of Jun 14 NULL 348,269, ,315,
266
267 Appendix K ReNUWIt BAWSCA Drought Response Analysis Technical Memorandums
268
269 Memo To: Bay Area Water Supply and Conservation Agency (BAWSCA) From: Newsha Ajami, PhD Director of Urban Water Policy Water in the West / ReNUWIt Stanford University Date: 12/6/2016 Re: BAWSCA Drought Analysis Background: In the past five years California has been experiencing a historical sever drought. Over the past three years, both the state and local government agencies have been actively trying to mitigate impacts of the drought on the state s water supply availability and reliability by implementing various short-term and long-term regulatory and fiscal measures. The most prevalent of these have been focused on water conservation and efficiency. On April 1st, 2015, Governor Jerry Brown ordered the firstever mandatory water restrictions in California, directing the State Water Resources Control Board to impose a 25 percent restriction on the state s local water supply agencies over the coming year1. Regardless of this historic effort by the governor, in the past three years, water agencies throughout the state have been implementing various active demand management strategies in the form of water conservation and public awareness campaigns. These have been supplemented by rebates and incentives for water efficient appliances and droughttolerant landscaping options. In addition, due to the severity of the drought, state, national, and international media outlets have been heavily covering California s water crisis, almost on a daily basis, which has indirectly raised public awareness and impacted water-use behavior in California and specifically in the Bay area. This project investigates how and to what extent various factors including climate, socioeconomic realities, active and passive conservation efforts, as well as media coverage of the drought have been impacting the societal response to the drought. Our research objectives include: Research Objectives: Evaluate the factors related to single family residential (SFR) water consumption for agencies with varying sociodemographic and climatic profiles Determine if media coverage of the California drought is one of those factors, and if so, to what extent can heightened reporting be used to explain variance 1
270 Evaluate if and how news media coverage is associated with changes in water use behavior among varying populations In this memo, which is the first of two for this project, we will present the data, models and some of our initial data analysis. The second memo will cover the full results, findings and conclusions. Approach: First, BAWSCA service areas were grouped based on water use and affluence, providing a basis for a comparative analysis and providing deeper insight into how media interacts with other modes of influence. Then, water demand models were generated for the entire BAWSCA region as well as for each service area grouping. Newspaper coverage was incorporated into the models, where media coverage is quantified by the volume of articles from national and state news sources about the California drought. Timeline: Water consumption patterns were assessed and modeled for ten years from July 2005 to June 2015, a period purposefully chosen to encompass two significant droughts: the drought that was not heavily covered by news media (potentially due to coinciding with the economic recession) and the 2011-current drought that has been covered by the news media at anomalously high levels. This study does not analyze water use after June 2015 as the goal was not to examine the impact of Governor Brown s mandatory water use restrictions, and instead to focus on media as a prompt for voluntary water conservation. Data: BAWSCA Data: Water consumption data was provided by BAWSCA and pre-processed by Stanford to create a database of bimonthly SFR water use per account per service area from July 2005 to June Twenty of the 28 BAWSCA service areas were evaluated in this study: two service areas- Stanford University and Guadalupe Valley MID- were excluded due to their unique customer base while six service areas - East Palo Alto, Brisbane, San Jose, Alameda, San Bruno, and Westborough- were excluded due to incomplete data availability. Yearly average monthly SFR water use and average SFR water bills were provided by BAWSCA in Annual Reports and used to calculate the annual average price for one CCF of water for a SFR customer (Figure 1). Geospatial Data: Publicly available, geospatially explicit climate data was used to calculated temperature (Figure 2), precipitation, drought index (Figure 3), median household income (Figure 4).
271 Average Bimonthly SFR Water Use Water Consumption (CCF) Burlingame CalWaterBG CalWaterMP CalWaterSSF Coastside DalyCity Estero Hayward Hillsborough MenloPark MidPeninsula Millbrae Milpitas MtnView NorthCoast PaloAlto Purissima RedwoodCity SantaClara Sunnyvale Figure 1: Bimonthly single family residential water use Temperature Seasonality and Variability in BAWSCA Agencies Average Daily Temperature (deg C) jan/feb march/april may/june july/aug sep/oct nov/dec Figure 2: Temperature seasonality and variability in BAWSCA agencies ( )
 Figure 4: Average household")
272 Figure 3: Monthly Palmer Drought Severity Index ( ) Figure 4: Average household income

273 To analyze unemployment rate (Figure 5) for the region as an economic factor, we had to use proxies for some of the agencies and utilities that we could not find the data for (Table 1). Table 1: Proxy cities for unemployment rates. Agency City of Brisbane City of Millbrae CWS Bear Gulch Coastside County Water District Westborough Water District Town of Hillsborough City of Milpitas Purissima Hills Water District Proxy City Daly City Burlingame Los Altos Pacifica South San Francisco Burlingame San Jose Los Altos Figure 5: Monthly city-level unemployment rates ( )
274 Media Data: We developed a novel web scraping technique called Articulate, to quantify drought-related articles from eight highly-circulated newspaper sources about the California Drought were extracted and tallied. The results of the Articulate were compared to proprietary databases such as Lexus Nexus and ProQuest. In both cases Articulate demonstrated to generate reliable results, and in some cases even more accurate than the proprietary databases. Initial Analysis: A policy timeline, Google search rates, and newspaper article trends (Figure 1) confirm the relationship between political actions, public awareness, and media outreach. Preliminary water demand models show that temperature, unemployment, income, and media coverage are highly significant explanatory variables of water use while price is only significant for agencies with low and medium income customers. Figure 1: Newspaper articles on the California drought Time series of water use, drought, and unemployment show distinct patterns and trends. These plots, with temperature and income analysis, also show that BAWSCA service areas are very diverse. Next Steps: Due to the significant diversity in BAWSCA s service area and its impact on water-use, we are currently working on clustering these water agencies into groups based on water use and income. The next steps on this project include:
275 Further refining our water demand model to evaluate how various climatic and socioeconomic factors have been affecting water use in the region over our study period. Evaluating if and how news media coverage is associated with changes in water use behavior among varying populations Implications: The results of this work will inform water agencies on the relative impact of various modes of influence on water consumption for agencies with varying demographic profiles, important not only for managing demand in times of drought, but also for enhancing long-term stewardship of our water supplies. This work will also provide insights into water demand behavior for diverse service areas, revealing useful insight to better understand how different populations behave, for designing conservation campaign strategies, and for more accurate demand forecasting.
276 Memo #2 To: Bay Area Water Supply and Conservation Agency (BAWSCA) From: Newsha Ajami, PhD Director of Urban Water Policy Water in the West / ReNUWIt Stanford University Date: April 19, 2017 Re: BAWSCA Drought Analysis, Phase II Background: The California drought that began in late 2011 dramatically stretched the state s water supplies as high temperatures coupled with low, infrequent precipitation events caused severe water shortages. In response, state and local government agencies implemented various shortand long-term regulatory and fiscal measures to mitigate impacts of the drought on the state s water supply availability and reliability. These actions, coupled with the anomalous severity of the drought, led state, national, and international media outlets to heavily cover California s water crisis, raising public awareness of the state s water supply shortfall. Did these unprecedented political actions, media coverage, and public interest lead to changes in water use behavior? In this memo, we present the results of our investigation on these relationships in the BAWSCA region using news media coverage as an indicator for political action and public awareness levels. We hypothesized that increased newspaper coverage about the California drought is linked to changes in residential (SFR) water demand by prompting customers to alter their water use behavior permanently, for example by replacing lawns with drought-tolerant landscaping, or temporarily, such as by letting lawns go brown, due to increased public awareness. Simultaneously, we examined how and to what extent various factors including climate, demographics, socio-economic realities, as well as media coverage of the drought impacted residential water demand over the past ten years. The objectives of this project were as follows: Construct a timeline of news media coverage about the California drought and compare coverage with corresponding political actions and public interest. Evaluate the factors related to SFR water consumption for 20 BAWSCA service areas with varying sociodemographic and climatic profiles, determine if media coverage of the California drought is one of those factors, and if so, to what extent can heightened reporting be used to explain variance. Use high resolution data from Advanced Meter Infrastructure (AMI) in the City of Redwood City to evaluate breakpoints in water use trends for SFR and Commercial- Irrigation (COMM-IRR) sectors and determine the economic, climatic, and news media contexts in which those breakpoints occurred. 1
277 In this memo, the second of two for this project, we present our findings and discuss the broader implications of our analysis. Findings: Drought News Media Coverage and Public Interest: To calculate the volume of newspaper articles, we developed and used a novel software package Articulate. Eight national, and California-based daily newspapers were chosen based on circulation: Wall Street Journal, New York Times, USA Today, Los Angeles Times, Sacramento Bee, Orange County Register, San Diego Union-Tribune, and San Francisco Chronicle (captured by SFGate, the free online sister-site of the SF Chronicle). The keywords used in the search bar were California drought, California droughts, drought in California, droughts in California and a combination of California and drought(s), and a water-related term "water conservation", rainfall, snowpack, climate, weather, aqueducts, reservoirs, aqueduct, reservoir, rain and snow, or snow and rain to exclude irrelevant articles (for example, California sports team experiences a winning drought ). A time series plot shows that news media coverage of the drought had four distinct peaks that are linked directly to political or significant weather events (Figure 1). The dataset also shows that the drought was not widely covered by the media, potentially due to other political events such as the great recession and presidential election. Accordingly, since media heavily covered the most recent but not the prior drought, the early drought period provides a base-case for water use behavior with heavy and with limited media exposure. Another interesting finding is that while the most recent California drought started in late 2011, heavy news media coverage did not begin until the beginning of 2014 when the Governor declared the second drought state of emergency, highlighting the intrinsic relationship between political action and its widespread information through news media as important drivers of water use behavior. 2
278 Figure 1: Newspaper articles about the California Drought and drought classification as represented by the Palmer Drought Severity Index (PDSI). Prominent drought events are as follows: [1] February 2009-Governer Schwarzenegger declares Drought State of Emergency; [2] January Governor Brown declares a Drought State of Emergency; [3] July Outdoor Water Conservation Regulation; [4] December Rain Event; [5] April Mandatory Statewide Water Use Restrictions Yet, is this media coverage truly indicative of enhanced public awareness and education? To answer this question, we further investigated the relationship between mass media and public interest using Google Trends to represent public interest in the California drought. Google Trends is a free online tool that shows how often a word or term is searched for over a certain period and has been shown to be a useful tool in investing public behavior. The number of searches is provided in relative terms, with the period with the most searches for that topic having a value of 100. For this comparison, we extracted data for how often the term California Drought was entered into the Google search bar each month over the period of July 2005 June 2015 in the San Francisco Bay Area region of California. The number of newspaper articles was transformed to a scale to match the relative terms of the Google searches. News media coverage and public interest was correlated at 0.89, indicating a strong relationship between public interest and newspaper articles (Figure 2). Examining a time series of the two variables reveals that peaks in public interest and news media occurred at the same time, with those peaks matching significant political actions and/or storm events and further confirming the connection between newspaper coverage and public awareness. 3
279 Figure 2: Public Interest as measured by Google Searches and News Media Coverage of the California Drought. The black line in the inset figure is 1:1. SFR Water Demand Modeling: Because water demand models often exhibit regional differences, we first grouped the 20 BAWSCA service areas examined in this study (as described in the first memo) based on two dominant characteristics of each agency average bimonthly water consumption per account and median household income (Figure 3A). Three clusters were generated: Cluster A service areas have high income, high water use profiles, Cluster B service areas have medium income, medium water use profiles, and Cluster C service areas have low income, medium water use profiles. Clustering service areas can provide insight into how various factors are related to water use for different groups, revealing useful insight to better understand how different populations behave, for designing conservation campaign strategies, and for predicting behavior. Regional water demand modeling can also benefit from clustering as it addresses the challenge of scale aggregate water demand models that assume homogeneity can mask important water use relationships while individual agency or sub-agency models can create data management issues. Examining other demographic variables provides further insight into cluster characteristics (Figure 3B). 4
 algorithm results and (B) cluster demographic characteristics Next, we modeled single-family residential water consumption in the 20 BAWSCA service areas using geospatially explicit data over a")
280 A B Figure 3: K-means clustering of service areas. (A) algorithm results and (B) cluster demographic characteristics Next, we modeled single-family residential water consumption in the 20 BAWSCA service areas using geospatially explicit data over a 10-year time span from 2005 to 2015 (Table 1). Volume of newspaper articles was significant in all four models. The coefficient in each model was between and , indicating that an increase of 100 drought-related articles in a bimonthly period was associated with a decrease in SFR water use per capita of 5
281 10% 16%. This finding confirms that heightened media coverage and corresponding increased public engagement did indeed play a role in residential water use behavior during the most recent drought. Temperature was significant at and positive in all four models, which conforms to generally well-established findings in the literature. We also find that unemployment is highly significant and negative in all models, indicating that fluctuating unemployment rates did indeed play a role in water use over the decade. Precipitation was not significant in any of the models, matching studies that show temperature as more explanatory of water use than rainfall. Palmer Drought Severity Index (PDSI) was significant in the Cluster B models, but not the high Cluster A or Cluster C model. This model result could indicate that high-income customers may be less responsive to long-term supply shortfalls while lower-income customers may have more hardened demand with generally low baseline water use. Price was not significant in the Cluster A model, matching previous findings that lower income households respond to price more than higher income households. Metrics were calculated to evaluate model performance and compare models. The Cluster A model had the highest adjusted-r 2 of 0.79 while Cluster B and Cluster C models had similar adjusted-r 2 of 0.67 and 0.68 respectively, and the pooled model had the lowest adjusted-r 2 of Cluster B and Cluster C had the lowest root mean squared error (RMSE) values, mimicking the overall lower water use of these service areas. The percent bias (PBIAS) for all models was negative, indicating that each model consistently underestimated water demand, with the pooled being the most biased of all four models. Akaike Information Criterion (AIC) values, as well as adjusted-r 2 values showed that the three cluster models outperformed the pooled model, emphasizing the importance of creating data-driven models tailored to service areas based on their varying populations and water use behavior. A counterfactual scenario was developed using the same models as above but without news media coverage as a covariate. ANOVA showed a significant difference between all 4 model pairs (one model with media and one without), rejecting the null hypothesis that media does not explain additional variance in SFR water use. For each model data subset, an additive seasonal decomposition was applied to find the trend component of (i) average water demand; (ii) predicted demand by models with media; and (iii) predicted demand by models without media (Fig. 2). In every scenario, especially during the drought periods, water demand predicted by models with media followed the observed water demand trends more closely than demand as predicted by the models without media, further demonstrating model improvement when media was included. The divergence is particularly pronounced after 2014 when the models without media forecast increasing demand, but the models with media correctly capture the downward trend. 6
282 Table 1: Model outputs. Green shading indicates the variable explains variations in water demand and red shading indicates it does not. Pooled Model Cluster A Model High Income, High WU Cluster B Model Medium Income, Medium WU Cluster C Model Low Income, Medium WU Model Information Number of Observations 1, F Statistic *** (df = 7; 1192) *** (df = 7; 172) *** (df = 7; 652) Coefficients Intercept 1.335*** 1.999*** 1.696*** 2.398*** Temperature (deg C) 0.086*** 0.135*** 0.076*** 0.057*** Precipitation (mm) *** (df = 7; 352) Palmer Drought Severity *** * Index Average Price (2015$/CCF) *** *** *** Unemployment Rate (%) *** ** *** *** Median Household Income 0.009*** 0.001* 0.005*** 0.002** (2015$/$1000) Number of Newspaper Articles about the California Drought from Eight Sources *** *** *** *** Model Performance Metrics adj-r RMSE PBIAS -7.0% -2.1% -2.0% -1.3% AIC Notes: *p<0.05; **p<0.01; ***p<
 demonstrates the performance of the pooled models compared to measured demand while (B)(C)(D) show model performance for each service area cluster.")
 and SFR customers in the city of Redwood City, CA (a BAWSCA")


283 Figure 4: Actual and predicted water use trends in BAWSCA. (A) demonstrates the performance of the pooled models compared to measured demand while (B)(C)(D) show model performance for each service area cluster. Red shading indicates dry periods and blue shading indicates wet periods, as defined by PDSI. Redwood City AMI Breakpoint Analysis: Next, we examined customer-level smart meter data for commercial irrigation (COMM- IRR) and SFR customers in the city of Redwood City, CA (a BAWSCA member agency) from July 2010 to December 2015 to identify changes in water use patterns at a fine temporal scale across two sectors. We constructed a time series of weekly water demand and applied an additive seasonal decomposition to unpack water demand trends and patterns. A breakpoint algorithm was then used to discover structural changes water use trends of each sector. We compared these breakpoints to drought conditions, as defined by the PDSI, and news media coverage time series to illuminate the context in which breakpoints occurred. After pre-processing and aggregating daily data to a weekly time step an additive seasonal decomposition method was applied to parse the time series into seasonal, trend, and residual components. Then, a breakpoint algorithm was used to detect shifts in the trend components to determine when demand changes occurred in single-family residential (SFR) and commercial irrigation (COMM-IRR) sectors (Figure 5). Results shows that all slopes are 8