Changing the dialogue around solid waste and recycling programs
|
|
|
- Vivien McGee
- 5 years ago
- Views:
Transcription


1 Changing the dialogue around solid waste and recycling programs Kansas Solid Waste Management Conference Susan Robinson October 3, 2018


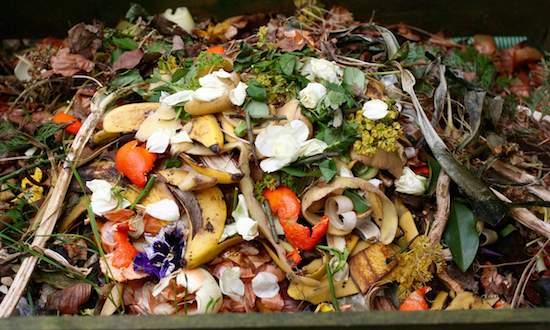
2 Waste Management Recycling Overview WM CORe: Urban Solution to Food Waste WM s Recycling/Composting Tonnages Material Tonnage Paper/OCC 8,925,573 Mixed Organics 2,694,334 Glass 766,038 C&D/Wood 100,982 Total all materials: Material Tonnage Metals 525,473 Plastics 416,160 E-waste/Other 117,618 Fly Ash 1,177,618 14,723, compost sites, 4 CORe, facilities, 3 chipping operations WM is a net reducer of GHG emissions
3 Our world: What has changed?

4 China s new import policies are changing recycling China consumed 50% of all paper and plastic recycled in the world 13.2 millions tons per year of recyclables are now competing for alternative markets. Mixed Paper and Mixed Plastics are banned from import into China. The 0.5% contamination limit on all other recyclables makes it difficult to sell into China China will ban all imports by 2020 Reduced overall demand, supply surplus, increased quality requirements = increased processing cost and low commodity values for paper

5 Top Ten U.S. Exports Recyclables are the largest U.S export item by volume The U.S. is impacted by trade interruptions with its investment in the recycling industry and other products We continue to export large volumes, but the end markets are changing
 27% of our fiber went into China in 2017 5% in Q1 2018 <3% in Q3 2018 2018 It s too early to know what the impacts of the new tariffs will be")
6 Following the Path of Our Commodities Destination of fiber recyclables 2017 vs Recyclers are continuing to build alternative markets to move material. India, SE Asia, Europe and domestic mills are all being used by WM s marketing team. WM is the 7 th largest exporter of all goods (by volume from the U.S. (2018) 27% of our fiber went into China in % in Q <3% in Q It s too early to know what the impacts of the new tariffs will be


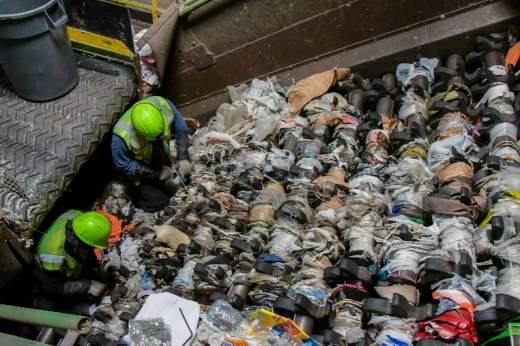
7 Recycling Supply and Demand Recycling programs have a fundamental economic supply/demand problem Even though demand has significantly declined, inelastic supply continues to flow in at high rates WM manages 40k tons per day Page 7

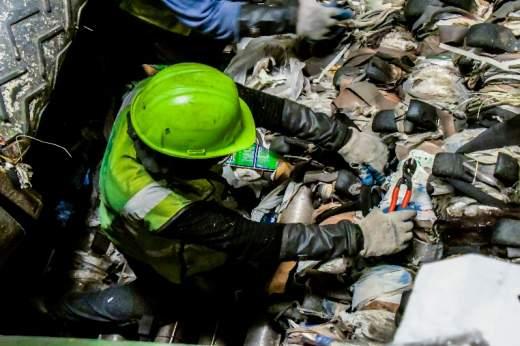
8 Contamination in the inbound stream Recycling Residue Trend Single Stream residue rates ~24% due in part to cleaning outbound material to meet the new standards Page 8
9 Recycling in September of 2018 What hasn t changed: People still want to recycle & do the right thing States & local government have established recycling bans, goals & mandates 1 in 4 items placed in a recycling cart is not recyclable! What has changed: Markets for Mixed Paper and Mixed Plastics are limited Quality requirements are strict Operating costs have increased Recycling to provide feedstock for new products has devolved to aspirational, feel good recycling. The Right Thing must be reframed not all materials can be recycled 0.5% % Contamination enforced by China >25% Avg. contamination % in our MRFs Every ton of material collected includes ~450 lbs of contaminates; markets expect <10 lbs
10 10 What does this mean for recycling?


11 It s time to re-write the recycling playbook It is time to rethink/reset recycling programs. Which materials offer the best bang for the buck? As the cost of recycling increases, should we be looking more closely at the benefits of waste reduction? Environmental benefits are our goal WHY do we recycle and WHAT should we recycle?


12 12 Why do we recycle? Recycling conserves resources by creating secondary feedstocks for industry Conserving virgin resources by substituting recycled feedstocks for raw materials is an recycling environmentally good thing to do Recycling makes business sense when done correctly


13 Collection is not recycling Recycling doesn t happen until a material displaces virgin resources Unless materials becomes a feedstock for a new product, it increases cost and environmental burden.


14 14 Impact on MRFs The changing waste stream will continue to stress MRFs Supply is inelastic. MRFs expected to recycle curbside materials regardless of end markets. Consumers expect free recycling Consumers expect whatever they put into their carts to be recycled There is little understanding of technical/economic limits of recycling Recyclables do not create an economic or environmental benefit until they are sold as commodities and manufactured into products.


15 This is not recycling
16 Where do we go now?
?")


17 What is Sustainable Materials Management (SMM)? SMM Is an approach to serving human needs by using/reusing resources productively and sustainably throughout their life cycles, generally minimizing the amount of materials involved and all associated environmental impacts. Making Visible the Invisible Kurt Myers, REI Page 17
18 EPA s recommendation for Lifecycle Thinking Lifecycle information offers greater visibility into the benefits of how we manage and use products and packaging through their entire life. Lifecycle thinking helps us to: Prioritizing and strategic planning. Challenging preconceived ideas about how materials can and should be managed avoiding unintended consequences. Find the best use/place for the material. It s time for a paradigm shift to facilitate the success of recycling and materials management


19 19 Not all materials are created equal Products and packages all have different environmental impacts
20 The recycling stream as a subset of MSW MSW Stream MRF Materials 1.9%, PET 2.6%, HDPE 0.2%, Mixed Plastics 20.3%, Mixed Paper 0.3%, Steel 0.3%, Aluminum 24.0%, Residue 73.0%, Traditional MSW Traditional Recycling 27.0% 29.5%, OCC 20.9%, Glass


21 Residential Recyclables: Tons vs Emissions TONS GHG Emissions Reduction Glass: 20.9% Tons OCC: 29.5% Tons PET: 1.3% GHG HDPE: 1.4% GHG Steel: 0.3% GHG Aluminum: 1.6% GHG Residue: -0.3% GHG Glass: 3.7% GHG Mixed Plastics: 0.0% GHG OCC: 52.1% GHG Residue: 24.0% Tons Aluminum: 0.3% Tons Steel: 0.3% Tons PET: 1.9% Tons HDPE: 2.6% Tons Mixed Plastics: 0.2% Tons Mixed Paper: 20.3% Tons Mixed Paper: 39.8% GHG The same materials, but different impacts from tons measured versus GHG emissions reduction potential: 91% of CO2 benefits are from OCC and Mixed paper. Plastic is 4.5% & Glass is 3%.
22 Plastics in the Recycling Stream Recycling Stream 95.3% 96 % of plastics is HDPE & PET HDPE 2.6% Plastic 4.7% Mixed Plastic Residue 0.14% PP 0.06% PET 1.9% 3-7 Mix 0.2% PP Mixed Plastic Residue Plastics is 4.7% of the MRF Stream by weight 4.5% of the GHG emissions reductions GHG Emissions reduction associated with plastics is 2.7% of the entire recycling stream Recycling Stream PET HDPE 3-7 Mix PP Mixed Plastic Residue Mixed Plastic (3-7) is 0.2% of the recycling stream including residue.


23 Value of recyclables: $$ vs GHG emission reduction Negative Commodity Revenue 45% Mass Mass Basis Negative Commodity Revenue 3 % GHG Emissions Reduction GHG Basis Positive Commodity Revenue 55 % Mass Positive Commodity Revenue 97% GHG Emissions Reduction The 55% of the stream with the positive commodity value contributes to 97% of the emissions reductions The 45% of recycling stream with a negative economic value contributes only 3% of the GHG emission reductions Blended Material value ~(-48.2%) from 2017 to 2018 creating a challenging economic environment for recyclers and their customers.
24

25 U.S. Recycling Goals and Rates (State by State) State Goal Actual CA 75% 44% CT 60% 34% FL: 75% 42% MN 35/75% 46% NJ 65% 42% OR 55% 51% PA 25% 35% RI 70% 25% VT 50% 35% WA 50% 50% City FW Ban/mandates
26 Rethinking Waste
27 The Growing Trend Towards SMM Oregon. Farthest along in implementing SMM Maryland. Governor s executive order changed 85% recycling goal to SMM. A task force is developing SMM goals/plan. Florida. University of Florida has developed a robust model for shifting from 75% recycling goal to 75% emissions reduction goal using SMM principles. Connecticut. A reference to SMM language in the state s plan. Washington. Language/discussion around shifting to SMM. Ontario, Canada. SMM study by York University used to modify its curbside recycling program. Their One Gigaton project would reduce Walmart GHG emissions by a Gigaton. With the exception of Oregon (and perhaps Walmart), these efforts are early and generally not well-defined. However, the dialogue is growing as cities, states and companies see the importance of using lifecycle analysis to prioritize programs.


28 A new way of looking at goals and metrics Step 1: Step 2: Step 3: Step 4: Waste Characterization Complete waste characterization study Evaluate Environmental Impact Use waste characterization and LCA to prioritize goals based on environmental benefits Set Goals Develop material specific waste reduction & recovery goals to maximize environmental benefit Develop Programs and Measure in tons Convert goals to material specific tons to measure reduction and recovery
29 What changes do we need to make? 1. Prioritize and measure reduction Tons generated = Tons reduced/per capita = tons recycled + tons composted + disposed tons recycled + tons composted/tons generated population 2. Prioritize environmental outcomes (actual benefits) 3. Require design optimization for life cycle impacts of both products and packaging (including EoL outcomes, but not exclusively) 4. Implement and support policies that reduce environmental burdens (not just via recycling or composting) 5. Recycle smartly based on environmental benefit and viable secondary market. Recycling is a critical part of materials management and it has to done well to reduce environmental impacts. 29
30 Summary We are at a decision point for many of our recycling programs. This offers an opportunity to use science and data to prioritize our efforts for the best environmental results. Prioritizing materials in our programs allows for more focused education, reduced cost and optimized value - all while maximizing environmental benefits. It s time to change customer attitudes and behavior: Reduction first! Recycle paper, cardboard, bottles & cans Recycling is one tool in the tool box. Recycling more stuff is not the goal. Reducing the environmental impacts of the materials we manage is the goal. It s time to think bigger, and more broadly about the environment.
31 Thank you!