Measurements: Climate Change (and so much more.)
|
|
|
- Ralph Horton
- 5 years ago
- Views:
Transcription
1 WMO GAW Greenhouse Gas Measurements: Quantifying i the Main Mi Driver Di of Climate Change (and so much more.) Ed Dlugokencky k 1 and Oksana Tarasova 2 1 NOAA ESRL GMD 2 WMO Global Atmosphere Watch
2 Role of GAW GHG in GCOS GAW GHG program measures 3 ECVs CO 2, CH 4, and N 2 O 93% of increased RF since 1990 GAW CO 2, CH 4, and N 2 O networks are Baseline and Comprehensive Global Observing Networks of GCOS Globally distributed Long term, high quality, h calibrated lb observations
3 GAW: Long Term, Climate Quality Observations of LLGHGs Central Calibration Laboratories Common Standard Scales Centers to ensure data quality Comparisons of standards and station audits World Data Center: archive and distribute Community committed to quality Si Science driven, di quality objectives and recommendations Comparisons of measurements
: Water vapour and carbon dioxide (CO 2 ) are the major greenhouse gases (GHGs).")

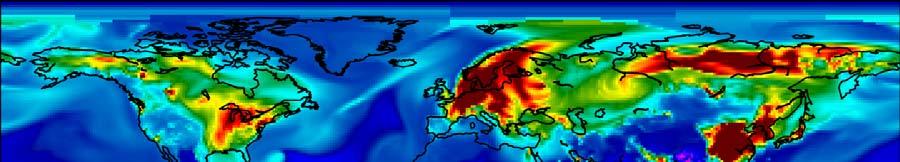
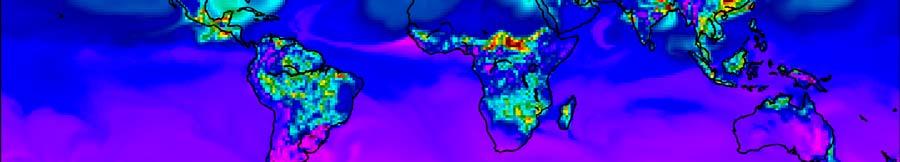
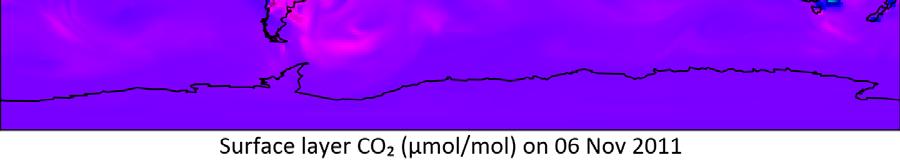
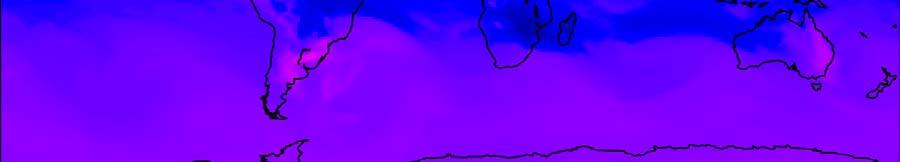
4 GAW GHG: Products GHG Bulletins (summary of LLGHG observations) Role of H 2O and clouds in climate change (No. 11): Water vapour and carbon dioxide (CO 2 ) are the major greenhouse gases (GHGs). CO 2 is the main driver of climate change. Water vapour changes largely happen as a response to the change in CO 2. GHG Trends (CO 2 and CH 4 ): Hosted by NOAA Data packages Assimila on systems Fluxes/abundances
5 Radiative Forcing: 2.98 W m 2 in 2015 (NOAA AGGI) What are impacts of reduced emissions on RF?
6 Emissions = d(ghg)/dt + (GHG)/τ Simple case: SF 6, τ = yr RF (2015) = 4.9 mw m 2 GWP 100 = 17,400
7 Globally averaged CH 4 and δ 13 C(CH 4 )
8 Source Tg CH 4 yr 1 Wetlands 12.9 ± 1.1 Biomass Burning 0.5 ± 0.1 Agriculture + Waste 1.1 ± 0.4 Fossil Fuel 6.5 ± 3.0 Other 1.9 ± 2.3 Total 23.1 ± Economic collapse in fsu
9 Budget of fossil fuel CO 2 emissions: Fossil fuels Partition sink between ocean and terrestrial biosphere using measurements of atmospheric O 2 /N 2.

10 Global National Estimates of ODS emissions: CCl 4 Global CCl 4 Emissions: Top down not consistent with production/use balance. US CCl 4 Emissions: Inventory underestimates actual emissions by factor of ~30. (Hu et al., PNAS, 2016) US For more: Friday, 11:45, presentation on IG 3 IS by Diane Stanitski
11 Take Away Points GAW in situ climate quality observations provide key, irrefutable constraints Current network suitable to constrain budgets at large spatial scales Increased networkdensity and improved transport models necessary for policy relevant scale emissions estimates
12 Future Ensure internal consistency among data contributed by partners Encourage GAW participants to maintain a database managementstrategy Expand the in situ LLGHG measurement network (tropics and climate sensitive areas) Aid validation of GHG retrievals from satellites Encourage the development of improved atmospheric transport models
13 Extra slides
14 Propagation of standard scales by CCL: Differences between initial and subsequent calibrations more than 1 year later
15 Lifetime 9.3 yr [CH 4 ](t) = [CH 4 ] ss ([CH 4 ] ss [CH 4 ] 0 )e t/τ
16 Emissions = d[ch 4 ]/dt + [CH 4 ]/ Lifetime ( ) = 9.1 yr Trend = 0 ±0.6 Tg CH 4 yr 1 Average Emissions = 551 ±15 Tg CH 4
17 >95% of RF from 5 gases.
18 What do we learn from GAW GHG measurements? Radiative at forcing: oc 2.94 W m 2 in 2014 (NOAA AGGI) Multi tracer constraint on sources and sinks O 2 2/ /N 2 CO 2 sink δ 13 C(CH 4 ) changing CH 4 budget Atmospheric constraint on emission inventories like dieting without weighing oneself Verify emissions mitigation (Montreal Protocol) How are GHG budgets changing? Climate feedbacks?
19 Remote Sensing Never calibrated, only evaluated Vertical profiles; Aircore (TCCON insufficient) Sensordegradationover over time Potential biases (e.g., land ocean) Short deployment tfor satellites Retrieve total column; strongest signals at surface Different retrieval versions give very different results (e.g., in inversions)
20


21


22
23 CO 2 and CH 4 Trends Webpage Contribution to GAW by NOAA Updated monthly Plots of global laverages Table of annual increases Table of globally averaged annual and monthly means
24 GAW GHG Network
25 GCOS Networks Baseline global network: These consist of a limited number of selected locations that are globally distributed and provide long term high quality data records of key global climate variables as well as calibration for more comprehensive networks. They are usually funded dfrom long term operational budgets; Comprehensive global network: These consist of the relatively lti l dense global land regional l( (and, in some cases national) observing networks which are the basic building blocks of GCOS. The comprehensive networks provide observations at the detailed space and time scale required to fully describe the nature, variability and change of a specific climate variable. They are almost always funded from long term operational budgets