Optimizing Recharge in the Pauba Valley
|
|
|
- Garey Wilson
- 5 years ago
- Views:
Transcription

1 ABSTRACT & POWERPOINT PRESENTATION Optimizing Recharge in the Pauba Valley Daniel J. Craig Senior Hydrgeologist Alameda, California Managed Aquifer Recharge Symposium January 25-26, 2011 Irvine, California Symposium Organizers: National Water Research Institute Orange County Water District Water Research Foundation
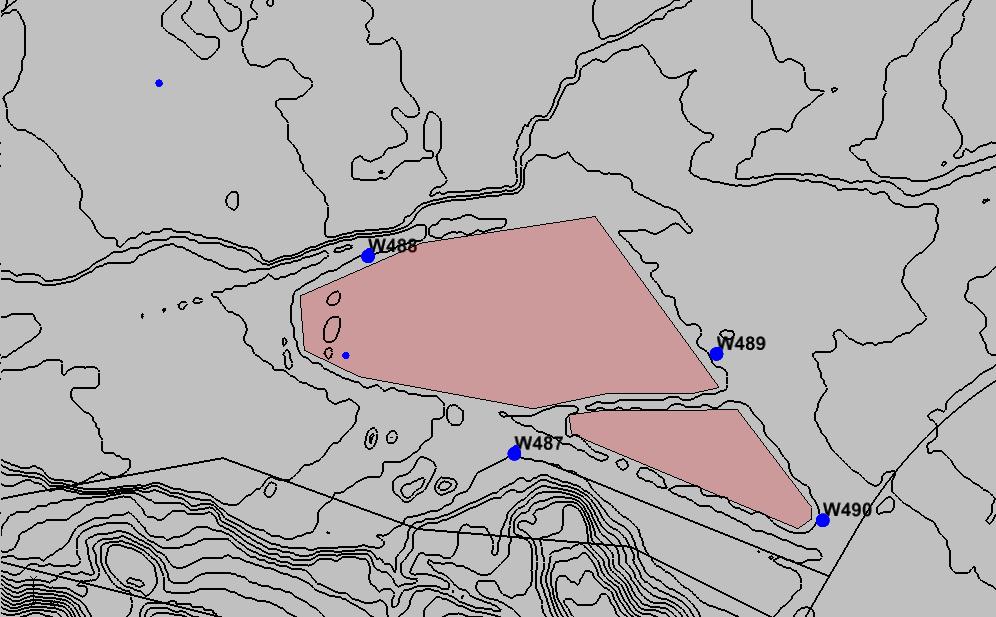
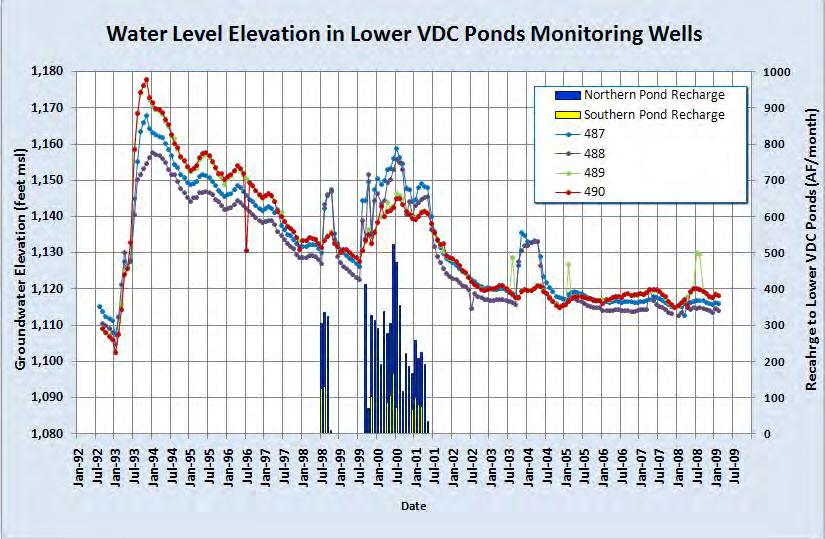
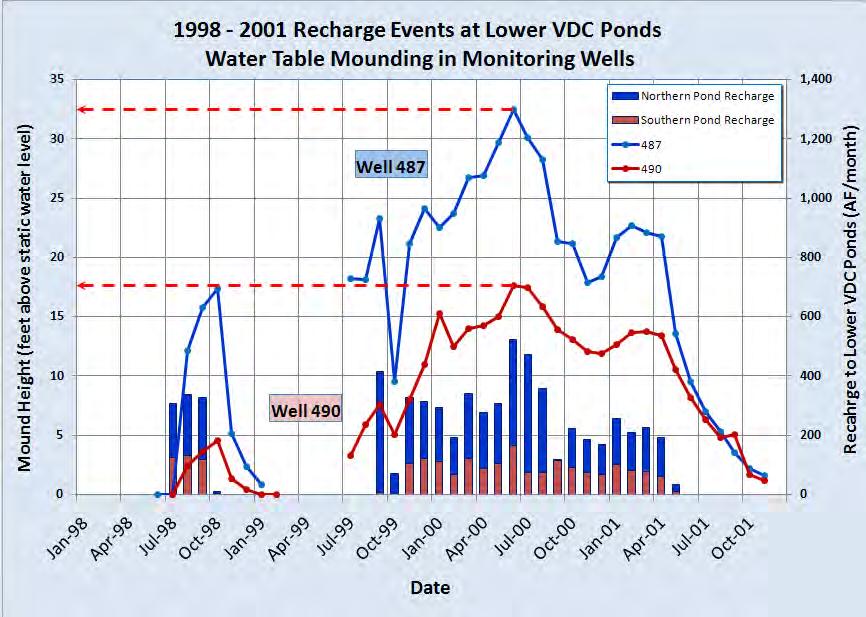
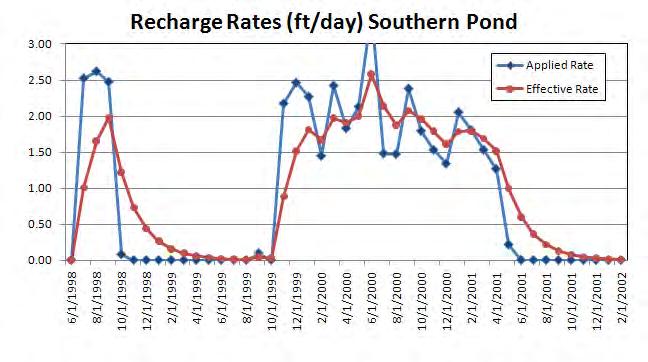
2 Optimizing Recharge and Recovery at Recharge Basins in the Pauba Valley Phyllis Stanin, Daniel Craig, and Edwin Lin,, Alameda, California Rancho California Water District (District) operates seven groundwater recharge ponds, referred to as the Valle de los Caballos (VDC) ponds, to provide a sustainable groundwater supply for the greater Temecula area. Recharge basins have been constructed along Temecula Creek in two areas of the Pauba Valley. The Upper VDC Ponds consist of five recharge basins covering 113 acres in the upper reach of the valley near Vail Lake, which collectively have averaged about 1,200 acre-feet per month (AF/month) of recharge. A limiting factor at the Upper Ponds is compliance with a Department of Public Health (DPH) permit that requires maintenance of a 40- foot vadose zone beneath the basins for pathogen removal. The Lower VDC Ponds consist of two adjacent spreading basins covering 15 acres, which have historically recharged up to approximately 500 AF/month. The sources of the recharge water are raw water supplied by Metropolitan Water District and releases from upstream Vail Lake. In order to maximize their recharge and recovery operations, the District has embarked on two optimization studies, one at the Lower Ponds and one at the Upper Ponds. and Kennedy/Jenks Consultants are assisting the District with these studies, which examine numerous recharge and recovery options such as focused recharge within certain basins, increasing local production to control groundwater mounding, and balancing production between inter-basin recovery wells and additional downgradient wells. For both studies, an improved understanding of the hydrogeology and local-scale numerical modeling were keys to optimizing recharge and recovery. At the Lower Ponds, constructed and applied a local-scale three-layer MODFLOW groundwater model using the District s existing regional model. The local model was calibrated to simulate the observed water table response to historical recharge events. A focused field program was designed and implemented to evaluate site-specific hydrogeologic conditions beneath the ponds. Sediments were found to have lower permeability than originally thought, which resulted in excessive mounding and rejected recharge. Data were incorporated into the calibrated model, which was used to evaluate potential future operational recharge and pumping scenarios that could allow increased rates and volumes of recharge. The approach was similar for the Upper Ponds, but the evaluation was more complex, given the larger number of basins, more options for recovery wells, and regulatory compliance with the 40-foot vadose zone requirement. A local-scale MODFLOW groundwater model was calibrated to simulate aquifer response to historical recharge events. Particle tracking was used to determine the fate of the recharged water. Numerous operational scenarios were evaluated including increased recharge in certain ponds, use of wells adjacent to the basins to control groundwater mounding, and selective operation of key downgradient wells to increase recovery of the recharge water.


3

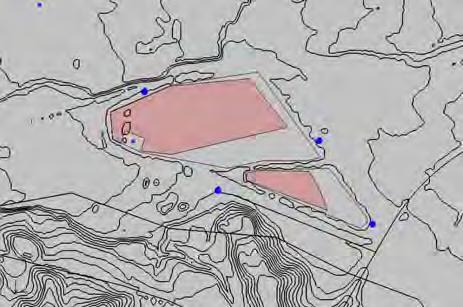
4 RCWD Valle de los Caballos (VDC) Conjunctive Use Project Lower Ponds Upper Ponds

5 Production Well Monitoring Well
6

7 DPH Treatment Rule requires 40 foot vadose zone

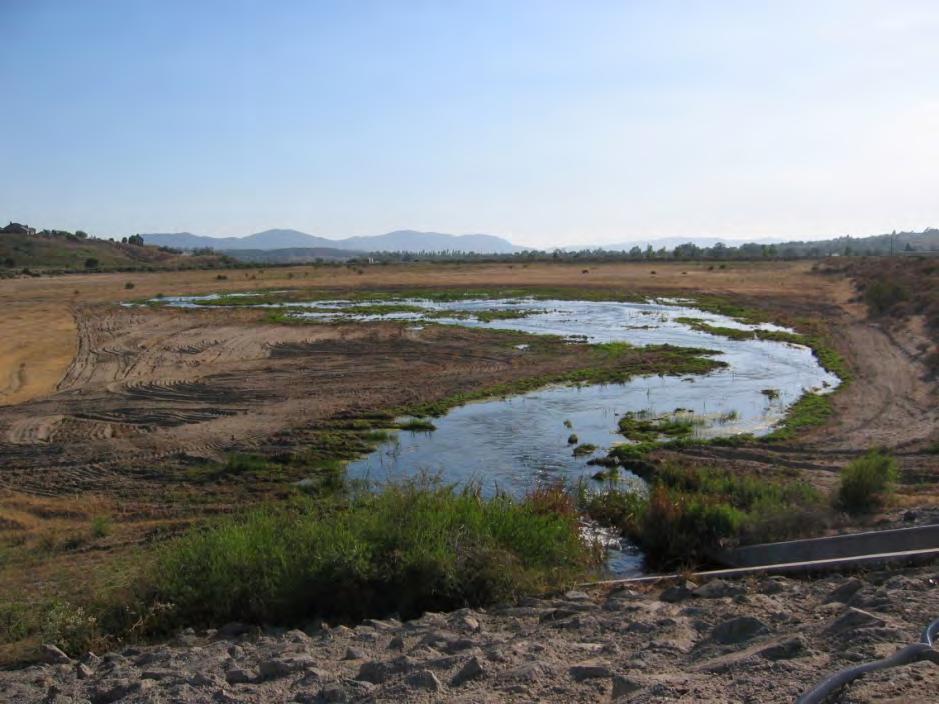
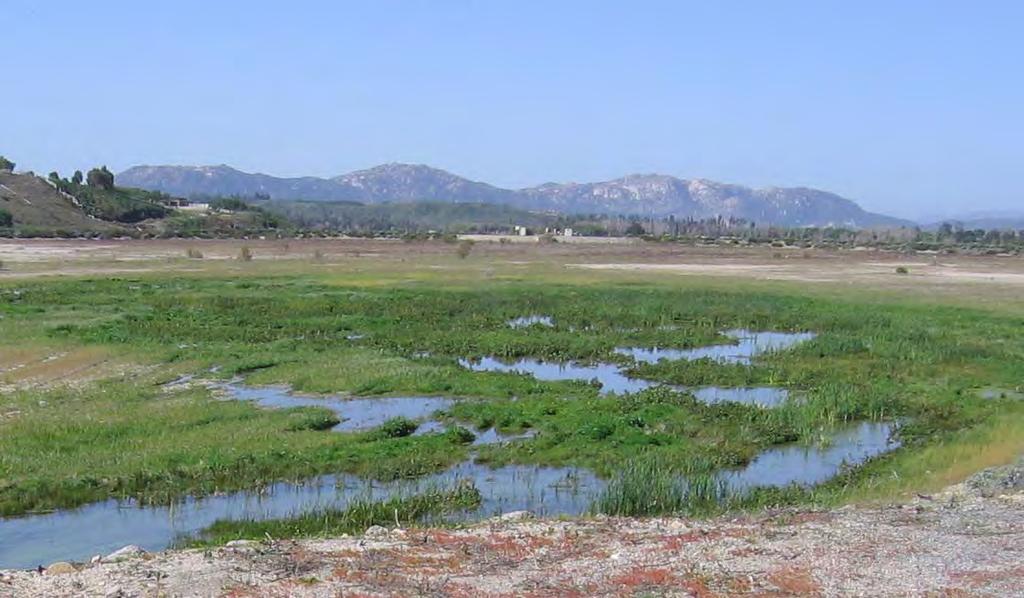
8 Limited infiltration capacity System experienced hydraulic failure water table rise to ground surface
9 Vadose Zone Investigations Lithologies Hydraulic Properties MODFLOW Modeling Calibration Simulations of Historical Recharge Performance Predictive Simulations of Future Recharge and Pumping Operations

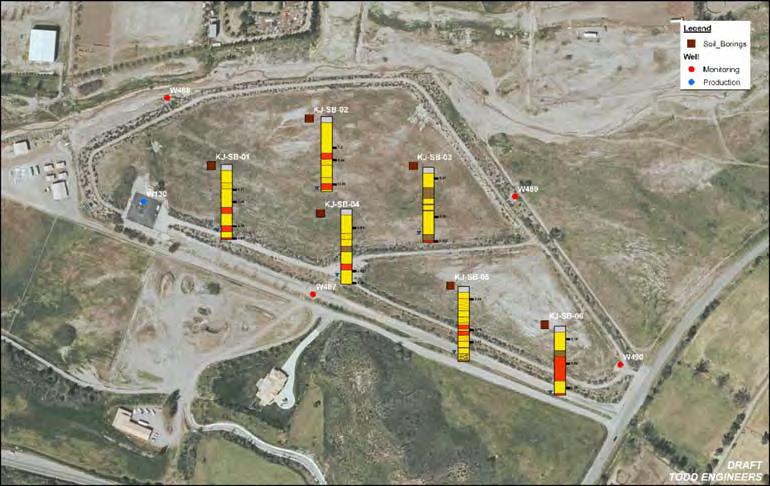
10 Lithologic logging and soil hydraulic property testing
11


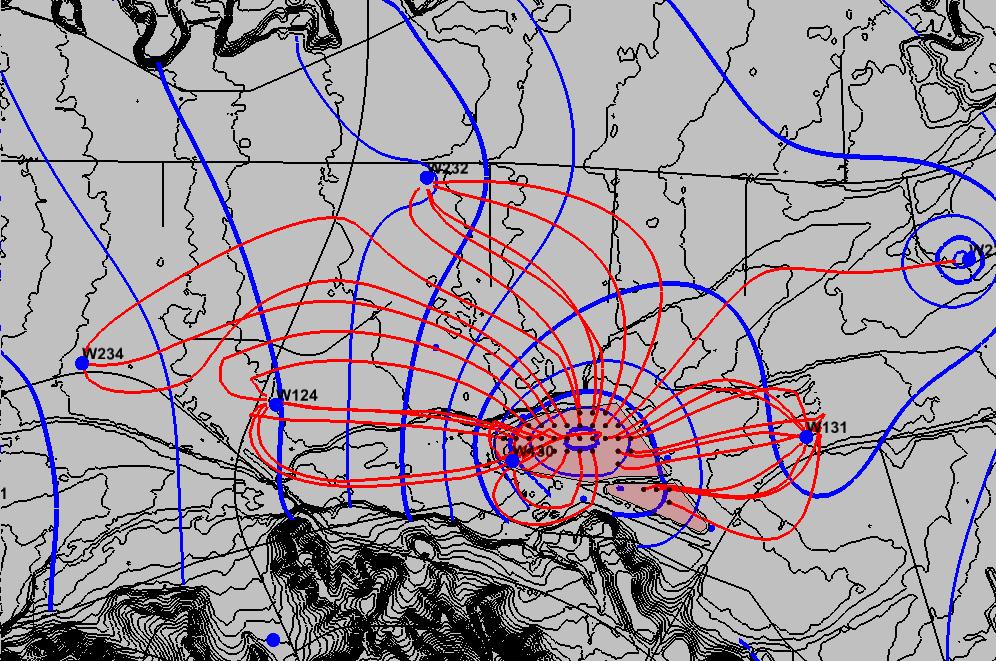
12 NORTHWEST SOUTHEAST Vertical Hydraulic Conductivity in feet/day


13 NORTHWEST SOUTHEAST Vertical Hydraulic Conductivity in feet/day
14 groundsurface Water levels Recharge
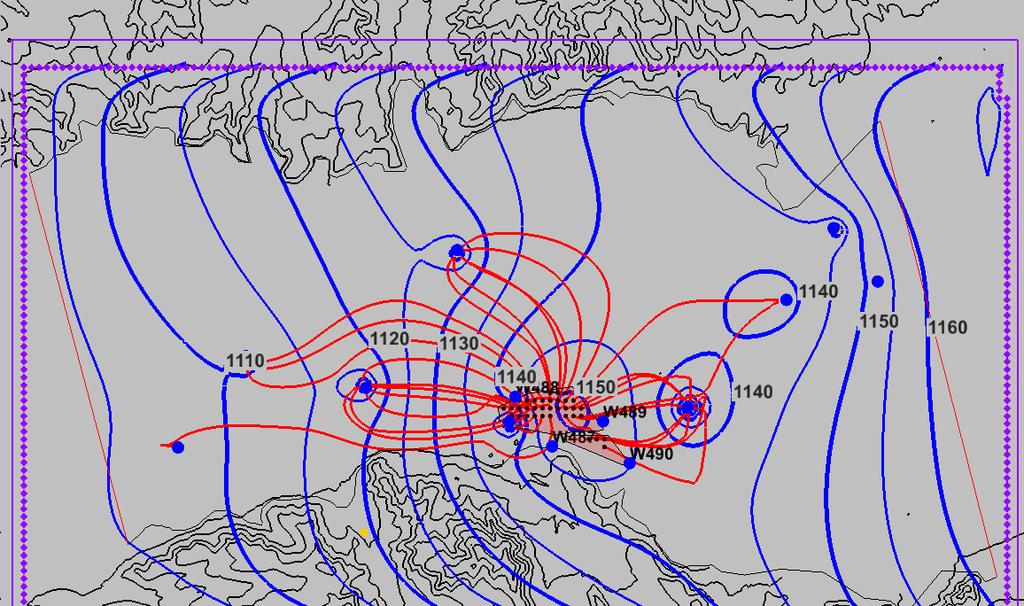
15 What is the maximum capacity? What are the best operational schedules? What is fate of recharged water? Can capacity be increased via additional downgradient pumping?
16 Local MODFLOW model of pond system Calibrated to period before and after recharge Flowpath simulations Predictive simulations of operations Various recharge rates and schedules additional capacity achieved by pumping


17 ORIGINAL REGIONAL BASIN MODEL GRID (Alluvial Aquifer) From Geoscience Support Services LOCAL MODEL AREAS

18 Boundary of Model Layer 1 Alluvium Boundary of Model Layers 2 and 3 Pauba and Temecula Formations

19 Model Layer 1
20 Calibrated to shallow and deep wells across model area and at ponds Steady-state calibrations 1998 and 2009 Transient calibration Period of multiple recharge events Simulated water table mounding and recovery

21 Model Layer 1 Alluvium

22 Model Layer 1 Alluvial 3 Temecula Aquifer Aquifer
23
24 groundsurface Water levels Recharge


25


26

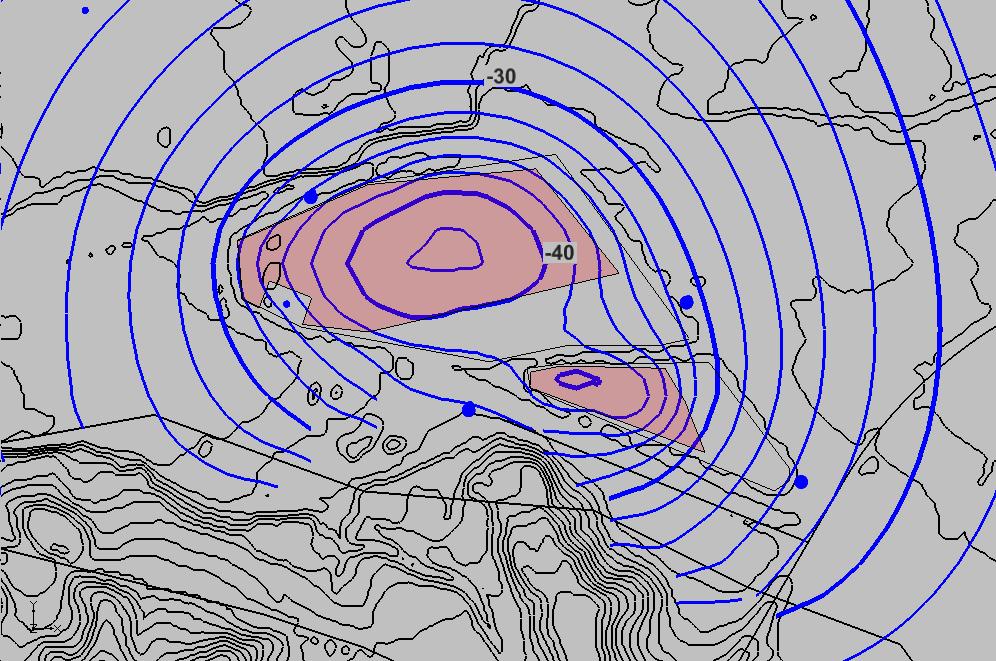
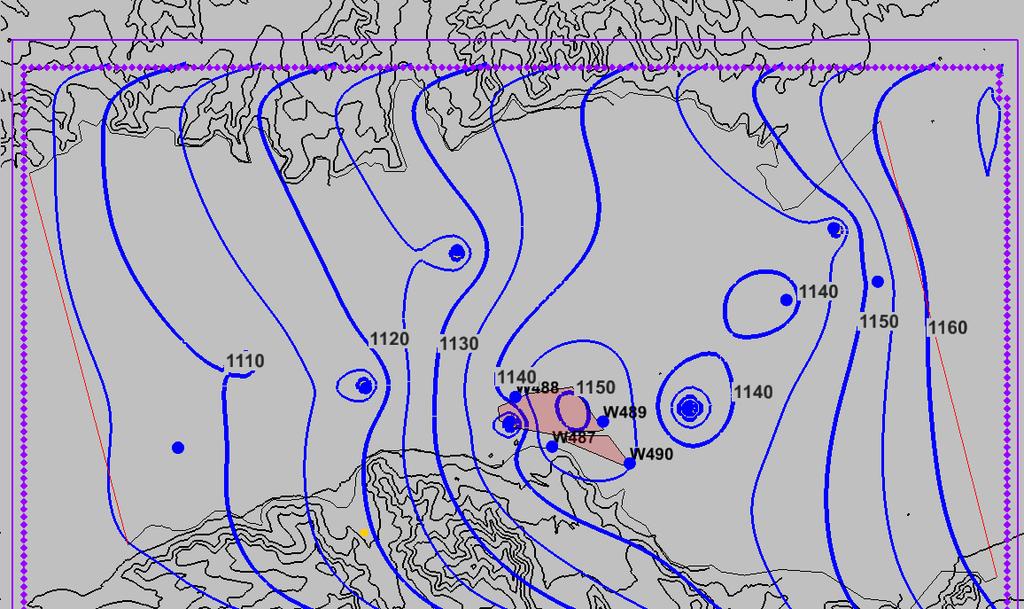
27 MODFLOW Calibrated to Mound Rise and Dissipation During Recharge Events
28
29
30 Layer 2 Pauba Aquifer Layer 2 Pauba Aquifer
31 Steady-state simulations of continuous recharge of 1,000 5,000 AFY Simulated current (2009) and High Water Table conditions Simulated hypothetical new well west of ponds
32 1,000 5,000 AFY
33
34
35
36 New 400 GPM

37 New 400 GPM
38 Continuous recharge of 4,000-5,000 AFY is sustainable High water table conditions will reduce sustainable recharge rate Hypothetical new well(s) west of ponds could capture more recharge and incrementally increase recharge rate Lower Pond Model provides a useful tool to test additional recharge operations

39 Upper Pond Model Area


40