Delaware IEEE Briefing. July 30, 2012 Jamie Mallon, Nuclear Development Manager
|
|
|
- Doris Richardson
- 5 years ago
- Views:
Transcription

1 Delaware IEEE Briefing July 30, 2012 Jamie Mallon, Nuclear Development Manager
2 Agenda Introductions National / Regional Energy Overview PSEG Power / PSEG Nuclear Overview Fukushima Update New Nuclear Development
3 Total United States vs. World Population (millions) Although less than 5% of the world s population, the U.S. consumes 19% of the world s total energy annually (21% in 2007)

4 The Earth at Night International demand for electricity will continue indefinitely!
5 International vs. United States Energy Produced International Electricity Produced 2008 Total GWh: 19,103,196 United States Electricity Produced 2010 Total GWh: 4,125,060 Conventional Thermal (fossil) 67% Conventional Thermal (fossil) 69.6% 16% Hydro 6.3% Hydro 14% 19.6% Nuclear 3% Renewable / Other Nuclear 4.5% Renewable / Other
6 The World at Night
7 The World at Night 436 Operating Nuclear Power Plants Source: IAEA
8 The World at Night 67 Nuclear Power Plants Under Construction Source: IAEA *Includes 4 AP1000
9 Brazil Bulgaria Slovakia Pakistan Argentina Worldwide Nuclear Capacity (Feb 12) Worldwide Nuclear Capacity (Feb 12) Total Nuclear Capacity (436 Units) 370 GW Capacity (GW) United States France Japan Russia Korea Rep. Ukraine Canada Germany China United Kindgom Sweden Spain Belgium India Czech Rep. Switzerland Finland Hungary Capacity Construction Source: IAEA
10 Brazil Bulgaria Worldwide Nuclear Capacity / Construction (Feb 12) Worldwide Nuclear Capacity / Construction (Feb 12) Total Nuclear Capacity (436 Units / 67 Construction) Capacity (GW) United States* France Japan Russia Korea Rep. Ukraine Canada Germany China United Kindgom Sweden Spain Belgium India Czech Rep. Switzerland Finland Hungary Slovakia Pakistan Argentina Capacity Construction Source: IAEA *Includes 4 AP1000
11 4/1/2012 Changing United States Energy Picture United States Total Generation Coal vs Natural Gas (%) /1/2011 2/1/2011 3/1/2011 4/1/2011 5/1/2011 6/1/2011 7/1/ /1/2011 9/1/ /1/ /1/ /1/2011 1/1/2012 2/1/2012 3/1/2012 Coal Natural Gas
12 Changing United States Energy Picture United States Electricity Produced 4/2011 Total GWh: 302,994 United States Electricity Produced 4/2012 Total GWh: 296,101 Renewable 6% Renewable 6% Nuclear 18% 41% Coal Nuclear 19% 32% Coal Hydro 10% 9% Oil 1% 23% Hydro 32% Natural Gas Oil.5% Natural Gas
13 New Jersey Electricity Generation Electricity Produced 2010 Total GWh: 65,682 Nuclear 49.9% 8% Renewable 1.3% 9.8%.4% - Oil Coal 37.9%.8% Other Natural Gas
14 Total New Jersey Generation Output (GWh) 100,000 90,000 80,000 70,000 60,000 50,000 40,000 30,000 20,000 10,000 0 Total Demand Nuclear Coal Natural Gas Oil Other
15 PSEG Power Generation Portfolio


16 PSEG Corporate Overview Traditional T&D Regional Wholesale Energy Electric Customers: 2.2M Gas Customers: 1.8M Nuclear Capacity: 3,661 MW Total Capacity: 13,060 MW Domestic/Int l Energy Leveraged Leases 6,110 Employees Nuclear 1,500 Fossil 1,200 ER&T and Power Support Employees Total 2,810 Services Company 1,030 Employees Total 9,970
17 PSEG Power Portfolio Fuel Diversity 2011 Energy Produced 2011 Total MW: 13,060 Oil Nuclear Total GWh: 53,980 Nuclear 9 % 44 % 28 % 18% Pumped Storage 1% 56% 15% 28% Pumped Storage / Oil <1% Gas Coal Coal Gas 4 th largest generator in PJM Generating assets in four states New Jersey / New York / Connecticut / Pennsylvania

18 Salem and Hope Creek Nuclear Generating Stations
19 PSEG Nuclear Salem and Hope Creek Second largest site in country Approximately 3,575 MWe Enough electricity for ~3 million homes Each unit licensed for 60 years (license renewal completed) Salem Unit 1 (PWR, 1180* MW) August 2036 Salem Unit 2 (PWR, 1175* MW) April 2040 Hope Creek (BWR, 1219* MW) April 2046 Each unit on an 18 month refueling cycle Spent fuel dry cask storage facility on property Enough space for 200 casks all 3 units, 60 years *Mean Annual Net Rating
20 Fukushima Update

21 Japan Nuclear Power Plants

22 Fukushima Daiichi Nuclear Station Six BWR units at the Fukushima Nuclear Station Units 1, 2, 3 in operation prior to event Units 4, 5, 6 in outage prior to event Unit 1 22
 Emergency power lost units 1 4 Diesels not protected in water tight structures Units 5, 6 maintained one air cooled diesel for emergency cooling Minimal safety impact at")
23 Design Criteria Japan Fukushima Daiichi Seismic.47g design (.53g actual) Fukushima Daiichi Flood 5.7 m design (14 m actual) Emergency power lost units 1 4 Diesels not protected in water tight structures Units 5, 6 maintained one air cooled diesel for emergency cooling Minimal safety impact at station Daiini, Onagawa, Tokai safely shutdown Plants designed at higher elevations with onsite generators protected during flood / earthquake event Emergency onsite AC power remained available throughout event

24 Tsunami 1 minute

25 Post Accident Japanese Operator Actions Command / control challenges Drywell pressure reaches 120 psi (~4x US operator threshold) Design limited ability to vent containment Rapid cool down suspended on unit 1 Uncontrolled hydrogen release to secondary containment Containment possibly vented through drywell head / ventilation system Hydrogen detonation causes extensive damage to plant Unit 3 hydrogen release results in explosion in Unit 4 (shared ventilation)

26 Fukushima Unit 4 Hydrogen explosion on refuel floor Unit in maintenance outage Reactor head off cavity flooded to level of fuel pool All fuel moved to spent fuel pool Hydrogen explosion occurred in reactor building Assumed hydrogen formed from fuel damage in fuel pool Immediate questions regarding fuel pool level Actions taken to recover fuel pool level


27 Hydrogen path from Fukushima Unit 3 to Unit 4 Shared ventilation results in Hydrogen explosion in Unit 4


28 Site Damage Challenged Emergency Operations


29 Plant Conditions Challenged Emergency Operations
30 Salem / Hope Creek Site Specific Information


31 United States Design Improvements Spare Diesel / Pump 2002 Station Black Out 1988 Containment Vent 1989 Fire Protection 1979 Strengthened Torus 1980 Control Room TMI 1980
32 Salem Hope Creek Seismic Design Seismic Design.2 g (~6.5 Richter Scale) All structures, systems, and components important to plant safety will perform safety function to keep plant cool Re-evaluated during current License Renewal review The largest earthquake in New Jersey occurred in 1783 Magnitude 5.3 Felt from New Hampshire to Pennsylvania


33 Salem/Hope Creek Flood Design > NJ HURRICANES SINCE 1900 SEVERITY SPEED (MPH) OCCURANCES Category MPH 1 Category MPH 0 Category MPH 0 Category MPH 0 Category 5 > 155 MPH 0


34 Hope Creek EDG Flood Protection Design Hope Creek 4 Dedicated Emergency Diesel Generators protected from flooding up to 31 feet above site grade Hope Creek Diesel Combustion Air Intakes 31 feet above site grade Hope Creek EDG Combustion Air Intakes


35 Auxiliary Building Emergency Electrical Power
")

36 Salem and Hope Creek Tornado Design NEW JERSEY TORNADO HISTORY F-SCALE SPEED (MPH) OCCURANCES F F F F F F
37 NRC Near-Term Actions Assess flooding mitigation and validate results against plant s criteria to protect against worst case flooding Assess protection against earthquakes and verify structures and components meet NRC criteria and are able to mitigate severe accidents initiated by external events Purchase additional equipment to protect nuclear facilities from natural hazards affecting more than one reactor at a site Review procedures for hardened vents designs in Mark I and applicable Mark II boiling water reactors and ensure operation during loss of AC power event Evaluate instrumentation and equipment needed to monitor spent fuel pools Validate each site s capability to implement emergency operating procedures and guidelines to manage severe accidents
38 Fukushima Response Q1 Q2 Q3 Q NRC releases Orders & 54(f) letter 54(f) - Seismic Reevaluation 54(f) - Flood Reevaluation 54(f) - NRC endorses walkdown guidance 54(f) - Perform walkdowns 54(f) - Walkdown results submitted 54(f) - EP staffing Ph 1 54(f) - EP staffing Ph 2 54(f) - EP communications assessment Order 49 - FLEX plan development Order 50 - Vent plan development Order 51 - SFP inst plan development Orders - Submit plans to NRC Order 49 - Implement FLEX Order 50 - Implement Vent Order 51 - Implement SFP Orders - Confirm compliance to NRC S1 HC S2 38
39 New Nuclear Development
40 United States Nuclear Development activities Renewed Construction (old licensing process) Watts Bar (Tennessee) Unit 2 refurbishment underway Expect commercial operation in 2Q 2013 Bellefonte Unit 1 (Alabama) refurbishment approved August 8/18 Expect commercial operation in 2020 New Nuclear Construction (new process) Construction of AP1000 reactors in South Carolina and Georgia continues Vogtle and VC Summer construction licenses approved More than $2.5 B spent to date Approximately 2500 people working today
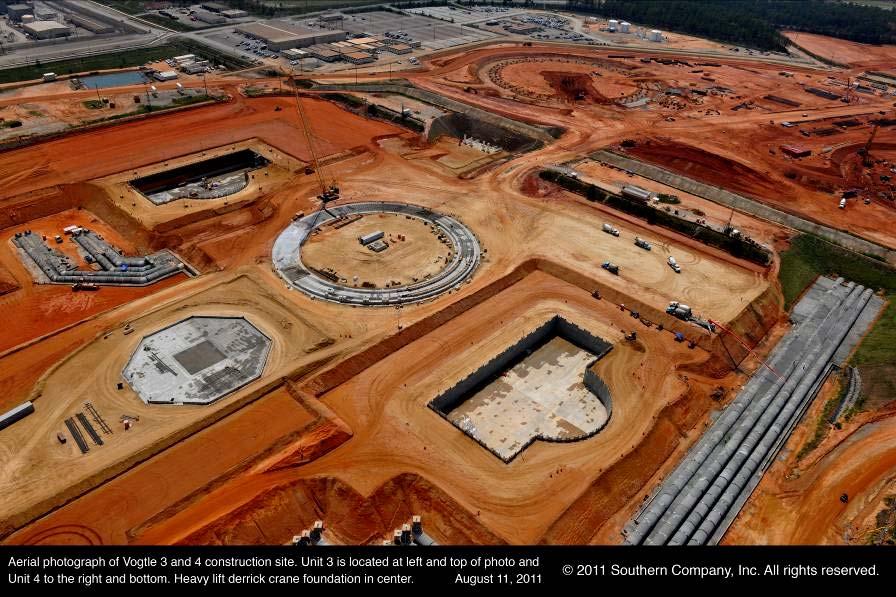
41 Vogtle Construction

42 Vogtle Nuclear Island Basemat

43 Generic Nuclear Development Timeline Presidential Election Gubernatorial Election Gubernatorial Election Presidential Election Gubernatorial Election Presidential Election Presidential Election Five technologies available in United States 2 Design Certifications issued 3 Design Certification Applications under review 2,500 4,000 construction jobs; permanent jobs
44 New Nuclear Development at PSEG PSEG Power submitted Early Site Permit application in May PSEG Board authorized $100 M for ESP / COLA development ESP developed including four plant technologies The ESP route is logical next step for PSEG Starts the application process while deciding on reactor technology Engages local public, political, regulatory and environmental stakeholders early in the process Significant local and state stakeholder support Energy and Environmental Resource Center developed after benchmarking trips
45 Public Perception Do you strongly favor, somewhat favor, somewhat oppose or strongly oppose the use of nuclear energy?
46 Perceptions of Public Opinion Does the American Public generally support or oppose building more nuclear power plants? 42% 14% 44% Supports Don't Know Opposes
47 Resources International Atomic Energy Association (IAEA) Nuclear Regulatory Commission (NRC) Energy Information Administration (EIA) Department of Energy (DOE) Federal Emergency Management Agency (FEMA) Nuclear Energy Institute (NEI) World Nuclear Association (WNA)