Energy Management Journey
|
|
|
- Abel Stephen Underwood
- 5 years ago
- Views:
Transcription


1 Energy Management Journey Arnold Granger, P.E., CEM Director of Energy Management Dr. Yeqiao Zhu, P.E., MBA Director of Facilities Patient Care and Prevention Facilities

2
3 Patient Treatment

 120")


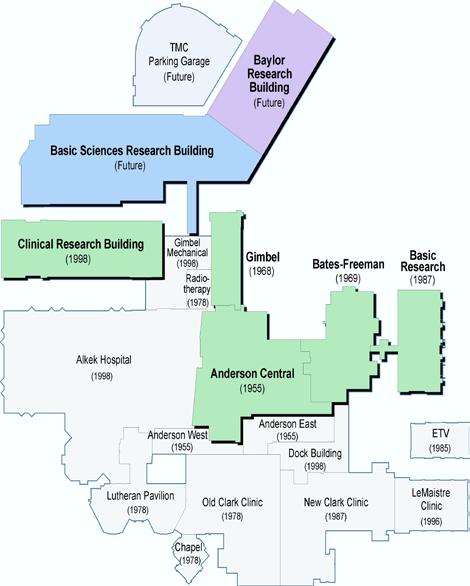
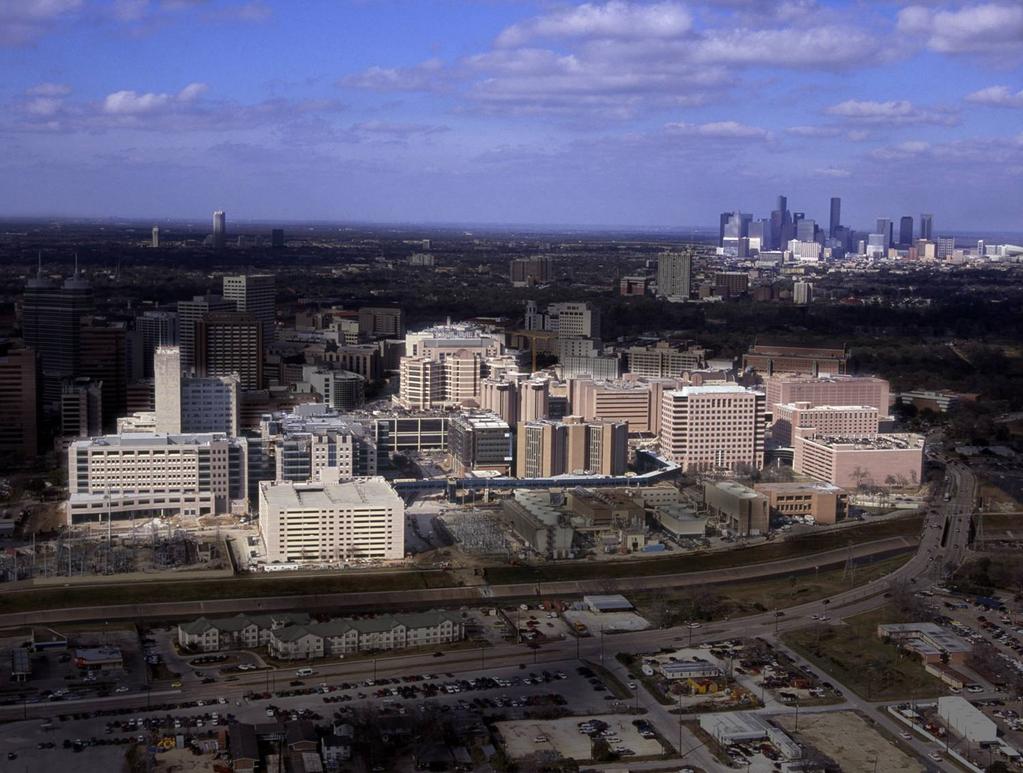
4 Research Facilities Research Overview (2005) 120 MI 1.5 MI Science Park Bastrop Leased Research Facilities Science Park Smithville Main Complex South Campus

5 Master Plan Scenarios

6 Why are Engineers so Dull?

7 Utter Social Ineptitude

8 Total 15.5M Gross SF

9 Utility Consumption 12 Months
10 EUI and Occupied SF

11 ENERGY AND SUSTAINABILITY STRATEGIC PLAN MD Anderson s roadmap for proactive execution of utility and waste reduction opportunities. 5 Year Strategic Plan 2013 Facilities Management Energy and Sustainability Steering Committee
12 Strategic Goals Reduce FY2016 annual energy consumption in BTU/GSF for occupied space by 5% against FY2012 baseline; and reach a total of 7% by the end of FY2020 Design new buildings to meet or exceed LEED Silver standards; energy efficiency initiatives that meet a minimum 20% return on investment will be considered Increase annual pounds of solid waste recycling based on FY2013 baseline to 25% of total waste by FY2015

13 Energy Reduction Goal

14 HVAC Largest User This image cannot currently be displayed.

15 Impact of Efficient Operation

16 Schaffer Consulting 2014


17 KPI PRIORITY SYSTEM PRIORITY Schaffer Consulting 2014

18 Schaffer Consulting 2014
19 Schaffer Consulting 2014

20 Schaffer Consulting 2014
21 Energy Conservation Measures Outside air optimization Energy recovery systems Unoccupied space setbacks Reduce simultaneous heating & cooling Demand based temperature resets High efficiency fume hoods
22 Energy Conservation Measures Pumping system optimization Central plant optimization Controls optimization-retro Cx Lighting occupancy sensors and timers Low watt T8 lighting standards LED fixtures for select applications Benchmarking and sub-metering
23 $17.6 million saved in FY2013 vs. FY2001 baseline performance Same bottom line benefit as an additional $352 million of patient revenue with 5% margin
24 Electric Supply and Demand Reduction Programs Aggregated 9 UT institutions to negotiate current retail electric agreement o General Land Office contract in place through December 2016 based upon fixed heat rate and hedged on natural gas o UT System initially saved $15.2M (MDA $5.1M) o $2.0+M savings in FY14 due to wholesale price management FY14 Demand Response Participation o CenterPoint Energy (6.5 MW)= $230K rebate o ERCOT Program= $164K rebate
25 Healthcare Mission Team: Guiding Principle Enhanced Environment of Care Improved Operations Reduce Energy Costs Focus on Demand Side Energy Management Team Approval on Plans System Repair and capacity enhancement Equipment Upgrade One Stone for Two Birds: Energy and Operations Minimize Impact to Customers
26 Healthcare Mission Team: Guiding Principle Maximize the use of resources Have accountability for the project implementations Well-defined timeline Bigger maintenance, smaller capital Fast payback Priority: payback, time sensitivity, constructability Bi-weekly project update by leader
27 Energy Team and Collaboration O&M Team Energy Management Team BAS Team Engineering Team Construction Team Executive Leadership / Sponsorship
28 Major Strategy to Reduce Energy Consumption and Sustain High Performance Establish short, medium, and long term projects Establish 90 days (quarterly) goals Assign lead with accountability for each goal items Implement energy ECMs Establish energy performance dashboard Monitoring and maintain default set points Educate frontline employees Form energy conservation culture Resolve deficiencies identified through Daily Operation Report (newly established)
29 Major Steps Collect design information Field investigation and Measurement Analysis of BAS sequence of operations Draft energy (ECM) measures Estimate energy and cost savings Develop new sequence of operations Install necessary parts Team approval Implementations Fine-tuning and monitoring

30 Energy Usage in Healthcare Building (ASHE Cx)
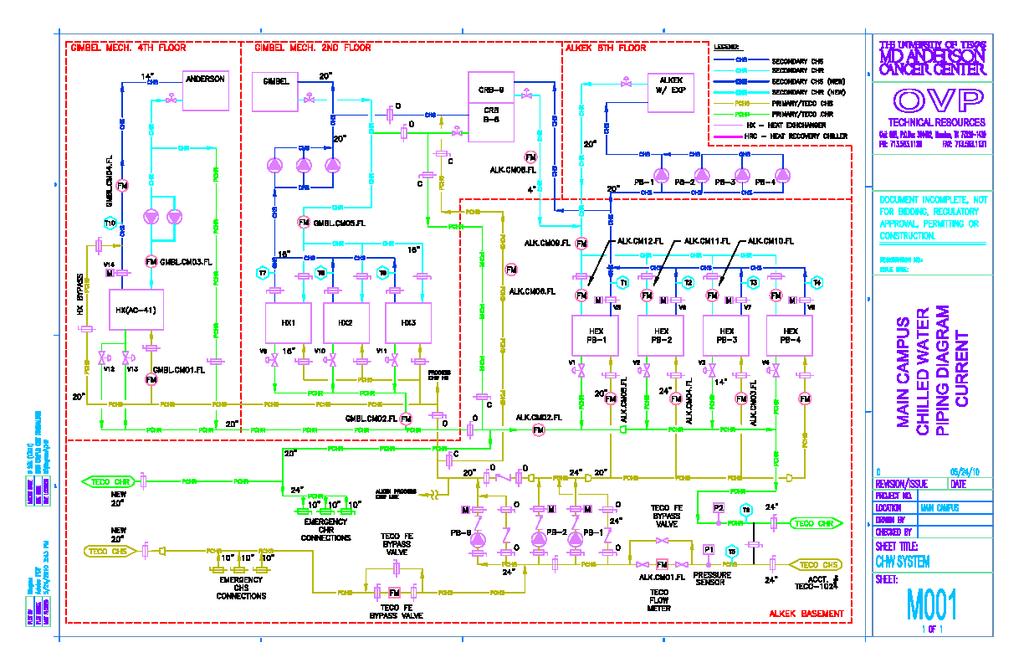
31 Buildings, Systems and Focus Select Buildings: Clinic (NCC, Love, OCC, LP, CSF, ACB) Hospital (Alkek and Lutheran) MOB (CPB, FC and PAT) Select Systems: Steam, ChW, AHU, OA and Air Distribution Major Focus: Semetouanuous cooling/heating reduction HVAC Unoccupied setback Optimized outside intake Heat Recovery Chiller Pumping system optimized control Steam system leak reduction Power usage reduction Use of high efficiency equipment
32 Implementations, Fine-tuning and Troubleshooting
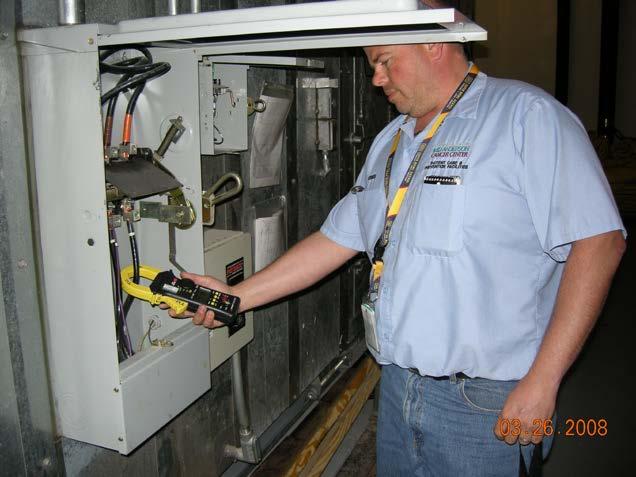
33 Implementations, Troubleshooting, Sustaining

34 Patient Care Main Campus Energy Cx $4 million annual energy savings vs: 2008 and 2011 AHU air temperature dynamic reset Heat Recovery chiller Sustainability default BAS set points ChW pump bypass and optimized control Chilled water system ΔT improvements Kitchen unoccupied ventilation reduction OA temperature optimization OA optimization for clinical floors Steam system repair AHU static pressure control HW system control Terminal box upgrade Effective PM on filters and coils System repair
35 Mays Clinic Retro-commissioning $2 million annual energy savings 2,000 1,800 1,600 1,400 Ton-Hrs (000) 1,200 1, CHW usage Unoccupied airflow reduction Cold deck reheat elimination Smart fan & pump control algorithms Outside air pre-treat optimization Hot & cold deck Optimize minimum airflows to reduce simultaneous heat and cooling ACB Energy Savings Summary Electric KWH Chilled Water Tonhours Chilled Water Gallons Steam Pounds Total Building Jan $30,169 $72,191 $11,088 $44,311 $157,759 Feb $27,631 $101,124 $9,287 $36,699 $174,741 Mar $32,590 $116,948 $8,136 $43,048 $200,722 Apr $25,815 $114,785 $8,384 $45,127 $194,111 May $25,478 $169,512 $7,678 $47,942 $250,610 Jun $24,583 $153,663 $7,224 $46,218 $231,687 Jul $22,734 $153,938 $9,402 $46,707 $232,780 Aug $29,462 $137,311 $17,879 $36,688 $221,342 Sep $28,535 $216,739 $5,039 $38,866 $289,178 Oct $19,029 $164,832 $7,701 $46,576 $238,138 Nov $29,249 $107,925 $15,482 $41,720 $194,376 Dec $30,019 $99,620 $17,263 $43,729 $190,631 Total $325,294 $1,608,58 7 $124,562 $517,631 $2,576,074
36 Research Facilities Energy Conservation Major Initiatives - $3~4 million annual energy savings Changed laboratory minimum required air change rate from 12 ACH continuously to 6 ACH occupied and 4 ACH unoccupied Developed lab re-cool in high heat load areas instead of cooling with 100% outside air Fume hoods Close the sash campaign Rebalance airflow New hood standards / proximity sensors Retro-commission laboratory and Vivarium HVAC and exhaust systems to new standards Central plant optimized operations
37 Innovative Energy Solutions for Healthcare Buildings (two examples) Dynamic Air Temperature Demand Reset for AHUs OR Energy Conservation

38 Dynamic Air Temperature Demand Reset for AHUs Reduce simultaneous cooling/heating Count and monitor the deck temperature and terminal box operations Reset supply air temperature based on the total # of terminal box loop output with over 90% Dynamic reset Lower/Higher limit

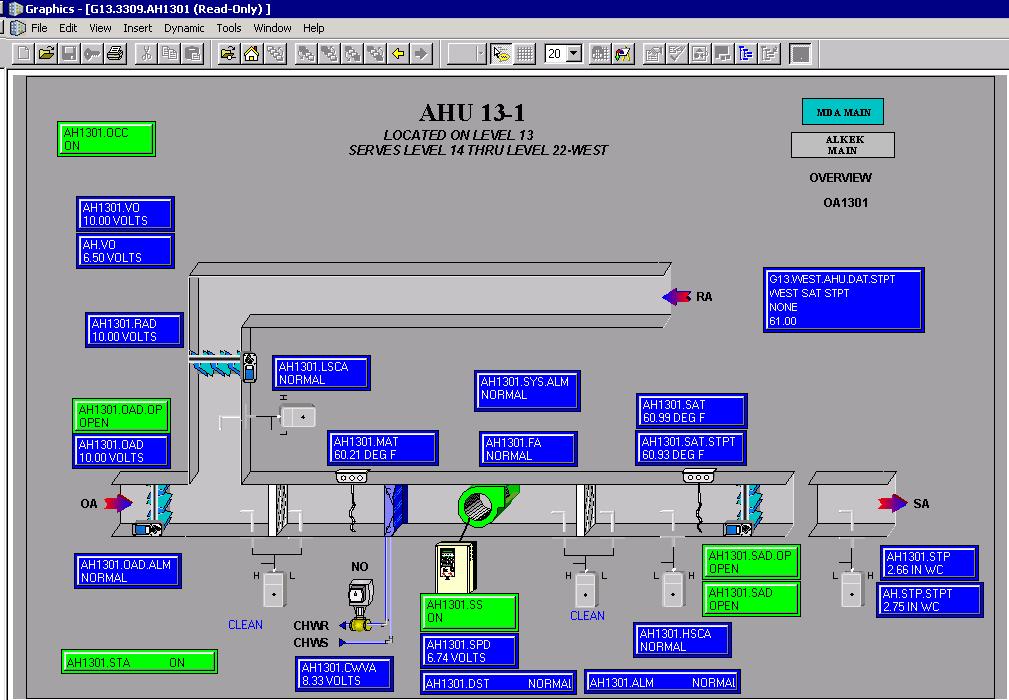
39 AHU and Terminal Box (Conditioned Space)
40 Dynamic Air Temperature Demand Reset for AHUs
41 OR Energy Conservation Goal: Maintain OR EOC and Reduce Energy Costs During Unoccupied Hours Team with OR clinical and IT team Maintain 68-75F for the OR rooms with RH level of 20-60% Maintain the same Delta P for the OR room pressurization Maintain pressure compliance, protect the sterile supply, and avoid additional terminal cleaning Reduce energy consumption Provide emergency override Maintain 24/7 operations for pre-defined OR rooms
42 OR Energy Conservation Scheme Following actual surgical schedules on individual basis Differential pressure: Same as Occupied relies on ΔCFM (dashboard) Unoccupied Room ACH: 8~10 Reset between occupied and unoccupied per the surgical schedule Maintain lower temperature (68F or so) to reduce terminal reheat Verify DP by measurement
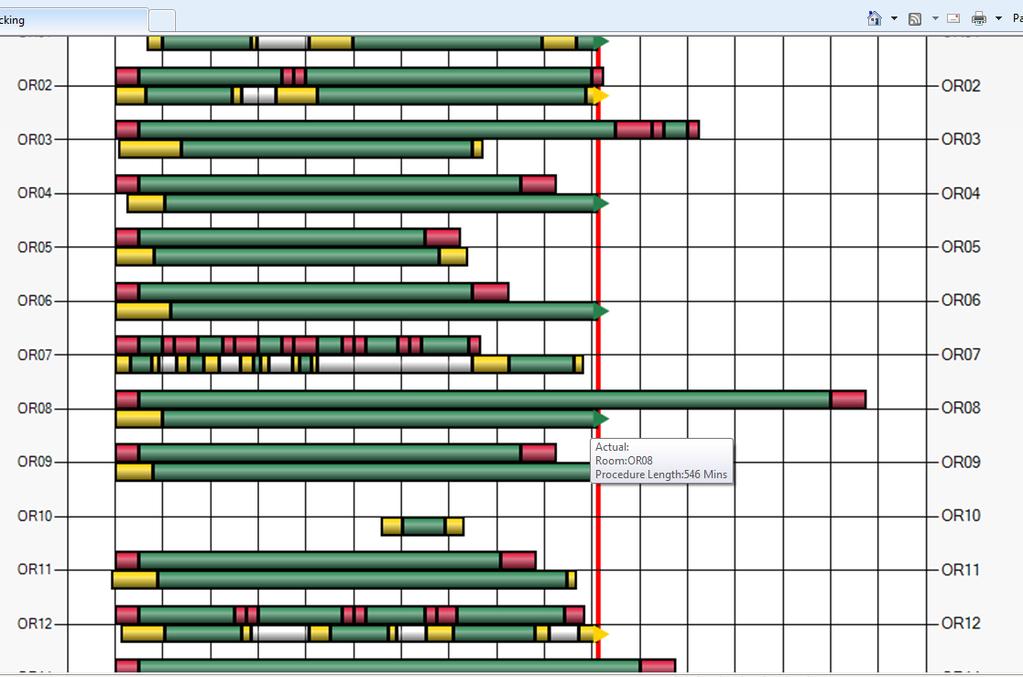
43 OR Energy Conservation
44 High Performance Sustainability Establish the default set points Build dashboard Daily monitoring Resolve override and problems Educate O&M staff and form energy culture Clear roles and responsibility Newly established daily deficiency report for O&M action

45 High Performance Sustainability AHU# OAHU CB-N1 OAHU- OC1 OAHU- OC2 OAHU- OC3 AHU OC6 OAHU CS-B3 OAHU CS-B4 AHU C4- N3 OAHU CS-P4 OAHU CS-P3 OAHU L-3-1 Locati on RB RB RB RB RB RB RB R R R P Previ ous Pre Heat STPT New Pre Heat STPT Previ ous Cooli ng STPT New Cooli ng STPT Previ ous SAT STPT New SAT STPT Serves CB-N2, CB-N3, CB-N4, CB- N5, CB-N6, CB-S1, CB-S2 OUTPATIENT SURGERY OPERATING ROOMS Asse t# Buil ding J S S S W P P J P P K
46 Milestone Energy Cost Savings: Alkek/CRB/Anderson/Gimbel ton-hrs 5,000,000 4,500,000 4,000,000 3,500,000 3,000,000 2,500,000 2,000,000 Bertner Hospital Group Chilled Water Use, Ton-Hrs Source: Energy Cap 1. This is an example text. Go ahead and replace it with your own text. This is an example text. Go ahead and replace it with your own text. 2. This is an example text. Go ahead and replace it with your own text. 3. This is an example text. Go ahead and replace it with your own text ,500,000 1,000, ,000 0 Jan Feb Mar Apr May Jun Jul Aug Sep Oct Nov Dec
47 Milestone Energy Cost Savings: Alkek/CRB/Anderson/Gimbel Bertner Hospital Group Steam Use, Lbs Source: Energy Cap 14,000,000 lbs 12,000,000 10,000,000 8,000,000 6,000, This is an example text. Go ahead and replace it with your own text. This is an example text. Go ahead and replace it with your own text. 2. This is an example text. Go ahead and replace it with your own text. 3. This is an example text. Go ahead and replace it with your own text ,000,000 2,000,000 0 Jan Feb Mar Apr May Jun Jul Aug Sep Oct Nov Dec
48 Milestone Energy Cost Savings: Alkek/CRB/Anderson/Gimbel Bertner Hospital Group Electric Use, kwh Source: Energy Cap 6,000,000 kwh 5,000,000 4,000,000 3,000,000 2,000, This is an example text. Go ahead and replace it with your own text. This is an example text. Go ahead and replace it with your own text. 2. This is an example text. Go ahead and replace it with your own text. 3. This is an example text. Go ahead and replace it with your own text ,000,000 0 Jan Feb Mar Apr May Jun Jul Aug Sep Oct Nov Dec
49 Dollar Savings Summary Alkek, CRB, Anderson & Gimbel Energy Cost Savings Electric KWH Chilled Water Tonhours Chilled Water Gallons Steam Pounds Total Building Jan -$29,675 $108,248 $14,175 $117,551 $210,298 Feb -$16,057 $123,670 $12,329 $130,144 $250,085 Corrected use for Feb. Mar $9,438 $215,777 $14,580 $90,498 $330,293 Apr -$5,995 $230,298 $12,230 $91,079 $327,611 May -$16,375 $215,065 $10,418 $98,138 $307,245 Jun $798 $147,604 $5,290 $90,944 $244,636 Jul -$31,407 $165,866 $6,055 $88,017 $228,532 Aug -$1,686 $154,898 $892 $85,134 $239,237 Sep -$8,430 $14,868 -$1,232 $151,570 $156,776 Oct -$50,867 $45,400 -$137 $105,207 $99,603 Nov -$28,552 $182,072 -$861 $83,632 $236,290 Dec -$10,851 $138,880 $1,299 $111,875 $241,204 Total -$189,661 $1,742,647 $75,037 $1,243,789 $2,871,812 Baseline consumption, 2011
50 Milestone Energy Cost Savings: Over $ 1,000,000 LP/OCC: ChW Gal Lutheran-Old Clark Chilled Water Use, Gallons x1000 Source: Energy Cap 250,000 kgal 200, , , This is an example text. Go ahead and replace it with your own text. This is an example text. Go ahead and replace it with your own text. 2. This is an example text. Go ahead and replace it with your own text. 3. This is an example text. Go ahead and replace it with your own text ,000 0 Jan Feb Mar Apr May Jun Jul Aug Sep Oct Nov Dec
51 Milestone Energy Cost Savings: Over $ 1,000,000 LP/OCC : ChW Ton-hr Lutheran-Old Clark Chilled Water Use, Ton-Hrs Source: Energy Cap 1,600,000 ton-hrs 1,400,000 1,200,000 1,000, , , This is an example text. Go ahead and replace it with your own text. This is an example text. Go ahead and replace it with your own text. 2. This is an example text. Go ahead and replace it with your own text. 3. This is an example text. Go ahead and replace it with your own text , ,000 0 Jan Feb Mar Apr May Jun Jul Aug Sep Oct Nov Dec
52 Milestone Energy Cost Savings: Over $ 1,000,000 CSF/NCC: Steam Lutheran-Old Clark Steam Use, Lbs Source: Energy Cap 4,500,000 lbs 4,000,000 3,500,000 3,000,000 2,500,000 2,000,000 1,500, This is an example text. Go ahead and replace it with your own text. This is an example text. Go ahead and replace it with your own text. 2. This is an example text. Go ahead and replace it with your own text. 3. This is an example text. Go ahead and replace it with your own text ,000, ,000 0 Jan Feb Mar Apr May Jun Jul Aug Sep Oct Nov Dec
53 Baseline data: 2008 Dollar Savings Summary Lutheran-Old Clark Energy Savings Summary Chilled Water Ton-hours Chilled Water Gallons Steam Pounds Total Building Jan $85,790 $27,738 $18,706 $132,234 Feb $98,436 $20,979 $8,828 $128,243 Mar $70,940 $18,908 $10,045 $99,894 Apr $80,774 $20,631 $10,315 $111,720 May $80,298 $21,285 $7,385 $108,968 Jun $60,662 $19,916 $12,941 $93,519 Jul $71,385 $17,686 $14,329 $103,400 Aug $54,277 $19,519 $19,729 $93,525 Sep $46,386 $12,972 $37,989 $97,346 Oct $45,723 $21,502 $12,110 $79,335 Nov $74,638 $19,277 $13,929 $107,844 Dec $79,339 $18,548 $23,672 $121,559 Total $848,648 $238,961 $189,978 $1,277,587 Baseline data: 2008 New Clark-Love-LeMaistre Energy Savings Summary-2014 Chilled Chilled Steam Total Building Water Tonhours Water Pounds Gallons Jan $27,419 $5,051 $28,571 $61,041 Feb $40,103 $3,585 $16,975 $60,663 Mar $46,723 $4,536 $10,841 $62,100 Apr $34,426 $3,236 $8,020 $45,682 May $54,813 $3,661 $5,321 $63,795 Jun $39,197 $2,303 $7,517 $49,016 Jul $34,254 $1,872 $6,893 $43,019 Aug $26,862 $1,745 ($2,224) $26,383 Sep $7,419 $948 $4,794 $13,161 Oct -$11,141 $1,158 ($3,892) -$13,875 Nov $32,288 $3,200 $4,561 $40,049 Dec $40,648 $3,764 $24,175 $68,586 Total $373,012 $35,059 $111,549 $519,620

54 Energy Star Buildings First Energy Star Building-2009


55 Key Points: Implementation and Sustainability O&M Team training Energy conservation culture Celebrate major milestone accomplishment Small or no capital instead of large capital projects Daily energy inefficiency actionable report Balance between Energy Innovation and Environment Improvement
56 Thank you!