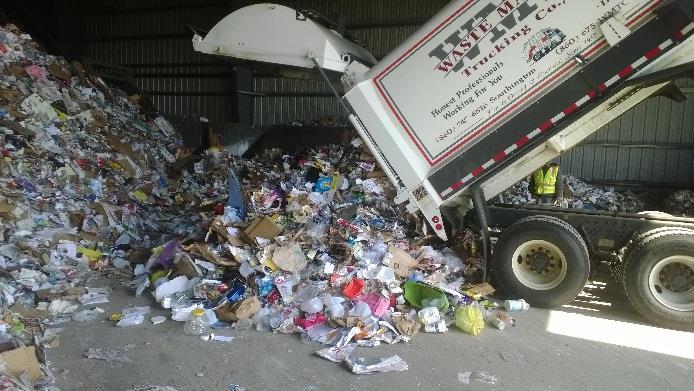
Measuring Composition and Contamination at the MRF
|
|
|
- Amy Singleton
- 5 years ago
- Views:
Transcription


1 Measuring Composition and Contamination at the MRF N O R T H E A S T R E C Y C L I N G C O U N C I L F A L L C O N F E R E N C E O C T O B E R 3 1,

2 Introduction Material Characterization Collection Optimization SWMP/Zero Waste Procurement Support Cost/Rate Studies Recycling/Organics
3 Topics 3 Compare methods of characterizing mixed recyclables Review MRF contamination rates Case Study: Quantify the impact of poor data on processing contract management Briefly describe a new solution for more consistent, cost-effective composition and contamination monitoring
 by a processing contract Quantify the value of your recycling stream Understand if recyclers are properly using the recycling program")
4 Why Characterize Recyclables? Required (or allowable) by a processing contract Quantify the value of your recycling stream Understand if recyclers are properly using the recycling program Identify and quantify problem materials Measure recycling capture rates (in conjunction with disposed waste characterization) 4

5 Methods for Characterizing Recyclables 5 Grab Sampling Curb Sampling Run Test with Post- Process Sorting and Mass Balance


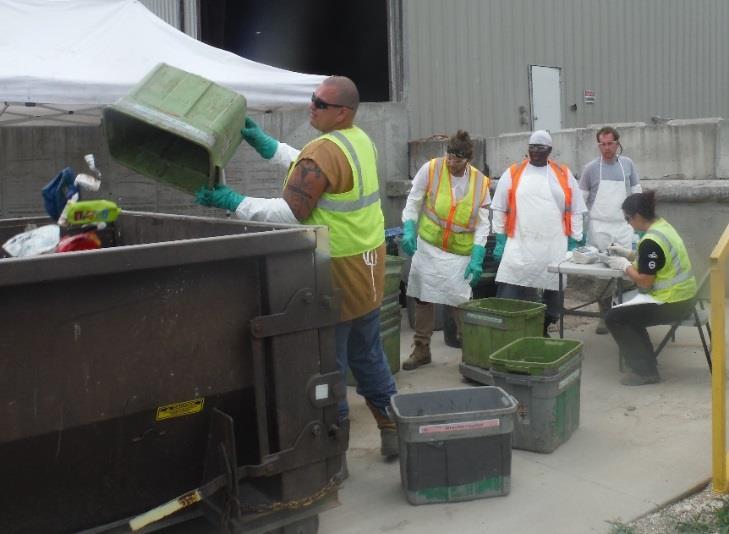
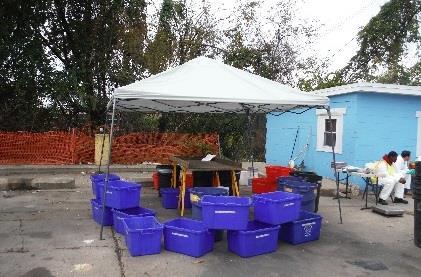
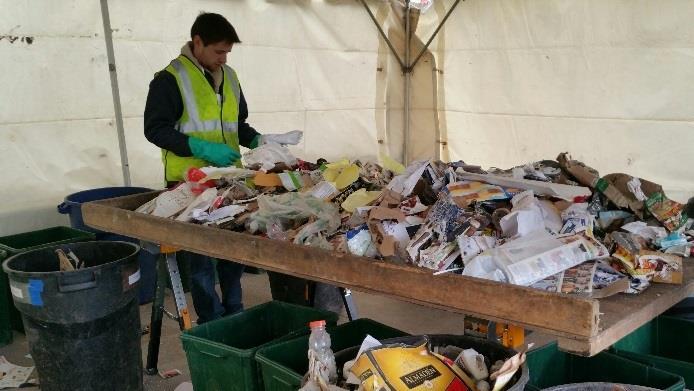
6 All Methods Include Sorting and Weighing 6

 Least expensive Relatively many comparable studies Cons: Obtaining")
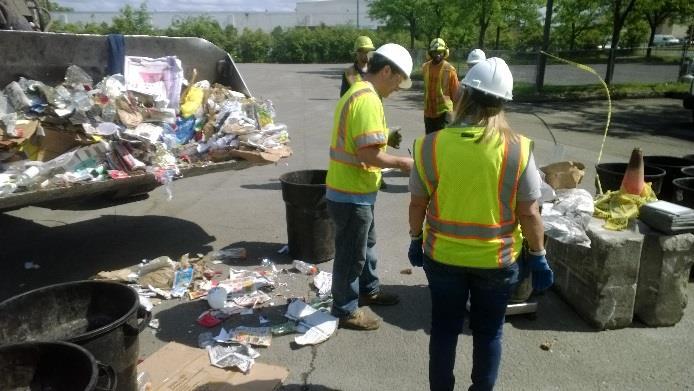
7 Grab Sampling 7 Pros: Based on published standard for material composition analysis Measures composition at the supplier/processor transaction point (on the tip floor!) Least expensive Relatively many comparable studies Cons: Obtaining representative samples is not trivial Statistics


8 Curb Sampling 8 Pro: Provides the best understanding of how effectively residents sort their recyclables Cons Does not reflect the condition of the recyclables when tipped at the MRF May not capture nonresidential and/or multifamily recyclers included in collection program Can be more expensive
 Glass 7 8 9 10 11 12 13 1 2 3 4 5 6 8) PET 9) HDPE Natural 10) HDPE Pigmented 11) Steel 12) Aluminum 13)")
9 Run Test with Mass Balance: Definition 9 1) Pre-sort 2) Pre-sort 3) Bulk Plastic 4) Corrugated 5) ONP 6) Corrugated 7) Glass ) PET 9) HDPE Natural 10) HDPE Pigmented 11) Steel 12) Aluminum 13) Residuals


10 Run Test with Mass Balance Pros: Provides the best understanding of the effectiveness of material separation Tests a large quantity of recyclables Cons: Does not clearly reflect the condition of recyclables as tipped Expensive and intrusive on MRF operations 10
11 52 Recycling Composition Studies 11 Run Test with Mass Balance 1% Grab Sampling 83% Curb Sampling 16% Source: MSW Consultants

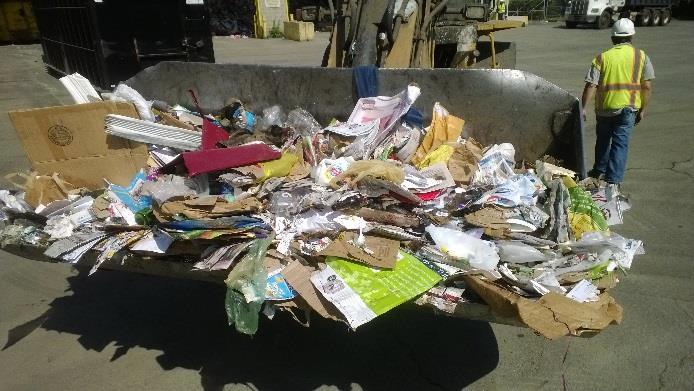
12 Overview of Recycling Contamination Rates 12
13 Definitions 13 Contaminant: Any item that is not targeted by the recycling program (or not allowable under the terms of the processing agreement) Pre-sort stations are typically removing larger contaminants Residue/Residual: Materials that are ejected off the end of the processing line. May include contaminants as well as targeted recyclables that were not captured by sorting system (yield loss).
14 Inbound Recycling Contamination: US Overview 14 Recycling Stream Attributes Collection Method Curbside Date Range Generators Residential Mixed States of Origin: 21 Wastesheds State Region County/City Facility Material Streams Single Stream Mixed Fiber Commingled Containers Source: MSW Consultants
15 Inbound Recycling Contamination Minimum Contamination Rate: Less than 4% Curbside fiber stream 2013 Pre-carts Maximum: Almost 40% Curbside, carted single stream Other Contamination Rate Observations Average Contamination Fiber 5% Commingled Containers 14.5% Single Stream 20% 32% of single stream recyclables exceeded 25% contamination 68% exceeded 15% contamination Source: MSW Consultants
16 Inbound Recycling Contamination: Northeast 16 Year Study Recyclables Contamination Rate 2015 Connecticut Statewide Single Stream 18.2% 2017 New York City Residential Dual Stream Metal/Glass/Plastic 19.5% 2017 New York City Residential Dual Stream Paper 8.3% 2017 Philadelphia Residential Single Stream 19.2% 2014 Boston Residential Single Stream (Curb Sort) 8.4% % Average 15.2%
17 Inbound Recyclables Audit Case Study
18 Audit Results Group Material Percent Calculated Value Market Value ($/Ton) Weighted Value ($/Ton) Paper Corrugated Cardboard 28.9% $81.25 $23.48 Residential Mixed Paper 19.6% $50.31 $9.86 Aseptic Packaging and Gable-Top Cartons 0.3% $ $0.36 $70/ton Plastic #1 PET Plastics 4.2% $ $11.41 #2 HDPE Plastics Natural 1.0% $ $6.12 #2 HDPE Plastics Colored 1.3% $ $6.31 #4, #5, #7 Plastics 0.6% $0.40 $0.00 Bulky Rigid Plastics 3.0% $5.00 $0.15 Glass Glass Bottles and Broken Glass 17.7% -$ $2.75 Metal Aluminum Beverage Cans & Trays 1.2% $1, $15.19 Steel/Aerosol Cans 1.2% $53.75 $0.66 Contamination 18.0%
19 Follow-up Audit Results Group Material Percent Follow-up Audit Value Market Value ($/Ton) Weighted Value ($/Ton) Paper Corrugated Cardboard 18.0% $81.25 $14.63 Residential Mixed Paper 22.8% $50.31 $11.47 Aseptic Packaging and Gable-Top Cartons 0.3% $ $0.36 $66/ton Plastic #1 PET Plastics 5.1% $ $13.99 #2 HDPE Plastics Natural 1.1% $ $6.81 (6% less) #2 HDPE Plastics Colored 1.3% $ $6.54 #4, #5, #7 Plastics 0.5% $0.40 $0.00 Bulky Rigid Plastics 1.5% $5.00 $0.08 Glass Glass Bottles and Broken Glass 28.0% -$ $4.34 Metal Aluminum Beverage Cans & Trays 1.2% $1, $15.78 Steel/Aerosol Cans 2.2% $53.75 $1.18 Contamination 22.0%
20 Financial Impact 20 $300,000 swing
21 Composition Time Series 21 35% 30% 25% 20% 15% 10% 5% 0% May-August 2015 May 2016 August 2016 October 2016 April 2017 July 2017 October 2017 Corrugated Cardboard Mixed Paper Plastic Bottles Glass Contaminants March 2018
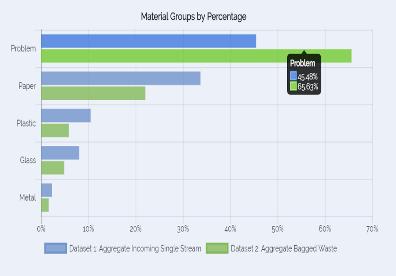
22 Bagged Wastes Bagged materials have averaged 4.6 percent of inbound recyclables Over time bagged materials have contained incrementally more Contaminants Contaminants, 38% Targeted Recyclables, 62%
23 Conclusions: Recycling Composition Depends on the methodology Bagged materials? Newspapers in sleeves? Is influenced by many factors Weather Routes Seasonality Changes over time Is hard to measure 23 Is best measured through routine audits that capture material samples over time from all routes and all seasons
24 Is there a better way to audit recyclables? 24 S E E K I N G F E E D B A C K F R O M C I T I E S, T O W N S A N D P R O C E S S O R S
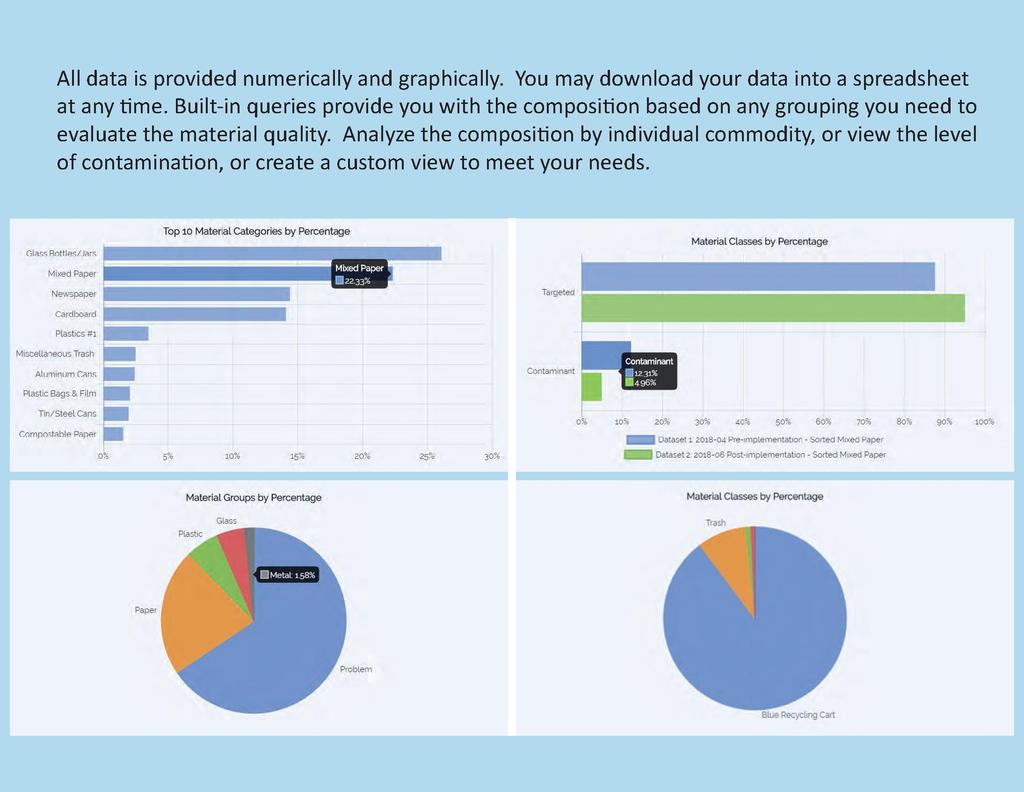
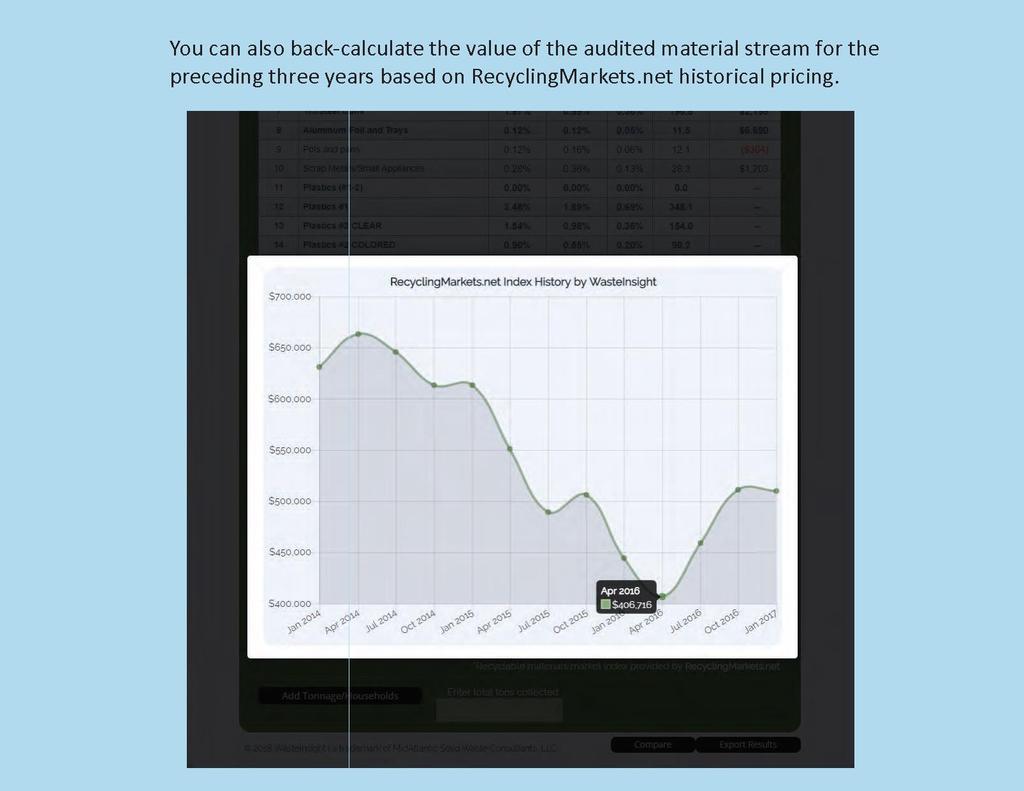
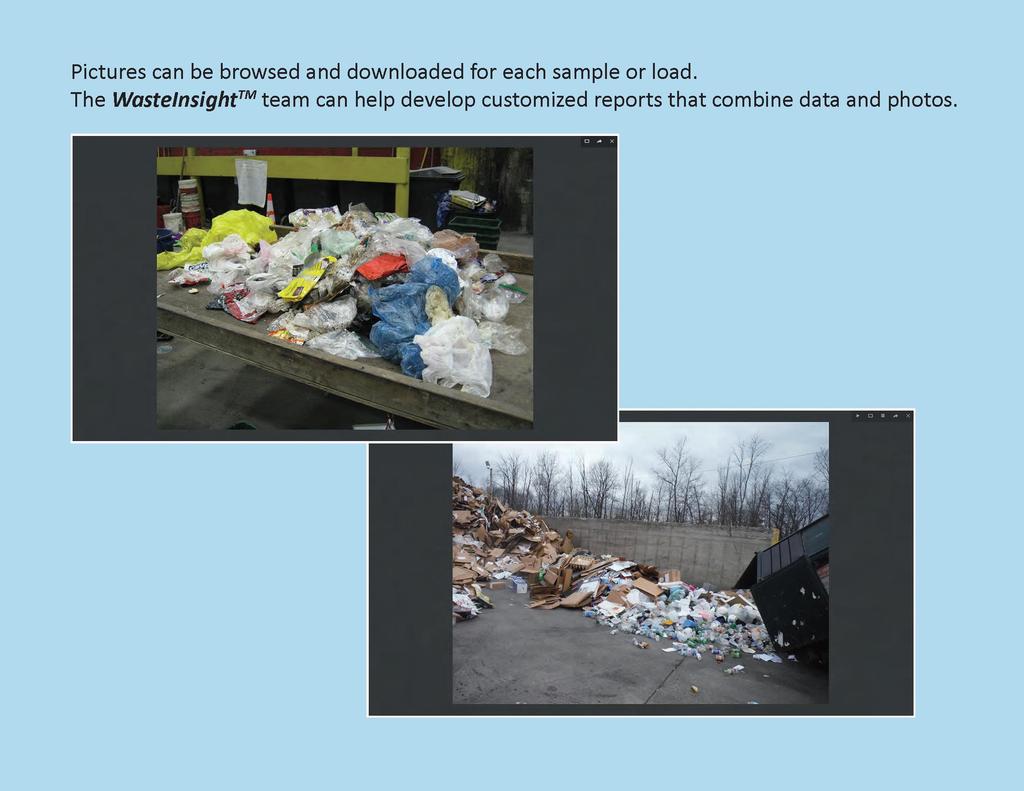
25 How can audits be easier, cheaper, better? Collaboratively developed audit protocol that meets technical standards 25 Standardized, proven sorting tools and equipment Web-based data management platform Upload and analyze audit data Store pictures of inspected loads and/or audited samples Share data with processor and supplier in real time
")
26 WasteInsight 26 The Grading and Purity (GAP) System
27 27
28 28
29 29

30 Feedback Requested John Culbertson, Principal (407)

31 WasteInsight 31 GAP System in Action