and the quality of air we breathe directly impacts our health & performance
|
|
|
- Betty Waters
- 5 years ago
- Views:
Transcription


1 TERI


2 Air is essential for life and we cannot survive more than 2 minutes without air and the quality of air we breathe directly impacts our health & performance


3 It is estimated that we spend about 80-90% of time indoors. and on an average an office employee spends >8 hours indoors


4 In India, contribution of IAP to AAP is estimated to vary between 22 and 52 % (UNEP)
5 Air quality within and around buildings and structures, especially as it relates to the health and comfort of building occupants - EPA IAQ can significantly impact the health, productivity and sense of wellbeing of employees at workplace. Prolonged exposure to the indoor air pollutants could also lead to Sick Building Syndrome which could result in decrease in productivity.
6 While ambient air quality is slowly attracting attention, Indoor air quality is still ignored. US EPA: indoor air pollution poses a greater risk than outdoor air pollution - people spend 80-90% of their time indoors (Yu and Browers, 2013) IAQ is directly linked to health of the occupants of a building IAQ is an important concern both rural and urban VOCs indoors could be 2 to 5 times higher than outdoors IAP is a global issue due to adverse effects on human health (Tsakas, Siskos and Siskos, 2011) IAP ranked among the top five environmental health risks to the public by EPA.
7 GBD-Lancet, 2012 IAP cause estimated deaths in 2

8 Base on Specific Building Combustion activity Furniture Chemical Building materials Food Water Smoking activity Outdoor air pollution

9 Source: ww.standardheating.com

10 Location Sources Pollutant Offices, government buildings HVAC systems, carpets, painting & polishing, household cleaners, aerosols, insecticides, pesticides and personal care products Primary: PM, VOCs Additional : CO, NOx, SO2 Parking areas Vehicular movement Primary : PM, CO, NOx, HC Additional : SO2, PAHs, Public places such as restaurants, hotels, libraries, shopping malls (misc. sources Rural households using biomass HVAC systems, carpets, painting & polishing, insecticides, pesticides, smoking, constriction activities Biomass burning for cooking, heating, waste burning. Kerosene burning for lighting, Primary: PM, VOCs, Nicotine Additional : CO, NOx, SO2 Primary: PM, CO, BC Additional : VOCs
11 Enclosed space inhabited by humans produce the following effects Oxygen level or CO 2 level Increase in temperature and humidity Increase in bio-aerosol and odor Accumulation of air pollutants

12
13 Domestic 58% 2010 Automobile Ind(Proc.) 0% 2% Paints Personal 8% care Oil& 2% Gas Printing 2% 3% Industry Transport Food & oil 0% 9% 1% Open burning 6% Evap. Trans Refinery 3% DG sets 2% 1% Forests 4% Refinery 3% Evap. Trans 19% Open burning 3% Ind(Proc.) 4% Waste 0% DG sets 0% Tyres 0% Printing 6% Oil& Gas Personal 4% care 5% 2010, paints contribute to 8% NMVOC emissions in India. In next 20 years, the share is about to grow to 25%. This has implications over outdoor and indoor air quality. 2030Transport Forests Food & oil 9% 2% 1% Industry 1% Paints 25% Domestic 15% Power 0% Automobile 1%


14 CO 2 in mg/m mg m -3
")


15 PM 2.5 (µg/m 3 ) 25 mg m -3

16 VOC (ppm) 0.31 ppm
17

18 Solid-fuel using households Balakrishnan et al (SRU group)


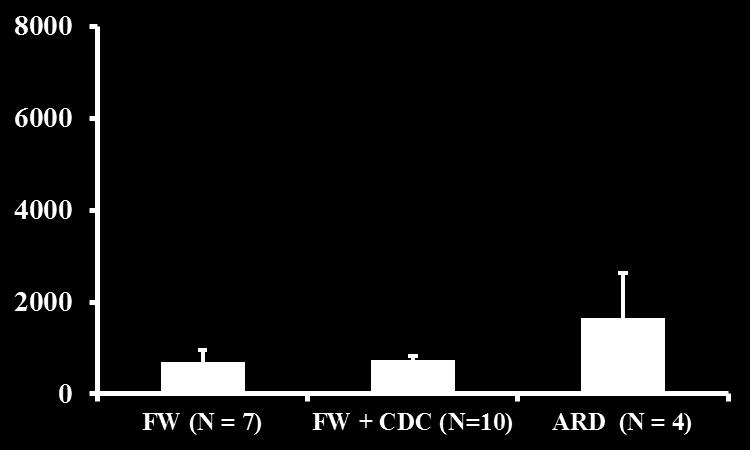
19 Bhallabgarh M Sehgal et.al mg m -3 Sunderban A Datta et.al
, Sunderban")

20 PM 2.5 Level in different Kitchen during the Cooking Time (Winter, 2014), Sunderban Morning Evening Traditional cook stove Sampled Household Number Improved cook stove A Datta et.al
21 Project SURYA
22 Workplace exposure, Petrol Pumps Sehgal, M., Suresh, R., Sharma, V. P., and Gautam S. K Variation in air quality at Filling Stations, Delhi, India, International Journal of Environmental Studies, DOI: /
23 Workplace exposure, Petrol Pumps Install vapour recovery systems in fuel refueling outlets to reduce benzene emissions in NCR. CPCB has issued direction for installation of stage I and Stage II vapor recovery system in all retail outlets with capacity 3000 klm and more in 46 million plus cities by December In Delhi and NCR all retail outlets should comply with this. The final Comprehensive Action Plan by Environment Pollution Control Authority (EPCA), lists Action for reducing Vehicular Emissions. (source: NCR.pdf)

24 Workplace exposure, Toll booths
25 Pollutant NO 2 CO VOCs RSPM Pesticides SO 2 Asbestos O 3 Health effects Type: Immediate: Causes: irritation to the skin, eyes and throat, cough etc Type: : Immediate; Causes: headache, shortness of breath, higher conc. May cause sudden deaths. Type: : Immediate; Causes: Liver, kidney disorders, irritation to the eyes, nose and throat, skin rashes and respiratory problems. Type: : Cumulative, Causes: Respiratory Illness (upper and lower), Acute (Asthma) and chronic (COPD), Lung cancer, Type: : Immediate; Causes: Skin diseases Type: : Immediate; Causes: lung disorders and shortness of breath Type: : Cumulative; Causes: Lung cancer Type: : Immediate; Causes: eyes itch, burn, respiratory disorders, lowers our resistance to colds and pneumonia.
26 Building occupants experience acute health and comfort effects which is linked to time spent in the building, but no specific illness or cause identified. 60% 50% 40% 30% 20% 10% 0% Inadequate ventilation Contamination from inside building Contamination from outside building Microbial contamination Contamination from building fabric Unknown sources EPA

27
28 Effect of temperature, RH and CO2 Temperature direct impact on perceived comfort and, concentration and productivity As per ASHRAE Standard 55, recommended temperature ranges termed "comfortable" are 22.8 to 26.1 C in the summer and 20.0 to 23.6 C in the winter. Relative humidity CO 2 Provides good Too high RH can contribute to the growth and spread of biological contaminants RH below 25% - increased discomfort and drying of skin and mucous membrane As per ASHRAE Standard 55, indoor humidity levels to be maintained between percent for optimum comfort. indication of ventilation rates Generated in indoor primarily through human metabolism CO 2 build up in indoor is attributed to inefficient or nonfunctioning of ventilation system As per ASHRAE, above 1000ppm CO 2 requires adjustment of building s ventilation system Building shows SBS symptoms if CO 2 concentration > 1000 ppm
29 1. Canada 2. Singapore 3. UK 4. Germany 5. USA 6. China 7. India??
30 Parameter WHO guideline value* ASHRAE** OSHA*** NAAQS/EPA (2000)**** PM 10 50µg/m 3 (24-hr mean) -- 15mg/m 3 (total) 150µg/m 3 (24-hr) PM µg/m 3 (24-hr mean) -- 5mg/m 3 (resp.) 65µg/m 3 (24-hr) SO 2 20µg/m 3 (24-hr mean) -- 5ppm (8-hr) 140ppb (24-hr) 75ppb (1-yr) NO 2 200µg/m 3 (1-hr) 40µg/m 3 (annual mean) -- 5ppm (8-hr) 53ppb (annual) 100ppb (1-hr) CO 10ppm (8-hr) 9ppm (8-hr) 50ppm (8-hr) 9ppm (8-hr) CO ppm (8-hr) 5000ppm Humidity -- 30% - 65% -- Temperature F 74.5 F ( o C)(winter) 73 F 79F o C)(summer) -- *** Occupational Safety and Health Administration Permissible Exposure Limit this level is a time-weighted average and is an enforceable standard that must not be exceeded during any eight-hour work shift of a 40-hour work week ** ASHRAE (American Society of Heating, Refrigerating and Air-conditioning Engineers Inc.) Standard 55 * WHO air quality guidelines global update 2005 and WHO guideline value for the classical air pollutants (WHO 1999a **** The National Ambient Air Quality Standards (NAAQS) were developed by the U.S. Environmental Protection Agency (EPA) under the Clean Air Act (last amended in 1990). These enforceable standards were developed for outdoor air quality, but they are also applicable for indoor air contaminant levels. The concentrations are set conservatively in order to protect the most sensitive individuals, such children, the elderly, and those with asthma.
31 *Unless otherwise specified, values are given in parts per million (ppm) *Where no time is specified, the averaging time is eight hours.
32 Source Management Preventing use of substances containing harmful materials Administrative Engineering Controls Controls Controlling Controlling human factors activities causing causing exposure indoor air Policy making pollution
33 Lot of indoor air pollutants directly linked to items of daily use Cleaning items Fuels and cook-stoves (low VOC products) (Clean fuels) Building materials and furnishings (low VOC products) Building occupants may be the source of pollutants - perfumes or colognes, cigarette smoke (OSHA, 2011)
34 Work schedules Education and Awareness Eliminate or reduce the amount of time a worker is exposed to a pollutant Reduce the amount of chemicals being used by or near workers Control the location of chemical use Inform about the sources and effects of pollutants Inform about proper operation of ventilation system Awareness about clean alternatives, mitigation solutions Housekeeping Prevent dirt from entering the environment Dispose garbage timely Store food properly Choose cleaning products, methods that minimize introduction of pollutants into the building
35 HVAC (heating, ventilation, and air conditioning systems) control and management IAQ improving plants Air purifiers
 298 (English Ivy) 1622 (Barberton Daisy) Plants are effective in removing VOCs Reduce microbes and molds Increase humidity PM?")
36 Pollutants Benzene Formaldehyde Trichloro ethylene µg/h of pollutants removed 579 (English ivy) 4486 (Barberton daisy) 183 (Chinese evergreen) 3196 (Bamboo palm) 298 (English Ivy) 1622 (Barberton Daisy) Plants are effective in removing VOCs Reduce microbes and molds Increase humidity PM????

37

38

39 42% 60%


40 42% 74%
41 reduction w r t background PM % 90% 80% 70% 60% 50% 40% 30% 20% 10% 0% 15 min 30 min 45 min 60 min 90 min Building 1 Building 2 Building %
42 reduction w r t background PM % 90% 80% 70% 60% 50% 40% 30% 20% 10% 0% 15 min 30 min 45 min 60 min 90 min Building 1 Building 2 Building %
43 National standards and/or guidelines on indoor air quality Verifying claims of products certifications Evaluation of important existing buildings GRIHA Rating evaluation to be included in building projects Improving outdoor air quality will help in improving IAQ also and vice versa.

44

45 Thank you