Planning for the Transformation of Power Systems. Asami Miketa and Francisco Gafaro IRENA Innovation and Technology Centre
|
|
|
- Estella Manning
- 5 years ago
- Views:
Transcription
1 Planning for the Transformation of Power Systems Asami Miketa and Francisco Gafaro IRENA Innovation and Technology Centre Bonn University/IRENA lecture series - Renewable Future 26 October,
2 Power Sector Transformation in the context of Global Energy Transition» Decarbonization of the energy sector» Increasing cost competitiveness of solar PV and wind based generation Source: 2
3 A global view to 2050 Energy Transition To meet 2 C climate target set at COP 21 in Paris 2015 Energy-emission budget: o 790 Gt CO 2 from 2015 till 2100 Carbon intensity of energy: o needs to fall by 85% in Total energy CO 2 emissions from all sectors (Gt CO 2 /yr) Energy efficiency Electrification with RE power Renewable energy Others 10% 48% 14% 29%

, Renewable Energy Target")
4 43 countries with RE targets in 2005 In 10 years 164 countries IRENA 2017 Source: IRENA (2015), Renewable Energy Target Setting

5 Dropping costs Source: IRENA renewable cost analysis 5

6 With PPA results for future plants converging for solar & wind Source: IRENA renewable cost analysis 6

7 The transformation of the power system Source: 50Hertz Source: 50Hertz Source: 50Hertz around plants around plants around plants Wind Photovoltaics Biomass Example in Germany Source: 50Hertz 7


8 The transformation is happening everywhere regardless of the size 8

9 On-going global power sector transformation Solar and wind accounted for 50% of total capacity additions in 2015 Share of renewables in total capacity additions Since 2012 >50% of total capacity additions 2016 Installed 2006 GW RE power generation capacity Annual RE capacity addition 161 GW of which: 71 GW solar 51 GW wind 30 GW hydropower 9 GW biomass Around 25% RE power generation share worldwide; growing by 0.7 percentage points per year
10 Transition ahead Source: REmap 2030


11 Challenges at different levels Successful transformation requires: Political commitment - stable regulatory framework Planning for coherent energy systems Innovative solutions
 Long term, least cost capacity expansion plan Best practices in longterm scenario-based modelling report, Planning for the renewable future Recommendations were discussed at a Latin")

12 Power Sector Transformation at IRENA Market design, regulation, business models Adapting electricity market design to high shares of VRE Country regulatory advice Power sector innovation landscape report (Q4 2017) Long term, least cost capacity expansion plan Best practices in longterm scenario-based modelling report, Planning for the renewable future Recommendations were discussed at a Latin American regional workshop Unit commitment and economic dispatch Production cost modeling Developing flexibility assessment to be applied to 5 REmap countries Developing a global storage valuation framework, to assess the value of storage in different markets Find the optimal pathway for power sector transformation Grid studies Technical network studies A guide for VRE integration studies is upcoming Technical assessments for larger systems


13 Capacity (MW) Generation expansion planning Future energy mix and investment path Compliance with long-term energy policy goals Political consensus making Linked often with non-power sector planning Department of Energy Regulatory commission Utility Specialized agency 13

14 Long-term Planning in South America» Regional workshop in August in Buenos Aires, Exchanging best practices to incorporate variable renewable energy into long-term energy/power sector planning in South America» Energy planners from 10 countries with 50 participants


15 * Uruguay does not make the planning document publically avaiable Planning reports from the governments Argentina Bolivia Brazil Chile Colombia Ecuador Mexico Peru Paraguay
16 Purpose of long-term planning Basis for policy making Colombia: Bases for policy making, establishing signals for investment and capacity expansion needs Uruguay: To design policies to support technologies to promote and investment needs Brazil: To be used as a basis for formulating public policies Argentina: To establish a framework of discussion for the design of new policies and for the discussion with actors of the sector.
17 Planning scopes Country Scope Planning horizon Update Argentina Energy 2025 Annual Bolivia Electricity 2025 NA Brazil Energy years Chile Energy years Colombia Electricity 15 years Annual Ecuador Electricity years Mexico Electricity 15 years Annual Paraguay Energy / electricity 2040 / / 2 years Peru Energy 10 years 2 years Uruguay Energy / Electricity 2035 / 2040 Annual


18 Long-term planning African context Summary from Planning renewable energy strategies: Africa power sector, Achievements and way forward, Abu Dhabi January 2015 Long-term energy planning, if done properly, - Can help to avoid costly investment mistakes - Creates consensus among stakeholders - Reduces uncertainties in policy directions/project selection - Sends investors signals on types & quantity of investment needs - Accelerate service delivery


19 Power sector planning: Focus areas for techno-economic analysis Capacity (MW) Generation expansion planning Government planning office Planning agency Utility Dispatch simulation Utility Regulators TSO Geo-spatial planning Government planning office Planning agency Utility TSO Technical network studies TSO Regulator Project developer

20 VRE characteristics that influence the long-term investment decision» Dependent on weather conditions» Change quickly» Limited predictability» Site specific quality» Generators are non-synchronous 20
21 Variability lack of correlation with demand Good solar and good wind are not guaranteed when needed Too much generations when not needed Back Source: 21
22 More capacity is needed to meet the same demand 2030 scenarios for West Africa TWh 300 And utilization rates of thermal generators get reduced GW Reference RE target - Reference RE target Oil Natural Gas PP Coal PP Large Hydro PP Small Hydro Biomass PP Solar PV - Utility PP Solar PV - Rooftop Wind PP 22
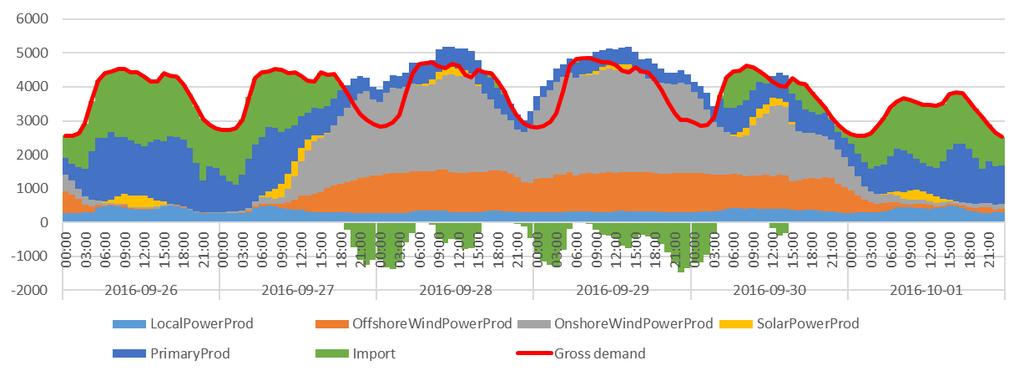


23 Interconnector Balancing through trade Eg. Denmark MWh/h 23
24 Operational constraints (stability) High instantaneous penetration levels, security & stability of the system must be ensure This may lead to curtailment 24
25 Stability of a power system» Synchronized generators (fossil generators, large hydro, CSP) conventionally provide grid stability (support recovering from the disturbance)» Having a fewer synchronized generators pose a challenge to a grid stability» New engineering solutions are avaiable but not all are economical Source: 25
26 Variability fast changes in generation Steeper ramps: Increase in ramping capability may be required Source: 26
27 Aggregation and geographic diversity Source: NREL/FS-6A can smooth out variability

28 Flexibility of a system matters 28 Source: Denholm, P., Hand, M. (2011)

29 Flexible thermal generation Higher speed of output change Lower minimum generation level Shorter start up time 29
30 Location specificity 30

31 Case study: China wind curtailment 17% on average in 2016 with less than 5% VRE generation A combination of market design and technical factors causes high levels of curtailment:» Wind resource in NW, demand in East» Guaranteed operating hours for coal plant and fixed prices no flexibility» Lack of transmission capacity» Provincial level power system balancing Source: Agora 31 Energiewende
32 IRENA 2017 Overcoming technical and operational bottlenecks


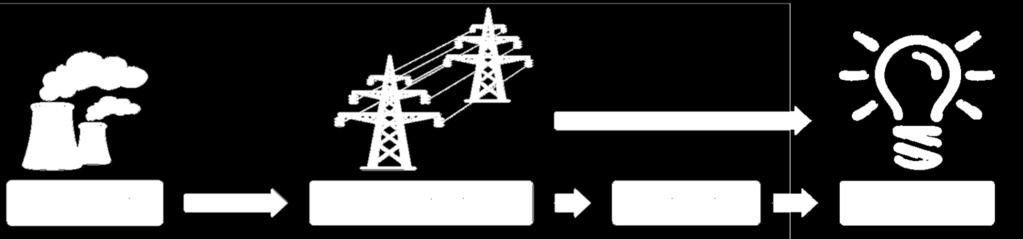
33 The transformation of the power system Centralised Power Generation including large scale VRE Power Transmission: High Voltage Network Long distance transport of large blocks of power PowerFlow Power Distribution Medium/Low Voltage power delivery including VRE Residential, commercial industrial customers Different voltage levels- Distributed VRE 33
34 The technical Challenges How to develop the system to maximize the value of VRE generation as it comes - and still ensure the security of supply? Preconditions for secure system operation: Availability of power to cover demand (adequate generation fleet) Adequate network and associated infrastructure Availability of ressources to cover system imbalances in the operational hour System stability 34
35 Frequency Control Disconnection of generation The frequency of a system depends on the instantaneous balance of power 60 / 50 Hz Disconnection of load System operators schedule generation resources to meet demand, however 100% accuracy is not possible flexibility to rapidly adapt schedules to changing conditions and regulating reserves to cover unavoidable deviations are necessary 35
» Voltage control is achieved by production and absorption of reactive power» Reactive power sources:» Generators, capacitor banks, underground cables» Reactive power")
36 Voltage Voltage control Vmax Vmin Voltage control node Load s Injection of active power also affects voltage higher influence in distribution networks (i.e. PV in distribution feeders affect voltage)» Voltage at terminals of connection of equipment must be within acceptable limits (i.e. +/- 10% of nominal voltage)» Voltage control is achieved by production and absorption of reactive power» Reactive power sources:» Generators, capacitor banks, underground cables» Reactive power sinks:» Generators, reactors, motors, transformers» Methods of Voltage control:» Generator AVR» Controllable sources or sinks of reactive power (i.e. capacitor banks, SVC, STATCOM, etc)» Regulating transformers (i.e. tap changing transformers)

37 The technical Challenges 37
38 Solutions for the recognised issues are already in place Provision of grid services from VRE Strong transmission grids. Interconnection with neighbour systems. Flexible conventional generation. Storage/ demand side management. Specialised forecasting and operational planning tools SmartGrids to SmartEnergy to optimize RES utilization across energy sectors and support price flexibility Looking forward for new innovative solutions 38


39 Planning the secure operation of the power system Long term generation adequacy planning Long term grid adequacy planning Update of operational constraints / reserve requirements Outage planning and programming Source: Amprion GmbH Day ahead generation scheduling & Security Checks Real time operation Power system operation and planning aims to provide a reliable and efficient supply of electricity at any time. Operation of the power system is a very complicated and critical task that must be supported by a strong planning process. 39
, Antigua & Barbuda (grid study), Barbados (revision of studies), CARILEC (technical workshops),")
40 Engagement with Member Countries Cooperation with decision makers, network operators and technical experts at a global level supporting exchange of experiences on grid operation & expansion Until now focus on small islands but moving towards larger interconnected systems Dominican Republic (grid study), Antigua & Barbuda (grid study), Barbados (revision of studies), CARILEC (technical workshops), CUBA Workshop Planning and Operating the Electricity System DIgSILENT, TU Darmstadt, TRACTEBEL-ENGIE (Access to simulation Software, technical guides) Samoa, Cook Islands, Palau (grid studies), Kiribati (support in realisation of study), Fiji, Vanuatu (on-going studies, technical workshops) Central America, Starting technical study. This initiated a step moving towards bigger systems. 40


41 Asami Miketa Francisco Gafaro
42 Different interaction with the grid Conventional power pant Solar power plant VS Source: CPES Virginia Tech Physical principle, and included interface between the grid and the source of energy is different. Inertia Robustness of the system and capability to control frequency and voltage may be affected (stability). Minimum grid performance requirements and technical assessment to identify security threads are required. Source: Back 42

43 VRE properties and challenges example California Back Source: CAISO and L. Jones 43
44 C2 XX MW Transmission system adequacy TRANSMISION SYSTEM OVERVIEW 2016 Zone 4 N1 XX MW Zone 2 Area 2 Peak demand: 700 MW Low demand: 400 MW Installed Capacity:1500 MW Zone 8 Zone 6 N3 XX MW N6 XX MW N2 XX MW N7 XX MW Zone 9 N4 XX MW N8 XX MW N5 XX MW N9 Zone 5 Total Transfer Capacity 564 MW Area 3 Peak demand: 1500 MW Low demand: 565 MW Installed Capacity: 1200 MW N10 C1 XX MW Zone 10 Total Transfer Capacity 500 MW Zone 11 S3 314 MW Zone 7 C4 XX MW Area 1 Peak demand: 500 MW Low demand: 350 MW Installed Capacity: 600 MW S2 155 MW Zone 1 C3 XX MW Zone 3 Zone 13 S1 45 MW Zone 12 Increase transmission capacity required High Wind Resources Zone identified for future development Back 44


45 Rapidly declining costs Source: IRENA 45